ESTIMATION OF HABITAT SUITABILITY AREA OF ENDANGERED SPECIES USING MAXENT IN FUKUSHIMA PREFECTURE, JAPAN
←
→
Page content transcription
If your browser does not render page correctly, please read the page content below
International Journal of GEOMATE, May., 2021, Vol.20, Issue 81, pp.93-99
 ISSN: 2186-2982 (P), 2186-2990 (O), Japan, DOI: https://doi.org/10.21660/2021.81.6215
 Geotechnique, Construction Materials and Environment

                ESTIMATION OF HABITAT SUITABILITY AREA OF
                    ENDANGERED SPECIES USING MAXENT
                     IN FUKUSHIMA PREFECTURE, JAPAN

                             * Hideyuki Ito1, Hiromu Tomita2, Makoto Ooba3 and Takahiro Fujii4

         1,4
               College of Science and Technology, Nihon University, Japan; 2Fujita Road Construction, Japan;
                                   3
                                     National Institute for Environmental Studies, Japan

     *Corresponding Author, Received: 2 July 2020, Revised: 8 Feb. 2021, Accepted: 19 Feb. 2021

    ABSTRACT: Fukushima Prefecture is the third largest area in Japan and which has diverse natural
environment such as Mt. Bandaisan, Lake Inawashiro, and the Bandai highlands with beautiful ponds and lakes.
However, since the valuable and rich nature and habitat for endangered species have been destroyed by rapid
urbanization and infrastructure development. Thus, the purpose of this research is to analyze the time-series
change of habitat area for four endangered species: the golden eagle (Aquila chrysaetos), northern goshawk
(Accipiter gentilis), Japanese macaques (Macaca fuscata), and Asian black bear (Ursus thibetanus). Maximum
entropy modeling (MaxEnt) software was used to model species distributions and to estimate the habitat
suitability area. As the result, it was concluded that the total suitable habitat area increased slightly for the
golden eagle, but the suitable habitat area for the other three species decreased. In addition, the potential
suitable habitat areas by multiplying the numerical values obtained from MaxEnt by the area also decreased by
3.57% for the Japanese macaque, by 7.44% for the northern goshawk, and by 1.92% for the black bear between
1976 and 2014. Thus, this research suggested the necessity of conservation of their habitat area.

Keywords: MaxEnt, GIS, Endangered Species, Green Area

1. INTRODUCTION                                                              infrastructure development.
                                                                                 Regarding land-use change, numerous researches
    Fukushima Prefecture is the third largest of                             have analyzed areas and green coverage based on
Japan's 47 prefectures and extends over 150 km                               land use classification. A research by Hashimoto et
from the Pacific coast to the mountains of                                   al. [1] on umbrella species, which require large
northeastern Honshu. The prefecture features                                 habitats and specific conditions, elucidated their
diverse natural landscapes such as Abukuma                                   winter habitat preferences in the Lake Inba basin.
highlands, Mt. Bandaisan, Lake Inawashiro, and the                           Field research has also been conducted on raptors,
Echigo Mountains with beautiful ponds and lakes as                           which involved evaluating the impacts of
shown in the Fig.1. However, the number of                                   environmental factors on the birds using the
endangered species in the region has been                                    jackknife method. Ikemi et al. [2] performed
increasing since the 1970s because of habitat loss                           quantitative analysis regarding the impact of artificial
caused mainly by rapid urbanization and                                      landform changes on biodiversity through a time-
                                                                             series analysis of land use changes. Harada et al. [3]
                                                                             conducted quantitative analysis of the extent of
                                                                             degradation of a forest environment by means of a
                                                                             tree census. Iwasaki et al. [4] investigated the
                                                                             changes in land use until the 1980s and the linked
                                                                             increased damage to agricultural products caused by
                                                                             the expansion of the habitat of Japanese macaques.
                                                                             Li et al. [5] researched the impact of environmental
                                                                             variables and land use in Nagoya City on the habitat
                                                                             of raccoon dogs (Nyctereutes procyonoides) and
                                                                             Japanese weasels using maximum entropy modeling
                                                                             (MaxEnt) analysis, albeit without performing a
                                                                             broad-based analysis. Matsuura et al. [6] created
                                                                             vegetation models, for the Yatsu Higata tidal flats
                                                                             and estimated the size of the environment required by
                                                                             the gray-faced buzzard eagle. However, the gray-
Fig. 1 Map of Fukushima Prefecture, Japan                                    faced buzzard eagle also lives in habitats such as

                                                                      93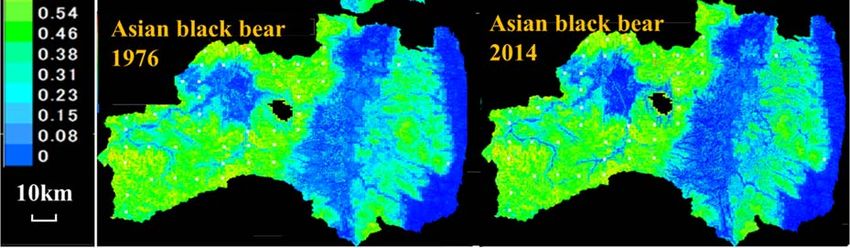
International Journal of GEOMATE, May., 2021, Vol.20, Issue 81, pp.93-99

mountains under conditions different from those of              QGIS. They were then converted into comma
tidal flats. Such habitats were not estimated in this           separated values data so as to be usable in MaxEnt.
research and require further study. Kamata et al. [7]           Having examined various habitat data, these were
proposed methods of forest zoning on the basis of               found to be the most suitable for analysis and
land productivity and mountain disaster risk.                   further use. The habitat data were gathered using a
However, performing analysis concerning wildlife                mesh of 10 km × 10 km. At the time of plotting, the
habitats is also necessary. Miyamoto [8] indicated              points were placed in the land-use category that
focal points for proposing marine protected areas by            occupied the largest portion of the mesh.
applying MaxEnt to the Emperor Seamount Chain                       Table 1 shows the environmental variables used
using limited data. Pan et al. [9] estimated the                in MaxEnt. According to the digital national land
suitable habitat area for the Chinese alligator, which          information [17], seven environmental variables
is a critically endangered crocodilian, and predicted           were used and arranged in MaxEnt using QGIS:
its distribution in Anhui Province, China using                 land use subdivision data concerning Fukushima
MaxEnt. West et al. [10] developed a presence-only              Prefecture from 1976, 1987, 1991, 2006, 2009, and
model of invasive cheat grass (Bromus tectorum)                 2014; mean elevation in 2009; mean inclination
distribution in Rocky Mountain National Park,                   angle in 2009; mean annual temperature, mean
Colorado, USA between 2007 and 2013 with limited                annual precipitation, and deepest annual snow cover,
data for comparison with the results of a generalized           calculated from the mean of the past 30 years; road
linear model. Remya et al. [11] represented current             edge data created between 2015 and 2016 by the
and future habitat suitability distribution of Myristica        Geographical Survey Institute of Japan [18]. Road
dactyloides Gaertn, a medicinally and ecologically              edge data was obtained by calculating distance from
important tree species, using MaxEnt to enable                  the road with the raster distance tool in QGIS and
implementing a sustainable conservation or adaptation           digitizing it for analysis.
strategy. Pratumcharta et al. [12] predicted the
distribution of Bithynia siamensis goniomphalos in              Table 1 Data sets input into MaxEnt
Thailand on the basis of environmental and climatic
factors and also indicated that altitude, land cover,
normalized difference vegetation index, precipitation
in the driest month, land surface temperature and, soil
pH affected its distribution. Emad et al. [13] compared
the habitat suitability similarity between MaxEnt,
Random Forest and ensemble modeling approaches
and it was concluded that MaxEnt is capable of
producing distribution maps of comparable accuracy
to other methods. Cory and John [14] indicated that
both methods of MaxEnt and Maxlike are similarly
valuable for predicting species distributions in terms
of relative differences in occurrence probability.
    Extant researches comprise the evaluation of
lands and forests using geographic information
systems, as well as the evaluation of habitats for
target species using MaxEnt. However, few                           Fig. 2 shows the analyzed target species. The
researches have been conducted on the impacts of                target species were selected from the Fukushima Red
urban development, including transportation                     Data Books I and II. The selection criteria were:
infrastructure development, over time and in a wide             habitat conditions considered to be related to each
area within wildlife habitats.                                  environmental variable used in the research, species
    Therefore, in this research, we analyzed the                with a large habitat (because of the use of data from
time-series change of habitat areas for four                    a 10 km × 10 km mesh), and the condition that the
endangered species: the golden eagle (Aquila                    Fukushima Red Data Books recorded sufficient
chrysaetos), northern goshawk (Accipiter gentilis),             habitat data. As for the extent of habitat data, to
Japanese macaques (Macaca fuscata), and Asian                   ensure consistent accuracy, we selected those with 15
black bear (Ursus thibetanus) using MaxEnt                      or more meshes indicating confirmed habitat.
software for modeling species distributions.                        As a result, the golden eagle and the northern
                                                                goshawk, two raptors with a particularly large
2. DATA                                                         habitat, which are listed in Category I threatened
                                                                species, were selected among birds. Two vulnerable
   The wildlife habitat data used in MaxEnt were                species, the Japanese macaques and the Asian black
obtained from the Fukushima Red Data Books I                    bear were selected among mammals. Japanese
[15] and II [16] compiled in 2002 and, plotted in               macaques and black bears are vulnerable species,

                                                           94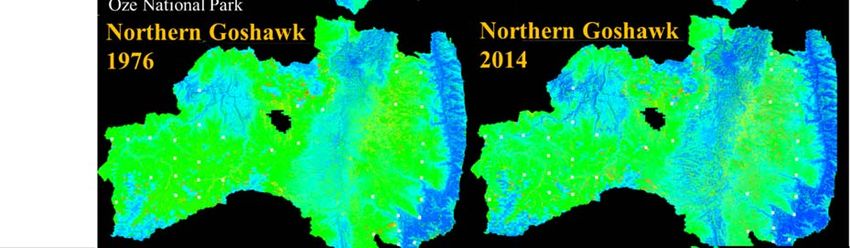
International Journal of GEOMATE, May., 2021, Vol.20, Issue 81, pp.93-99
and although their conservation priority was not Despite conservation activities such as afforestation,
especially high in 2002, they were selected because the number of high-quality forests is likely
of the increasing necessity of measures for decreasing because of the decline of forestry.
conservation and animal protection that were Wasteland area decreased significantly between
expected in the future. 1976 and 2014. Built-up area increased consistently.
The land use classification of each period was The land that is considered unsuitable as a wildlife
based on digital national land information [17]. habitat, such as built-up areas, roads and transit
Land use subdivision meshes have different land corridors, and other land increased by 82.7%
use categories from year to year. To unify land use between 1976 and 2014. The green ratio, including
classifications and be able to perform analysis over rice fields, other agricultural land, forests, and
time, we created a new classification that integrates wastelands, decreased by 2.9% between 1976 and
land use into nine categories: rice fields, other 2014. Since 2009, roads and railways have been
agricultural land, forests, wastelands, built-up area, divided into two categories. This accounts for the
roads and transit corridors, other land, rivers and significant decrease in the area of roads and transit
lakes, and seaside areas. corridors after 2009. Prior to 2009, only one
category was used for both types. Furthermore, in
the applied land use subdivision mesh, the land use
category that occupies the largest area in a 100 m ×
100 m mesh constitutes the land use of that entire
mesh. Thus, even if the area for roads and railways
itself did not decrease, a newly built-up area in the
surroundings might have come to occupy the larger
share in the mesh, thus leading to the land use
designation to be changed from roads and transit
corridors to built-up area.
3.2 Suitable Habitat Area
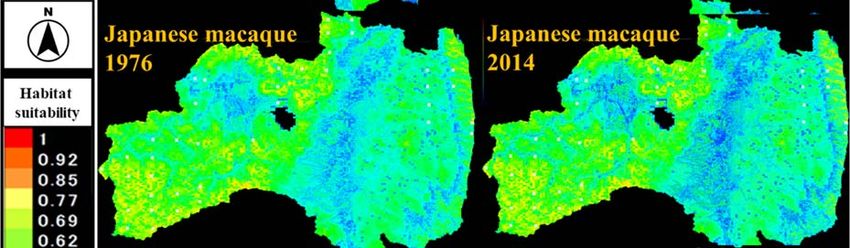
Fig. 3 shows suitable habitat areas for the four
Fig. 2 Target species target species according to MaxEnt between 1976
and 2014. The habitat suitability for the target
3. RESULTS species is expressed on the map as a value between
0 and 1. Habitat suitability increases, represented by
3.1 Land Use Area Comparison a change in color from blue to green, yellow, orange,
and red. White dots are habitat plot data confirming
Table 2 shows a comparison of land use areas in location of the target species.
Fukushima Prefecture. Between 1976 and 1997, the For the golden eagle, suitable habitat is situated
area of rice fields decreased consistently. The area mainly in the southwest and north, for example in
of other agricultural land increased in the same Oze National Park and Aizukomagatake, which
period but decreased after 1997, resulting in a total features rich natural environment. In a comparative
area that was only 0.3% larger in 2014 than it was evaluation of suitable habitats for the period 1976–
in 1976. Forested area decreased between 1976 and 2014, almost no significant change was determined
2006 but recovered considerably after 2009. regarding the habitat suitability map.
Table 2 Comparison result of area of each land use
(1,000ha)
Comparison between
Land use 1976 1987 1991 1997 2006 2009 2014
1976 and 2014 (%)
Rice fields 162.1 157.0 155.0 149.0 149.0 146.8 145.2 -10.4%
Other agricultural land 89.6 96.6 96.5 103.0 95.2 87.4 89.9 0.3%
Forests 1002 997 992 972 971 1015 1009 0.7%
Wastelands 41.4 33.2 32.9 31.0 31.2 15.3 13.7 -66.9%
Buildup Area 36.5 43.0 42.8 54.8 57.3 62.6 63.2 73.2%
Traffic sites 1.6 2.5 6.6 8.1 10.5 1.3 5.4 237.5%
Rivers, Lakes and Ponds 35.1 35.2 35.0 40.9 36.4 30.1 33.6 -4.3%
Coastal Area 14.2 2.8 2.7 18.2 25.2 2.6 1.9 -86.6%
Others 9.3 12.5 16.1 18.8 26.8 18.1 18.0 93.5%
95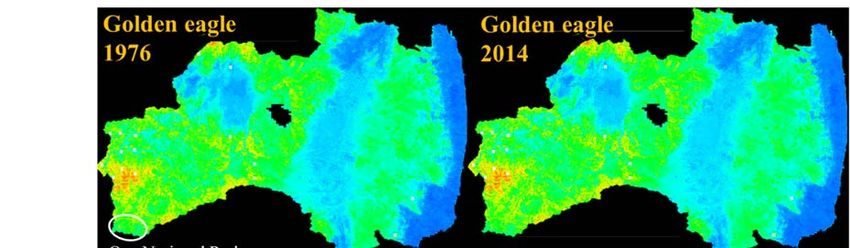
International Journal of GEOMATE, May., 2021, Vol.20, Issue 81, pp.93-99

Fig. 3 Suitable Habitat Area Estimated by MaxEnt

   The habitat suitability map for the northern             development.
goshawk shows that there are numerous suitable                  Suitable habitats for the Japanese macaque were
habitats, for example, in the mountains and the             identified in the northern part of Hamadori and in
northern areas, between Hamadori and Nakadori,              the north and southwest of Lake Inawashiro (black
located in eastern and central Fukushima Prefecture,        part in the center). For Japanese macaques,
respectively. The most considerable change in the           moderate-degree suitability habitats (yellow) were
habitat suitability map between 1976 and 2014 is in         abundant, whereas highly suitable habitats (red and
Nakadori, Fukushima Prefecture, where habitats              orange) were scarce. Because Japanese macaques
with a low degree of suitability have gradually been        may appear in urban areas in search of food, their
increasing. The same tendency can be seen in the            habitat is considered widely distributed. Between
Aizu region and the nearby mountainous areas,               1976 and 2014, no significant change was found in
which are highly affected by recent urban                   the habitat suitability map. However, an apparent

                                                       96
International Journal of GEOMATE, May., 2021, Vol.20, Issue 81, pp.93-99

decrease of suitable habitats in the mountains is
likely attributable to the increase of expressways.
    The habitat suitability map of the Asian black
bear shows suitable habitats in northern and
southwestern Fukushima Prefecture. However,
suitable habitats in these areas have decreased
because of environmental changes as a consequence
of deforestation as evidenced by a high contribution
ratio of forest land.

3.3 Area under Curve and Contribution Rate

      Table 3 shows the area under the curve (AUC)
and contribution rate of respective environmental
factors pertaining to each species. A model with an           Fig. 4 Response Curve on Each Land Use of
AUC value exceeding 0.7 is considered a favorable             Northern Goshawks
model. The closer the value to 1, the more superior
is the model.                                                 forests exhibit reduced visibility and obstruct flight,
      The AUC for the golden eagle was 0.775, a               resulting in a low contribution ratio.
favorable result. Regarding the contribution ratio of              The AUC for the Japanese macaque was 0.766,
the golden eagle, the land use contribution ratio was         which was a favorable result. The highest
at 0.6% and therefore very low. Each environmental            contribution ratio for Japanese macaques was
variable affects the golden eagle. For example, the           temperature, followed by the angle of inclination.
mean slope angles and mean altitude have a large              Regarding Japanese macaques, all environmental
impact. The influence of these two environmental              variables contributed to a degree. Consequently,
factors may be high because the golden eagle lives            habitat suitability tended to be high only in areas
and nests on rocky spots in mountainous areas, such           where all environmental factors were well-balanced.
as steep cliffs. However, the land use contribution           The AUC for the black bear was 0.809, the highest
ratio was only 0.6%. Therefore, the impact of land            among the four target species. In the case of the
use is not substantial. The highest contribution ratio        black bear, the contribution ratios were high for
is that of other agricultural lands.                          temperature, land use, and snowfall. This suggests
      The AUC of the northern goshawk was 0.765,              that the black bear is easily affected by
which is a favorable result. The contribution ratios          environmental factors related to temperature.
of land use and mean altitude for the northern
goshawks were as high as 49.5% and 33.2%,                     3.4 Time-Series Change of Potential Suitable
respectively. Fig. 4 shows the detailed land use              Habitat Areas
contribution ratio for the northern goshawk. Fig. 4
presents the contribution ratio showing which land            Table 4 and Fig. 5 show numerical values
uses are likely to influence habitat suitability and          corresponding to the changes in potential suitable
the likeliness of habitat suitability itself. Since           habitat areas in Fukushima Prefecture over time for
raptors such as the northern goshawk catch their              each of the four species. From the data in the ASC
prey in grasslands, paddy fields, and wetlands,               file obtained by MaxEnt analysis, data pertaining to
which are sites with favorable visibility, the                suitable habitats at a ratio of 0 to 1 were extracted
contribution ratios of rice fields, other agricultural        and used to define potential suitable habitat areas
lands, and wastelands were high. By contrast,                 by multiplying the numerical values by the area of

Table 3 AUC and Contribution Rate of Respective Environmental Factors

                                                         97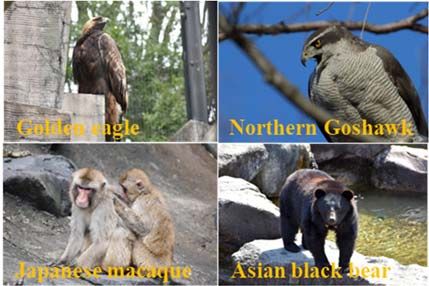
International Journal of GEOMATE, May., 2021, Vol.20, Issue 81, pp.93-99

Table 4 Result of Potential Suitable Habitat Area between 1976 and 2014

                                                                                                     Comparison between
                       1976       1987       1991        1997          2006      2009       2014
                                                                                                       1976 and 2014

   Golden eagle        48.75      48.65      48.81       48.80        48.47      48.75      48.80          0.10%

 Northern goshawk      50.76      51.40      50.76       51.40        51.22      48.01      46.99          -7.44%

 Japanese macaque      54.28      54.04      54.18       53.61        52.40      52.33      52.35          -3.57%

  Asian black bear     43.55      43.37      43.46       43.42        43.08      42.93      42.72          -1.92%

                                                                 4. CONCLUSIONS

                                                                     In this research, MaxEnt was used to analyze
                                                                 suitable and potential habitat areas of four
                                                                 endangered species in Fukushima Prefecture over
                                                                 time, demonstrating the impact of rapid
                                                                 urbanization and infrastructure developments and
                                                                 the tendency for the area of suitable habitats to
                                                                 decrease for all target species except the golden
                                                                 eagle. The reduction rate of potential suitable
                                                                 habitat area for Northern goshawk was particularly
                                                                 high. This is due to the fact that Japan does not
                                                                 require compensatory measures for development by
                                                                 environmental impact assessment law. Thus, it is
                                                                 necessary to actively implement nature restoration
                                                                 projects against past development and to promote
                                                                 conservation policies and systems, such as defining
                                                                 areas of the natural environment to be protected.
Fig. 5 Potential Suitable Habitat Areas of Each                      For future research, the accuracy of the plot data
Species                                                          for habitat areas should be improved by collecting
                                                                 more data and by including additional
                                                                 environmental variables for MaxEnt.
each mesh (100 m x 100 m). A comparison between
1976 and 2014 confirmed a decrease in suitable
                                                                 5. REFERENCES
habitat areas by 3.57% for the Japanese macaque,
by 7.44% for the northern goshawk, and by 1.92%
                                                                 [1] Hashimoto D. and Hasegawa M., Habitat
for the black bear. The suitable habitat areas for the
golden eagle increased by 0.1%. The results suggest                  preference and species distribution modeling of
that a decrease in suitable habitats for wildlife                    raptorial birds inhabiting Inbanuma-lake
because of urban development and transportation                      during winter season, Report of the Chiba
infrastructure has become increasingly likely.                       Biodiversity Center (7), 2014, pp.65-78.
    Fukushima prefecture has relisted northern                   [2] Ikemi H., Esaki T., Mitani Y. and Tran T. A.,
goshawk as Category II [19]. However based on this                   Spatial Distribution of Human Impacts on
prediction, the species has a vulnerability of habitat               Terrain Based on Land-use Change Analysis :
without suitable conservations. While encountering                   Development and GIS Analysis of Land-use
or more serious accident related to black bear                       Maps since 1900 in the Fukuoka Prefecture
increases recently, and the latest result of research                Area, Engineering Geology, Japan, 52(3), 2011,
on population density of the black bear inside the                   pp.97-108.
prefecture supported the increase of the accident
                                                                 [3] Harada I., Matsumura T., Hara K., and Kondoh
[20]. In the future, it needs to conduct the more
                                                                     A., Spatial analysis of changes in Japanese
detailed prediction of habitat of the black bear and
to propose a policy of the ecological conservation                   forests during the process of modernization,
and management for preventing the accident based                     Landscape and Ecological Engineering, 16(1),
on the potential habitat map.                                        2011, pp.17-32

                                                         98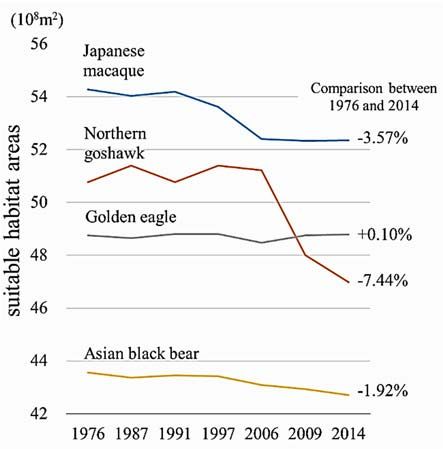
International Journal of GEOMATE, May., 2021, Vol.20, Issue 81, pp.93-99

[4] Iwasaki N., and Sprague D., A study of the land               and Suwannatrai T. A.,        Ecological Niche
     use history in the Japanese macaque habitat                  Model based on Maximum Entropy for
     expansion area of the Boso Peninsula, Japan,                 mapping distribution of Bithynia siamensis
     Journal of Rural Planning Association, 24,                   goniomphalos, first intermediate host snail of
     2005, p.1-6.                                                 Opisthorchis viverrini in Thailand, Acta
[5] Li R., Ooba M., Hayashi K., Noro T., Dhakal,                  Tropica, Vol.193, 2019, pp.183-191.
     A., “The potential distributions of mammalian           [13] Emad K., Victoria N., Abdulaziz A. and
     with land use changes by the MaxEnt model -                  Francis G., A comparison between Ensemble
     case of Nagoya city”, ISETS’13, 2013, pp.13-15.              and MaxEnt species distribution modelling
[6] Matsumura T., Yokohari M., and Azuma A.,                      approaches for conservation: A case study with
     Identification of potential habitats of Gray-                Egyptian medicinal plants, Ecological
     faced Buzzard in yatsu valleys based on DEMs                 Informatics, Vol.60, 2020, 101150.
     and vegetation data, Proceedings of Japanese            [14] Cory M. and John A. S. A comparison of
     Institute of Landscape Architecture, 65(0),                  Maxlike and Maxent for modelling species
     2002, pp.39-39.                                              distributions, Methods in Ecology and
[7] Kamada M., Sanpei R., and Oka K., Method for                  Evolution, 2014, Vol.5, pp.215-225.
     forest zoning in broad area based on the                [15] Fukushima prefecture, Japan, Red Data Book
     evaluation of land-productivity and mountain                 Fukushima, Threatened wildlife, No.1 (Plants,
     hazard, Landscape and Ecological Engineering,                Insects and Birds),
     18(2), 2013, pp.109-122.                                     https://ci.nii.ac.jp/ncid/BA59034142
[8] Miyamoto M., Attempts to estimate habitat of             [16] Fukushima prefecture, Japan, Red Data Book
     cold-water corals, Aquabiology, Vol.35(5),                   Fukushima, Threatened wildlife, No.2
     2014, pp.461-468.                                            (Freshwater fishes, Amphibians, Reptiles and
[9] Pan T., Wang H., Duan S., Ali I., Yan P., Cai                 Mammals),
     R., Wang M., Zhang J., Zhang H., Zhang B.                    https://ci.nii.ac.jp/ncid/BA59034142
     and Wu X., Historical population decline and            [17] Ministry of Land, Infrastructure, Transport and
     habitat loss in a critically endangered species,             Tourism, digital national land information,
     the Chinese alligator (Alligator sinensis),                  http://nlftp.mlit.go.jp/ksj/
     Global Ecology and Conservation, Vol.20,                [18] Geospatial Information Authority of Japan,
     2019, e00692.                                                base map information,
[10] West M. A., Kumar S., Brown S. C., Stohlgren                 http://fgd.gsi.go.jp/download/menu.php
                                                             [19] Fukushima prefecture, Fukushima Red List
     J. T. and Bromberg J., Field validation of an
                                                                  2019,
     invasive species MaxEnt model, Ecological                    https://www.pref.fukushima.lg.jp/sec/16035b/
     Informatics, Vol.36, 2016, pp.126-134.                       redlist-kaiteikouhyou.html
[11] Remya K., Ramachandran A. and Jayakumar                 [20] Fukushima prefecture, The result of habitat
     S., Predicting the current and future suitable               research of the Asian black bear, 2015,
     habitat distribution of Myristica dactyloides                https://www.pref.fukushima.lg.jp/sec/16035b/
     Gaertn using MaxEnt model in the Eastern                     26kuma.html
     Ghats, India, Ecological Engineering, Vol.82,
     2015, pp.184-188.                                       Copyright © Int. J. of GEOMATE. All rights reserved,
[12] Pratumcharta K., Suwannatrai K., Sereewong              including the making of copies unless permission is
     C., Thinkhamrop K., Chaiyos J., Boonmars T.             obtained from the copyright proprietors.

                                                        99
You can also read