AIRTUB: TOWARDS AUTOMATED INSPECTION OF LEADING EDGE EROSION OF WIND TURBINE BLADES BY SHAPE ANALYSIS
←
→
Page content transcription
If your browser does not render page correctly, please read the page content below
AIRTuB: towards automated inspection of leading edge erosion of
               wind turbine blades by shape analysis
    Andrei G. Anisimov*a, Ronald Beukemab, Jason Hwangb, Rogier Nijssenc, Roger M. Grovesa
          a
           Aerospace Non-Destructive Testing Laboratory, Delft University of Technology,
                          Kluyverweg 1, 2629 HS, Delft, the Netherlands
    b
      Netherlands Aerospace Centre NLR, P.O.Box 90502, 1006BM Amsterdam, the Netherlands
                     c
                      TNO, Westerduinweg 3, 1755 LE, Petten, the Netherlands

                                                        ABSTRACT

The harsh environment, especially for offshore wind turbines, significantly degrades wind turbine aerodynamic
performance and structural integrity. One of the major factors that lowers energy production due to aerodynamic losses is
the erosion of the leading edges. Nowadays this erosion is monitored visually, either directly or with drone-based camera
systems. In this paper, we address the quantitative characterization of the current erosion state. This enables long-term
degradation monitoring to provide crucial information for wind farm maintenance and possible recoating of wind turbine
blades. In this project, a customized long-range laser line scanner is used to measure the profiles of the blades at distances
of up to 2 m. This distance was identified as a safe clearance between the drone and the blade. Current results include
detection of eroded and damaged areas with a sub-millimetre resolution in the laboratory conditions on a real out-of-service
blade with the sensor positioned with a scanning frame. Further in the project, a custom-developed heavy drone will be
used to scan the blades offshore. The erosion and defect detection approach is based on deterministic analysis of the
individual profiles obtained with the laser scanner and includes local analysis of the surface variation, thresholding and
clustering of the defects. Later the developed deterministic approach will be benchmarked with machine learning
capabilities. Future steps include the integration of the laser line sensor in the drone, hangar flight tests and a series of
offshore inspections. This development is done within the smart maintenance innovation project AIRTuB: Automatic
Inspection and Repair of Turbine Blades where the inspection expertise is combined with drone developers, wind-turbine
manufacturers, repair and maintenance services.

Keywords: leading edge erosion, laser line scanner, defect detection, erosion detection, erosion measurement, drone-based
metrology, point cloud, defect feature

                                                  1     INTRODUCTION
The harsh environment, especially for offshore wind turbines, significantly degrades wind turbine aerodynamic
performance and structural integrity. One of the major factors that lower the energy production due to aerodynamic losses
is the erosion of the leading edges [1] which is mainly caused by the precipitation [2, 3]. It was shown in [4] that relatively
small eroded surface features, like pits of about 0.3 mm deep and 2 mm wide if grouped (e.g. about 400 pits over a 2.5 m
span) can decrease the aerodynamic performance and the power generation by around 3%. This motivates the operating
companies to be reliably monitor the leading edge erosion state.
A variety of non-destructive inspection techniques exist to inspect the wind turbine blades [5]. However, most of these
techniques provide internal damage detection (e.g. delaminations) and not the erosion of the leading edge which is
categorized as external surface damage [4, 6]. Nowadays the leading edge erosion is mostly monitored visually, either
directly or with drone-based camera systems. However, only significant defects and damage cases (considerably larger
than the indicated pits) can be reliably detected based on the visual [7] and hyperspectral imaging [8], even if supported
by the recent advancements in artificial intelligence [9, 10].
Leading edge erosion as an external surface damage can be directly identified if the current blade shape is reliably measured
and compared with either the initial measured shape, results from a previous inspection, an analytical shape or a smooth
fitted surface. Similar tasks of the blade shape measurement are efficiently implemented during blades production with
laser line scanners [11-13] and stereo digital image correlation [14]. Further, optical inspection techniques including fringe

*a.g.anisimov@tudelft.nl; phone +31 15 27 83099; http://www.aerondt.tudelft.nl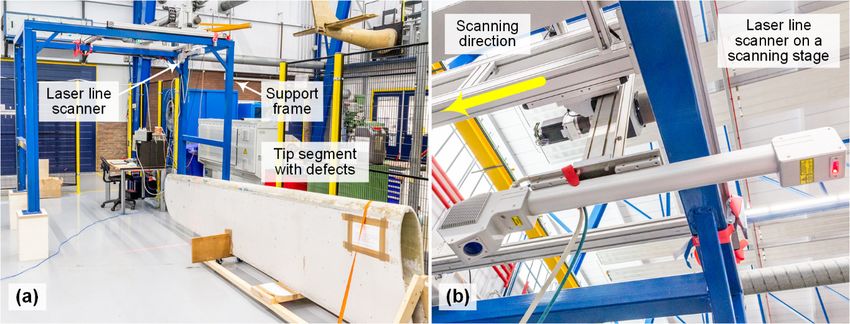
projection and stereovision can be grouped on mobile driving platforms [15, 16] to enable the full-scale scanning of the
blades. All these techniques provide a sub-millimetre resolution which is sufficient for the production quality inspection
and potentially to identify the small erosion pits. However, the overall weight, dimensions and power consumption of these
solutions do not allow them to be used them in the field, especially for offshore inspection which is primarily based on
drones.
Up to now, two solutions for quantitative shape reconstruction with drones or with instruments that are highly adapted for
that have been published. The first one uses drone-based photogrammetry [17, 18] which achieves a standard deviation for
the shape reconstruction of about 1.3 mm with working distance 0.8 m. However, the measuring results strongly depend
on the illumination conditions and camera settings. Also, achieving a sensor-blade working distance of 0.8 m in operational
conditions is challenging. The second solution uses the structure-from-motion approach where the shape of the leading
edge is reconstructed from multiple view observations [19]. Features in the millimetre range were identified within a
relatively small field of view at the clearance distance of 2 m.
In this project, a customized long-range laser line scanner is used to measure the profiles of the blades to quantitative
characterize the erosion and other damage cases (Figure 1 (a-d)). This sensor choice was made based on a detailed
comparison of the optical shape measurement techniques and their applicability to drone-based inspection [6]. The laser
line scanner is a rational compromise when the drone-related issues are taken into account (e.g. vibrations, mass and power
budgets) together with the real outdoor and offshore conditions (e.g. sunlight, salt-forming on blades). During
measurements (Figure 1 (e)), a drone will carry the laser line scanner over the leading edge of the blade. The blade will be
oriented with the leading edge up to arrange a reasonable clearance distance of 1.5-2 m which was identified as a safe
clearance between the drone and the blade. This distance range is predicted to be safe for a large drone even in case of a
wind gust or a subsystem failure.
(a)
(b)
(c)
(e)
(d)
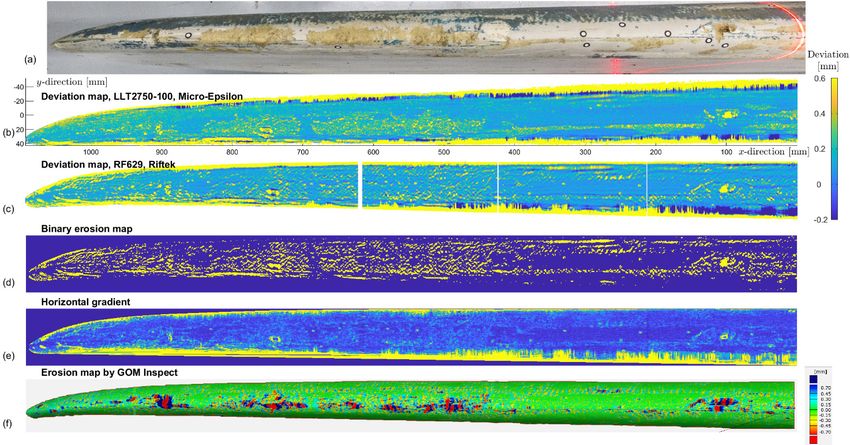
Figure 1. Real-life damage cases of a wind turbine leading edge, including (a) erosion, (b) loss of coating, (c) severe erosion,
(d) probable impact or lightning damage. (e) presents the proposing drone-based measurement approach with the laser line scanner.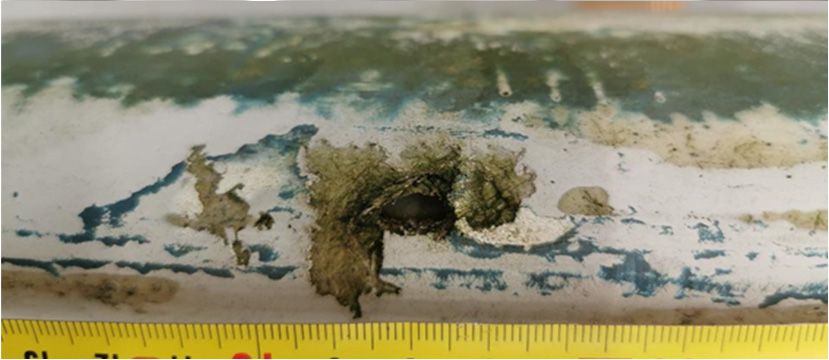
Current results, presented in this paper, include detection of eroded and damaged areas with a sub-millimetre resolution in
the laboratory conditions on a real out-of-service blade with the sensor positioned and moved with a scanning frame.
Further in the project, a custom-developed heavy drone will be used to carry the sensor to scan the blades offshore. This
development is done within the smart maintenance innovation project AIRTuB: Automatic Inspection and Repair of
Turbine Blades where the inspection expertise is combined with drone developers, wind-turbine manufacturers, repair and
maintenance services.
2 LABORATORY SETUP FOR THE BLADE INSPECTION
A laboratory setup was developed to test the proposed measurement approach (Figure 2). A support and a scanning frames
were used together to position and move the laser line scanner over a leading edge of a blade. The available 5 m tip segment
of a real out-of-service blade (NedWind 40/500, originally 20 m, 22 years service life) with various surface defects was
scanned and analysed.
Figure 2. The developed laboratory setup for the blade inspection, including
(a) the support frame above the tip segment of a blade and (b) the custom long-range laser line scanner.
A market search showed a limited choice of long-range laser line scanners capable to work at distances from 1.5 to 2 m.
Therefore, a customized long-range laser line scanner RF629 was developed by Riftek, Belarus with a measuring range of
490 mm (width) at 1310 mm (distance from the sensor) and 680 mm at 1900 mm. The extended measuring range resulted
in an elongated sensor design with an overall length of 680 mm. The sensor has 1280 points (pixels) across the horizontal
measuring range operating at 2 kHz which is sufficient to form a uniform dense point cloud at the flight (scanning) speed
around 0.5-1 m/s. The total sensor error of the distance measurement at the midrange of 1600 mm does not exceed 0.65 mm
(3 standard deviations), the sensitivity is at round 0.1 mm. This combination of the sensor mass, dimensions and resolution
is considered as a rational choice for this specific task.
To have a reliable representation of the sub-millimetre erosion features an additional reference laser line scanner LLT2750-
100 by Micro-Epsilon, Germany was used to measure the surface shape at a closer distance of 0.5 m. The main limitation
of this sensor is the measuring range at a distance of 300-600 mm, which is not realistic from the safety side of the drone-
based inspection (Figure 1 (e)).
The erosion and defect detection approach used in this paper is based on deterministic analysis of the individual profiles:
eliminating outliers from the point cloud;
fitting a smooth curve into the filtered profile using local regression and identification of the local profile
variation;
binary thresholding deviations of 0.2 mm in depth to keep the desired erosion pits of 0.3 mm, followed by image
dilation and removal of deviations by the edges of the blade, where the curvature gets significant.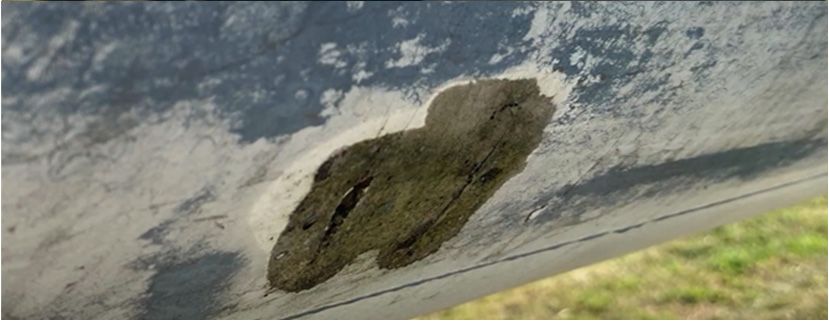
This deterministic approach is potentially not sensitive to drone vibrations as the individual profiles imaged with an
exposure time of 2 to 5 µs are expected to be not affected by the drone vibrations.

        3     EXPERIMENTAL RESULTS OF THE LEADING EDGE EROSION INSPECTION
The tip segment of the blade that was used for this project has multiple defects, including severe damage in areas 1 and 4
(Figure 3 (a), also shown in Figure 1 (c,d)), a moderate erosion in area 2 and a healthy reference area 3. The shape of this
tip segment was measured with two laser line scanners, the results for the first 1.1 m part of the blade are presented and
analysed in this paper.
First, the reference deviation map was processed from the shape data obtained with the LLT2750-100 scanner by Micro-
Epsilon (Figure 3 (b)). All areas of interest 1-4 can be reliably identified in the deviation map and further processed. The
overall height range where the features are reliably seen is about 0.8 mm.
Second, the deviation map with the RF629 scanner by Riftek (Figure 3 (c)) was obtained. The severe damage areas 1 and
4 are also reliably identified, however, the boundaries of the moderate erosion area 2 are less clear. This directly affects
the clarity of the binary defect map (Figure 3 (d)) with the global threshold of the height deviation set to 0.2 mm.
The healthy area 3 is clearly seen in the deviation maps from both sensors (Figure 3 (b-c)), also in the binary map (Figure
3 (d)). This fact defines an alternative approach to detect erosion: tracking of the healthy areas first and further evaluation
of the deviating areas.

                                                                                   3
                  1         2                                                                               4

    Figure 3. Overview of the experimental results (a) with the tip section of the blade, (b) the deviation map based on the shape
    measured with the LLT2750-100 scanner by Micro-Epsilon, (c) the deviation map based on the shape measured with the
    RF629 scanner by Riftek. The deviation map (c) was further processed to give (d) the binary erosion map and (e) the
    horizontal map gradient, and (f) the surface defect map based on the shape measured with the RF629 scanner processed by
    the GOM Inspect software.
The severe damage areas 1 and 4 scatter back a limited amount of the laser light and cause issues with the defect contouring.
The image derivative in the horizontal direction (Figure 3 (e)) was identified to provide reliable contouring in addition to
the binary map (Figure 3 (d)).
To benchmark the developed deterministic approach of individual profile processing, the pointcloud acquired with the
RF629 sensor by Riftek was processed with GOM Inspect software to estimate the surface defect map (Figure 3 (f)) by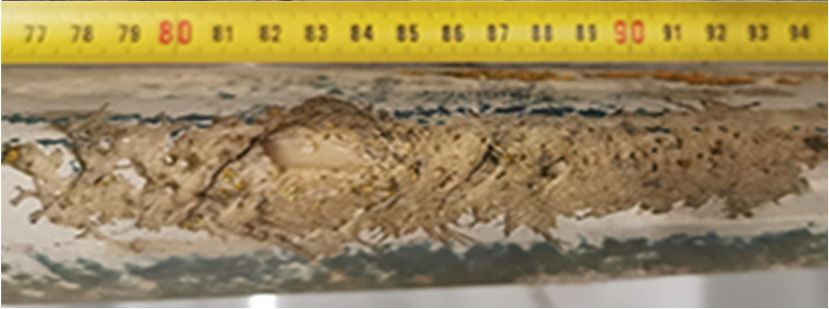
fitting a 3D smooth surface into the pointcloud and calculating the deviation, which is a proprietary algorithm. The
calculated erosion map shows a clear identification of the areas 1 and 4, also the area 2 with moderate erosion.
Comparison of the individual profile processing (Figure 3 (c-e)) and the full 3D fitting (Figure 3 (f)) shows that the 3D
fitting is more reliable in the upper and lower sides of the blade where the surface curvature is significant. Processing of
the individual lines shows reliable deviation maps close to the center of the leading edge, while at the top and bottom sides
(Figure 3 (c-e)) the individual fitting is less reliable.

                                                 4     CONCLUSIONS
Quantitative characterisation of the leading edge erosion of wind turbine blades, especially in an open environment and
especially offshore, is a challenging task that has not been fully addressed yet. The requirements can be formulated as a
blade surface shape measurement at a distance of 1.5 to 2 m with a sub-millimetre resolution (towards 0.1 mm) from a
drone. The first literature results [17-19] use drone-based photogrammetry and the structure-from-motion approaches. In
this paper, we have presented an alternative solution based on a long-range custom made laser line scanner. The processed
local deviation maps (Figure 3 (c-f)) provide reliable identification of the areas with severe damage and with the healthy
coating. The first experimental results with the areas with moderate erosion and minor erosion pits show that the erosion
areas can be identified, however further processing (including decreasing false positives, joining of the scattered erosion
parts into erosion clusters) can improve the inspection outcomes. Later the developed deterministic approach will be
benchmarked with machine learning capabilities.
We expect a quantitative inspection of the current erosion state and long term degradation monitoring to provide crucial
information for wind farm maintenance. The inspection results may coordinate the recoating program for a specific blade.
In addition, the transfer from the current corrective (reactive) blade maintenance to the condition-based and predictive
maintenance [20] also depends on reliable inspection.
Future steps in the AIRTuB project include integration of the laser line sensor in the drone, hangar flight tests and a series
of offshore inspections.

                                              ACKNOWLEDGEMENTS

The AIRTuB project (Automatic Inspection and Repair of Turbine Blades) is being carried out with a Top Sector Energy
subsidy from the Ministry of Economic Affairs of the Netherlands.

                                                     REFERENCES

[1] Gaudern, N. "A practical study of the aerodynamical impact of wind turbine blade leading edge erosion," Journal of
Physics: Conference Series; 524: 012031 (2014)
[2] Verma, A. S., Castro, S. G., Jiang, Z., Hu, W., Teuwen, J. J. "Leading edge erosion of wind turbine blades: Effects
of blade surface curvature on rain droplet impingement kinematics," In Journal of Physics: Conference Series. Vol. 1618,
No. 5, p. 052003 (2020)
[3] Verma, A. S., Jiang, Z., Ren, Z., Hu, W., Teuwen, J. J. "Effects of onshore and offshore environmental parameters
on the leading edge erosion of wind turbine blades: A comparative study," Journal of Offshore Mechanics and Arctic
Engineering, 143(4), 042001 (2021)
[4] Nijssen, R., Manrique, E. "Literature review of structural and non-structural wind turbine blade damage," TNO report
R10402 (2020)
[5] Du, Y., Zhou, S., Jing, X., Peng, Y., Wu, H., Kwok, N. "Damage detection techniques for wind turbine blades: A
review," Mechanical Systems and Signal Processing, 141, 106445 (2020)
[6] Hwang, J.S., Platenkamp, D.J., Beukema, R.P. "A literature survey on remote inspection of offshore wind turbine
blades: Automated Inspection and Repair of Turbine Blades (AIRTuB) - WP1," Netherlands Aerospace Centre NLR
http://hdl.handle.net/10921/1559 (2021)
[7] Stetco, A., Dinmohammadi, F., Zhao, X., Robu, V., Flynn, D., Barnes, M., Nenadic, G. "Machine learning methods
for wind turbine condition monitoring: A review," Renewable energy, 133, 620-635 (2019)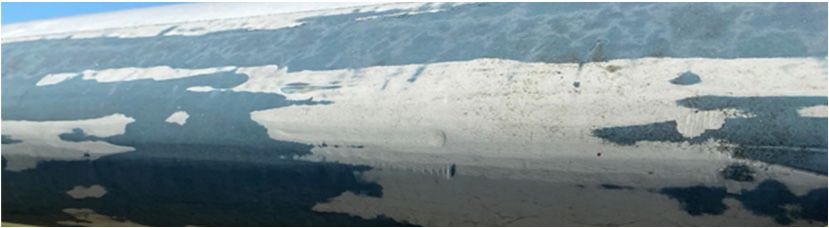
[8] Rizk, P., Al Saleh, N., Younes, R., Ilinca, A., Khoder, J. "Hyperspectral imaging applied for the detection of wind
turbine blade damage and icing," Remote Sensing Applications: Society and Environment, 18, 100291 (2020)
[9] Shihavuddin, A. S. M., Chen, X., Fedorov, V., Christensen, A. N., Brogaard Riis, N. A., Branner, K., Paulsen, R.
"Wind turbine surface damage detection by deep learning aided drone inspection analysis," Energies, 12(4), 676 (2019)
[10] Reddy, A., Indragandhi, V., Ravi, L., Subramaniyaswamy, V. "Detection of cracks and damage in wind turbine blades
using artificial intelligence-based image analytics," Measurement, 147, 106823 (2019)
[11] Lyngby, R. A., Nielsen, E., De Chiffre, L., Aanæs, H., Dahl, A. B. "Development and metrological validation of a
new automated scanner system for freeform measurements on wind turbine blades in the production," Precision
Engineering, 56, 255-266 (2019)
[12] Fu, H. L., Fan, K. C., Huang, Y. J., Hu, M. K. "Innovative optical scanning technique and device for three-
dimensional full-scale measurement of wind-turbine blades," Optical Engineering, 53(12), 122411 (2014)
[13] Talbot, J., Wang, Q., Brady, N., Holden, R. "Offshore wind turbine blades measurement using coherent laser radar,"
Measurement, 79, 53-65 (2016)
[14] Poozesh, P., Sabato, A., Sarrafi, A., Niezrecki, C., Avitabile, P., Yarala, R. "Multicamera measurement system to
evaluate the dynamic response of utility‐scale wind turbine blades," Wind Energy, 23(7), 1619-1639 (2020)
[15] Wang, J., Tao, B., Gong, Z., Yu, S., Yin, Z. "A mobile robotic measurement system for large-scale complex
components based on optical scanning and visual tracking," Robotics and Computer-Integrated Manufacturing, 67, 102010
(2021)
[16] Lyngby, R. A., Aanæs, H., Nielsen, E., Dahl, A. B. "Autonomous surface inspection of wind turbine blades for quality
assurance in production," In EWSHM-9th European Workshop on Structural Health Monitoring, BINDT, Vol. 680 (2018)
[17] Zhang, D., Burnham, K., Mcdonald, L., Macleod, C., Dobie, G., Summan, R., Pierce, G. "Remote inspection of wind
turbine blades using UAV with photogrammetry payload," In 56th Annual British Conference of Non-Destructive Testing-
NDT 2017 (2017)
[18] Zhang, D., Watson, R., Dobie, G., MacLeod, C., Khan, A., Pierce, G. "Quantifying impacts on remote
photogrammetric inspection using unmanned aerial vehicles," Engineering Structures, 209, 109940 (2020)
[19] Nielsen, M. S., Nikolov, I., Kruse, E. K., Garnæs, J., Madsen, C. B. "High-resolution structure-from-motion for
quantitative measurement of leading-edge roughness," Energies, 13(15), 3916 (2020)
[20] Ren, Z., Verma, A. S., Li, Y., Teuwen, J. J., Jiang, Z. "Offshore wind turbine operations and maintenance: A state-
of-the-art review," Renewable and Sustainable Energy Reviews, 144, 110886 (2021)
You can also read