Modeling Population Growth: Having Kittens
←
→
Page content transcription
If your browser does not render page correctly, please read the page content below
PROBLEM SOLVING

              Mathematics Assessment Project
              CLASSROOM CHALLENGES
              A Formative Assessment Lesson

              Modeling Population
              Growth:
              Having Kittens

                  Mathematics Assessment Resource Service
                  University of Nottingham & UC Berkeley

                  For more details, visit: http://map.mathshell.org
                  © 2015 MARS, Shell Center, University of Nottingham
                  May be reproduced, unmodified, for non-commercial purposes under the Creative Commons license
                  detailed at http://creativecommons.org/licenses/by-nc-nd/3.0/ - all other rights reserved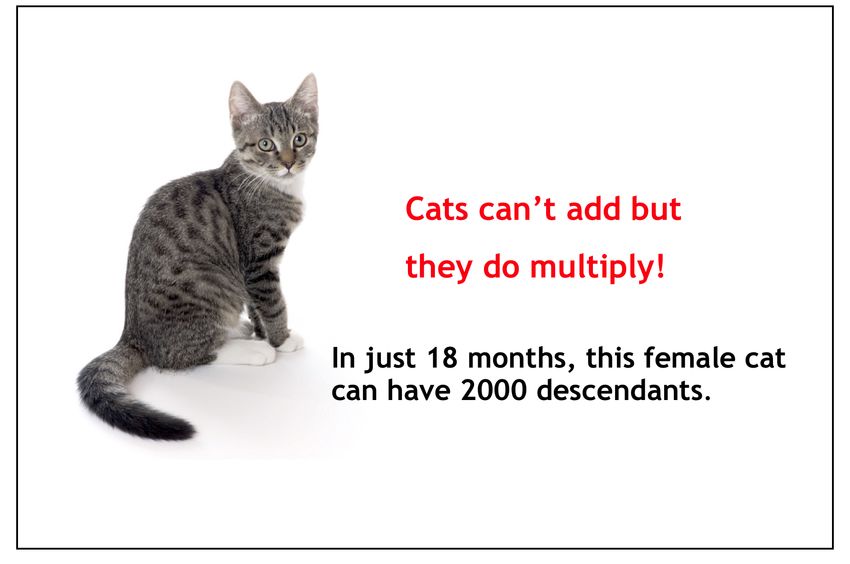
Modeling Population Growth: Having Kittens
 MATHEMATICAL GOALS
 This lesson unit is intended to help you assess how well students are able to:
     • Interpret a situation and represent the constraints and variables mathematically.
     • Select appropriate mathematical methods to use.
     • Make sensible estimates and assumptions.
     • Investigate an exponentially increasing sequence.
     • Communicate their reasoning clearly.

 COMMON CORE STATE STANDARDS
      This lesson relates to all the Standards for Mathematical Practices in the Common Core State
      Standards for Mathematics, with a particular emphasis on Practices 1, 2, 3, 4, 5, 6, and 7:
          1.      Make sense of problems and persevere in solving them.
          2.      Reason abstractly and quantitatively.
          3.      Construct viable arguments and critique the reasoning of others.
          4.      Model with mathematics.
          5.      Use appropriate tools strategically.
          6.      Attend to precision.
          7.      Look for and make use of structure.
          8.      Look for and express regularity in repeated reasoning.
      This lesson gives students the opportunity to apply their knowledge of the following Standards for
      Mathematical Content in the Common Core State Standards for Mathematics:
          N-Q: Reason quantitatively and use units to solve problems.
          F-LE: Construct and compare linear, quadratic, and exponential models and solve problems.

 INTRODUCTION
      This lesson is designed to help students develop strategies for modeling. Note that a video of this
      lesson is available in the professional development materials.
      •    Before the lesson, students attempt the problem individually. You then review their work and
           write questions to help students improve their solutions.
      •    At the start of the lesson, students work individually answering your questions. Then, in small
           groups, students work collaboratively on the task before evaluating some sample solutions. In a
           whole-class discussion, students explain and compare the alternative solution strategies they
           have seen and used.
      •    In a follow-up lesson, students review what they have learned.

 MATERIALS REQUIRED
      •    Each individual student will need a calculator, a copy of the Having Kittens task and the How
           Did You Work? questionnaire, a mini-whiteboard, pen, and eraser.
      •    Each small group will need the Sample Responses to Discuss, a large sheet of poster paper, and a
           felt-tipped pen. Graph paper should be kept in reserve and used only when requested.
      •    There is a projector resource to help you with whole-class discussions. Spreadsheet software
           might also be helpful if available.

 TIME NEEDED
      20 minutes before the lesson, a 100-minute lesson (or two 55-minute lessons), and 15 minutes in a
      follow-up lesson. Timings are approximate. Exact timings will depend on the needs of your class.
Teacher guide                          Modeling Population Growth: Having Kittens                            T-1
BEFORE THE LESSON

 Assessment task: Having Kittens (20 minutes)
                                                               Having Kittens                               Student Materials               Alpha Version
    Ask students to do this task in class or for
                                                                                                      Having Kittens
    homework a day or more before the formative                Here is a poster published by an organization that looks after stray cats.

    assessment lesson. This will give you an
    opportunity to assess the work and to find out
    the kinds of difficulties students have with it.
    You should then be able to target your help                                                             Cats can’t add but
    more effectively in the subsequent lesson.                                                              they do multiply!

      Give out the Having Kittens task:
                                                                                                      In just 18 months, this female cat
                                                                                                         can have 2000 descendants.
          This is a poster made by a cat charity,
          encouraging people to have their cats
          spayed so they can’t have kittens.
          The activity is about what happens if you            Work out whether this number of descendants is realistic.

          don’t have your cat spayed. Your task is to          Here are some facts that you will need:
                                                                                 Make sure your cat cannot have kittens.
          decide whether the statement on the poster
          is correct.
          Is it realistic that one female cat would
          produce 2000 descendants in 18 months?
          You are given some facts about cats and
          kittens that will help you decide.
      It is important that, as far as possible, students
                                                               © 2011 MARS University of Nottingham        S-1
      are allowed to answer the questions without assistance.
      Students who sit together often produce similar answers and then when they come to compare their
      work, they have little to discuss. For this reason, we suggest that when students do the task
      individually, you ask them to move to different seats. Then at the beginning of the formative
      assessment lesson, allow them to return to their usual seats. Experience has shown that this produces
      more profitable discussions.

 Assessing students’ responses
    Collect students’ responses to the task. Make some notes on what their work reveals about their
    current levels of understanding and their different problem solving approaches. The purpose of doing
    this is to forewarn you of issues that will arise during the lesson itself, so that you may prepare
    carefully.
      We suggest that you do not score students’ work. The research shows that this will be
      counterproductive, as it will encourage students to compare their scores and will distract their
      attention from what they can do to improve their mathematics.
      Instead, help students to make further progress by summarizing their difficulties as a series of
      questions. Some suggestions for these are given in the Common issues table on page T-4. These have
      been drawn from common difficulties observed in trials of this lesson unit.
      We suggest you make a list of your own questions, based on your students’ work. We recommend
      you either:
      •   write one or two questions on each student’s work, or

Teacher guide                          Modeling Population Growth: Having Kittens                                                                   T-2
•    give each student a printed version of your list of questions and highlight the questions for each
           individual student.
      If you do not have time to do this, you could select a few questions that will be of help to the majority
      of students and write these on the board when you return the work to the students at the beginning of
      the lesson. You may also want to note students with a particular difficulty, so that you can ask them
      about that issue in the formative lesson.

Teacher guide                          Modeling Population Growth: Having Kittens                             T-3
Common issues:                                              Suggested questions and prompts:

   Has difficulty getting started                              • What do you know? What do you need to
                                                                 find out?
                                                               • Can you describe in words what happens
                                                                 during the first five months?

   Does not develop a suitable representation for              • Can you produce a diagram or table to show
   the problem                                                   what is happening?
                                                               • Can you show time elapsing on your
                                                                 diagram?
                                                               • How can you show which kittens are
                                                                 descended from which?
                                                               • How can you show the numbers of kittens at
                                                                 each month?

   Produces work that is unsystematic                          • Can you think of a way of breaking the task
                                                                 into manageable chunks?
                                                               • Could you start by just looking at the litters
                                                                 from the first cat? What could you do after
                                                                 that?
                                                               • Can you now look systematically at what
                                                                 happens to her kittens? And their kittens?

   Develops a partial model                                    • Do you think the first litter of kittens will
                                                                 have time to grow and have litters of their
   For example: The student only considers litters
   from the original cat.                                        own? Then what about their kittens?
                                                               • Do you think the first cat will have more than
   Or: The student only considers the first litter at            one litter? What about her kittens?
   each generation.
   Does not make assumptions explicit                          • What have you assumed here?
   For example: The student does not state their
   assumption that all litters occur in the first six
   months of the year.
   Or: The student does not state that they are
   assuming all the kittens are female.
   Makes unreasonable assumptions                              • Is your assumption that [all these kittens are
                                                                 born at the beginning of the year] reasonable?
   For example: The student decides that all the
   kittens born in a year are born at the beginning
   of that year.
   Makes a successful attempt                                  • Do you think your work gives the maximum
                                                                 possible number of kittens? How can you be
                                                                 sure?
                                                               • Can you find a different way of presenting
                                                                 your analysis? Which way is clearest?
                                                               • Do you think your answer is an overestimate
                                                                 or underestimate? Why? Can you suggest
                                                                 reasonable bounds for your estimate?

Teacher guide                            Modeling Population Growth: Having Kittens                               T-4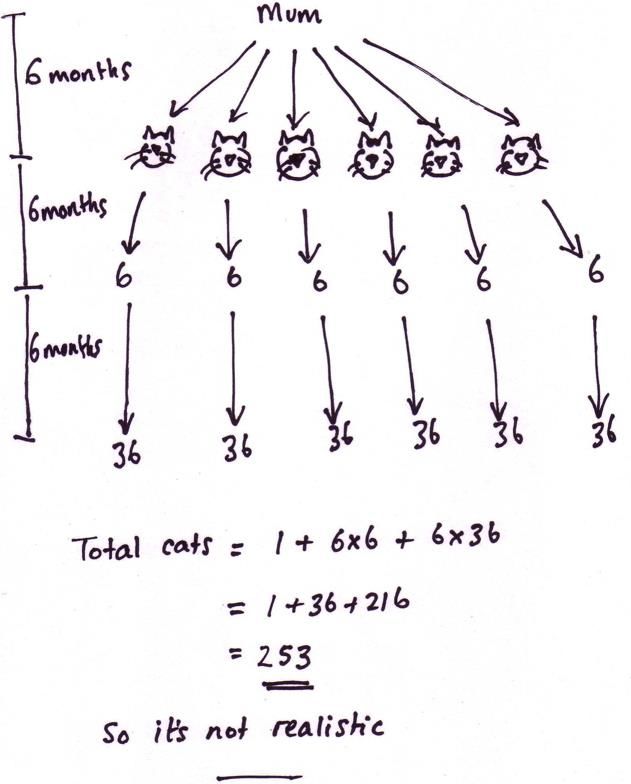
SUGGESTED LESSON OUTLINE

 Individual review (10 minutes)
    Give each student a mini-whiteboard, pen, and eraser. Begin the lesson by briefly reintroducing the
    problem:
          Do you remember the problem I asked you to do last time? Today you are going to work together
          to improve your initial attempts.
          First, though, I would like you to work individually again. I have looked at your work and I have
          some questions on it. Read through the questions I have written about your work.
          Use your mini-whiteboard to note answers to these questions.
      It is helpful to ask students to write their ideas on a mini-whiteboard, as you will be able to monitor
      their work more easily. This will also help students to share their ideas easily later in the lesson.

 Collaborative activity: producing a joint solution (20 minutes)
    The time given for this activity is an approximate guide. You may find your class would benefit from
    spending more (or less) time on this activity.
      Organize the class into groups of two or three students and give each group a large sheet of paper and
      a felt-tipped pen. Ask students to try the task again, this time combining their ideas.
          I want you to work in groups now.
          Your task is to produce a solution that is better than your individual solutions.
          Take turns to explain how you did the task and how you now think it could be improved. Then, put
          your individual work aside and try to produce a joint solution to the problem.
      While students work in small groups you have two tasks: to note different student approaches to the
      task and to support student problem solving.
      Note different student approaches to the task
      Listen and watch students carefully. In particular, notice any difficulties that students encounter with
      what they are doing and the ways they justify and explain to each other. Some students may take a
      diagrammatic or graphical approach, while others may take a more numerical one. A few students
      may develop an algebraic approach. Notice also if students monitor their own progress. If there is
      lack of progress, are they prepared to improve or change strategy? What assumptions do students
      make? Are they aware of these assumptions and the effect they have on their solution?
      Support student problem solving
      If a student struggles to get started, encourage them to ask a specific question about the task.
      Articulating the problem in this way can sometimes offer a direction to pursue that was previously
      overlooked. However, if the student needs their question answered, ask another member of the group
      for a response.
          What is known and what is unknown?
          What are you asked to find out?
          What kind of representation will help you tackle this problem?
      Try not to make suggestions that move students towards a particular approach to this task. Instead,
      ask questions that help students to clarify their thinking and encourage checking:
          Can you set out your work using a table or diagram? What would be a good way?

Teacher guide                          Modeling Population Growth: Having Kittens                                T-5
How many cats/kittens will there be after 6 months? 12 months? … ?
          What assumptions have you made?
          How can you check your solution?
          Do you think there is just one solution?
      You may also want to use the questions in the Common issues table.
      If the whole-class is struggling on the same issue, write relevant questions on the board. You could
      also ask students who performed well on the assessment to help struggling students. If, after several
      minutes, students are having difficulty making any progress at all you could hand out one of the
      Sample Responses to Discuss to get them started.
      Ask each group of students you visit to review their progress.
          What is your strategy for solving this problem?
          What do you know now that you did not know before?
          Are you going to continue with this strategy?
          Are there any other approaches you could try?
      The purpose of these questions is to help students learn to track and review their problem solving
      strategies. It is important you ask these review questions of students who are and are not following
      what you know to be productive approaches, whether or not they are stuck. Otherwise, students will
      learn that your questions are really a prompt to switch strategy!

 Sharing posters (15 minutes)
    After students have had sufficient time to attempt the problem, ask one student from each group to
    visit another group’s poster.
          If you are visiting another group, read through their work. If their work makes sense, explain it in
          your own words. If the work does not make sense to you, ask for clarification.
          If you are staying at your desk, either carefully listen to the explanation and check it matches
          your own thinking or answer the visiting students’ questions.
          You may then want to consider improving your poster.

 Sharing different approaches (10 minutes)
    If you think students have produced a variety of representations of the task and/or made a range of
    assumptions, you may now want to hold a whole-class discussion. If you have noticed some
    interesting ways of working or some incorrect solutions, you may want to focus the discussion on
    these. Equally, if you have noticed different groups using similar strategies but making different
    assumptions you may want to compare answers.
      Ask other students to comment on:
      •   Did they choose a good method for representing the situation?
      •   Did they make sensible assumptions?
      •   Is the reasoning correct? Are the calculations accurate?
      •   Are the conclusions sensible?
      •   Was the reasoning easy to understand and follow?

Teacher guide                          Modeling Population Growth: Having Kittens                             T-6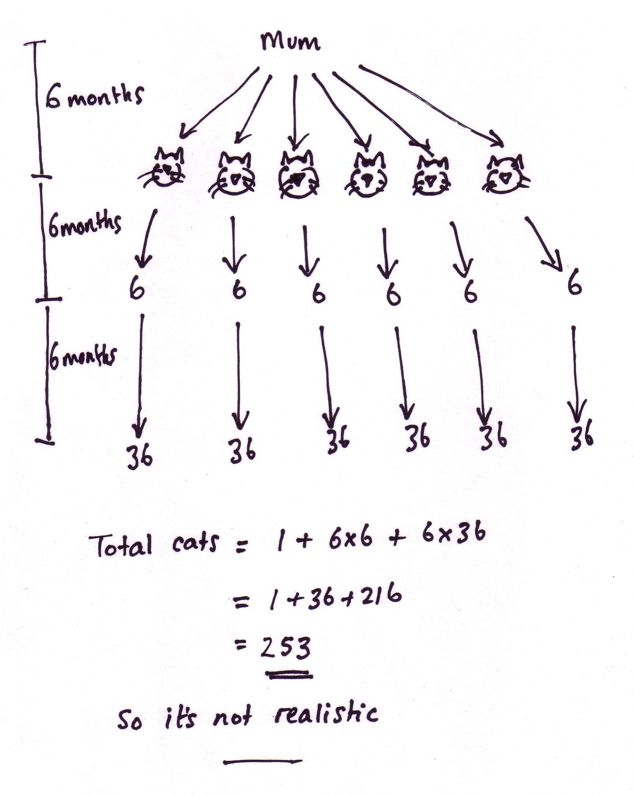
Extending the lesson over two days
      If you are taking two days to complete the lesson unit then you may want to end the first lesson here.
      At the start of the second day, allow students time to familiarize themselves with their posters before
      moving on to the collaborative analysis of sample responses.

 Collaborative analysis of Sample Responses to Discuss (25 minutes)
    Give each group a copy of the three Sample Responses to Discuss and ask for written comments. This
    gives students the opportunity to see further representations and discuss the assumptions made in each
    case.
          Imagine you are the teacher and have to assess this work.
          What has each student done correctly?
          What assumptions have they made?
          How can their work be improved?
      These questions are summarized on Slide P-2 of the projector resource.
      You may decide there is not enough time for each group to work through all three pieces of work. In
      that case, be selective about which you hand out. For example, groups that have forgotten that a cat
      may have more than one litter could be given Alice’s work, while groups that have forgotten that the
      kittens from each litter can go on to have their own litters could be given Wayne’s work.

 Whole-class discussion: comparing different approaches (20 minutes)
   Organize a discussion about what has been learned. Discuss some of the different approaches used in
   the sample work and ask students to comment on their strengths and weaknesses.
          Which approach did you like best? Why?
          Which approach did you find most difficult to understand?
      Encourage students to consider the relative merits of the different approaches, justifying their choice
      for the approach they liked best/found most difficult to understand.
          In what way do you think this solution is better/worse than this one? Why?
      You may also want to compare students’ own work with the sample student work.
          Did any group use a similar method to Alice, Wayne or Ben?
          What was same about the work?
          What was different about the work?
      You may want to use Slides P-3, 4, and 5 of the projector resource and the questions in the Common
      issues table to support the discussion.

      Alice chose to represent the task using a
      timeline. She has only considered the number of
      kittens from the original cat. She has used some
      of the given information correctly and has
      assumed that 6 cats are born at regular intervals.
      She has forgotten that these kittens can also have
      litters of their own. She has not described her
      reasoning and assumptions.

Teacher guide                          Modeling Population Growth: Having Kittens                               T-7
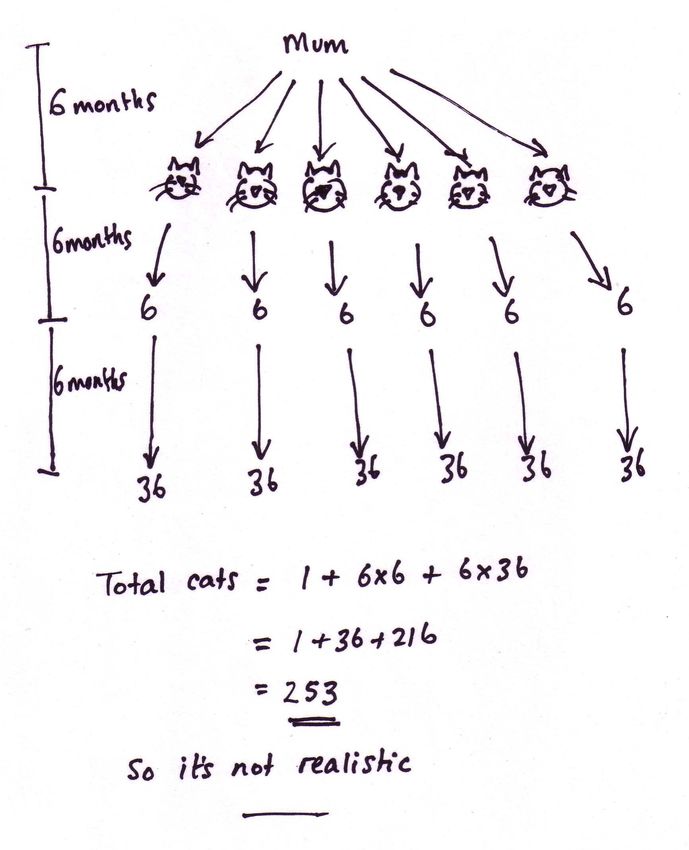
Wayne has assumed that the mother has six
      kittens after 6 months and has considered
      succeeding generations. He has, however,
      forgotten that each cat may have more than one
      litter. He has shown the timeline clearly. Wayne
      doesn’t explain where the 6-month gaps have
      come from.

      Ben has decided to draw a ‘cat tree’ and has tried
      to control for time (with some errors). The value
      9846 is not explained and does not follow from
      the reasoning since, again, only the kittens from
      the original cat are considered. The number of
      kittens per litter is made explicit. Ben has
      included more explanation than Alice and
      Wayne.

 Follow-up lesson: individual reflection (15 minutes)
    Display Slide P-6 of the projector resource:

                                                            Reviewing Work
                                • I have selected the important facts and used them to
                                  solve the problem.

                                • I am aware of the assumptions I have made and the
                                  effect these assumptions have on the result.

                                • I have used more than one method.

                                • I have checked whether my results make sense and
                                  improved my method if need be.

                                • I have presented my results in a way that will make
                                  sense to others.
                              Projector Resources                  Modeling: Having Kittens      P-6

      Explain to students that they are going to review their work and think about some of the choices they
      have made when completing the task.
      Give each student a copy of the How Did You Work? questionnaire.
          Think carefully about your work on this task. On your own, answer the review questions as
          carefully as you can.
      Some teachers give this as a homework task.
Teacher guide                                       Modeling Population Growth: Having Kittens                T-8
SOLUTIONS
      There are many possible solutions to this problem, depending on the assumptions made.
      In a good solution, the student will make assumptions explicit and the chosen method of
      representation will involve a timeline and record the original cat and all her descendants. The
      exponential growth will be evident, with both the successive litters from each cat and successive
      generations considered.
      The diagrams below are similar attempts to represent the number of kittens born in each month over
      an 18-month period.
      These are the assumptions made for the first diagram:
      •    The first cat is already adult and gives birth in month 0.
      •    Cats become pregnant as soon as possible (at the age of 4 months).
      •    Litters are spread as evenly as possible across the year (so there is a litter every 4 months).
      •    Each litter contains six kittens.
      •    All of these kittens are female and have offspring of their own.
      •    None of the offspring die.
      For the second diagram, it is still assumed that:
      •   Cats become pregnant as soon as possible (at the age of 4 months).
      •   Litters are spread as evenly as possible across the year (so there is a litter every 4 months).
      •   All of the kittens are female and have offspring of their own.
      • None of the offspring die.
      However, it is now assumed that:
      •    The first cat gets pregnant in month 0 and so gives birth in month 2.
      •    Each litter contains just three (female) kittens.

      There are thus two major differences in the assumptions made:
      •    In the first diagram, the cat is assumed to give birth in month 0 (the first pregnancy is not
           counted as part of the 18-month period). In the second diagram, the cat is assumed to get
           pregnant in month 0, so she gives birth in month 2.
      •    In the first diagram, the cat is assumed to have six kittens in a litter. In the second, she has only
           three kittens per litter.

Teacher guide                           Modeling Population Growth: Having Kittens                                 T-9
Generation of kittens
0 1 2 2 2 2 3 3 3 4 Cum.total
0 1 6 7
1 7
2 7
3 7
4 6 13
Diagram 1 5 13
6 36 49
7 49
8 6 55
Time in months
9 55
10 36 36 127
11 127
12 6 216 349
13 349
14 36 36 36 457
15 457
16 6 216 216 216 1111
17 1111
18 36 36 36 36 1296 2551
Generation of kittens
0 1 2 2 2 3 3 Cum. total
0 1 1
1 1
2 3 4
Diagram 2 3 4
4 4
5 4
6 3 7
7 7
Time in months
8 9 16
9 16
10 3 19
11 19
12 9 9 37
13 37
14 3 27 67
15 67
16 9 9 9 94
17 94
18 3 27 27 151
The number of descendants of the cat is much greater in the first diagram than in the second.
Changing the set of assumptions has a significant effect on the outcome.
In both of the diagrams all the kittens are assumed to be female. It might be more reasonable to
assume that about one-half of each litter is male, but counting of descendants then becomes
problematic. How would we count the descendants of male cats? Each male kitten might perhaps
make many females pregnant in a short time, so that many more descendants of the first cat could
result.
The statement made by the vet appears to be reasonable and might even be a conservative estimate,
given the problem of descendants from male kittens.
Teacher guide Modeling Population Growth: Having Kittens T-10Having Kittens
Here is a poster published by an organization that looks after stray cats.
Cats can’t add but
they do multiply!
In just 18 months, this female cat can
have 2000 descendants.
Figure out whether this number of descendants is realistic.
Here are some facts that you will need:
Student materials Modeling Population Growth: Having Kittens S-1
© 2015 MARS, Shell Center, University of NottinghamSample Responses to Discuss: Alice
What has Alice done correctly?
What assumptions has she made?
How could this solution be improved?
Student materials Modeling Population Growth: Having Kittens S-2
© 2015 MARS, Shell Center, University of NottinghamSample Responses to Discuss: Wayne
What has Wayne done correctly?
What assumptions has he made?
How can Wayne’s work be improved?
Student materials Modeling Population Growth: Having Kittens S-3
© 2015 MARS, Shell Center, University of NottinghamSample Responses to Discuss: Ben
What has Ben done correctly?
What assumptions has he made?
How can Ben’s work be improved?
Student materials Modeling Population Growth: Having Kittens S-4
© 2015 MARS, Shell Center, University of NottinghamHow Did You Work?
Check (√) the boxes and complete the sentences that apply to your work.
1. Check (√) the facts you used:
2. I / We checked our work
I / We checked our work by
3. We made some assumptions
These assumptions were
4. Another group has analyzed my poster
They commented that
Student materials Modeling Population Growth: Having Kittens S-5
© 2015 MARS, Shell Center, University of NottinghamHaving Kittens
Work out whether this number of
descendants is realistic.
Here are some facts that you will
need:
Projector Resources Modeling Population Growth: Having Kittens P-1Analyzing Sample Responses to Discuss
Your task is to correct the work and write
comments about its accuracy and
organization.
– What has the student done correctly?
– What assumptions has he or she made?
– How could the solution be improved?
Projector Resources Modeling Population Growth: Having Kittens P-2Sample Responses to Discuss: Alice Projector Resources Modeling Population Growth: Having Kittens P-3
Sample Responses to Discuss: Wayne

Projector Resources   Modeling Population Growth: Having Kittens   P-4
Sample Responses to Discuss: Ben

Projector Resources    Modeling Population Growth: Having Kittens   P-5
Reviewing Work
  • I have selected the important facts and used them to
    solve the problem.

  • I am aware of the assumptions I have made and the
    effect these assumptions have on the result.

  • I have used more than one method.

  • I have checked whether my results make sense and
    improved my method if need be.

  • I have presented my results in a way that will make
    sense to others.
Projector Resources     Modeling Population Growth: Having Kittens   P-6
Mathematics Assessment Project
CLASSROOM CHALLENGES
This lesson was designed and developed by the
Shell Center Team
University of Nottingham, England
Malcolm Swan, Clare Dawson, Sheila Evans,
Colin Foster and Marie Joubert
with
Hugh Burkhardt, Rita Crust, Andy Noyes, and Daniel Pead
It was refined on the basis of reports from teams of observers led by
David Foster, Mary Bouck, and Diane Schaefer
based on their observation of trials in US classrooms
along with comments from teachers and other users.
This project was conceived and directed for
MARS: Mathematics Assessment Resource Service
by
Alan Schoenfeld, Hugh Burkhardt, Daniel Pead, and Malcolm Swan
and based at the University of California, Berkeley
We are grateful to the many teachers, in the UK and the US, who trialed earlier versions
of these materials in their classrooms, to their students, and to
Judith Mills, Mat Crosier, Anne Floyde, Michael Galan, Nick Orchard, and Alvaro Villanueva who
contributed to the design.
This development would not have been possible without the support of
Bill & Melinda Gates Foundation
We are particularly grateful to
Carina Wong, Melissa Chabran, and Jamie McKee
© 2015 MARS, Shell Center, University of Nottingham
This material may be reproduced and distributed, without modification, for non-commercial purposes,
under the Creative Commons License detailed at http://creativecommons.org/licenses/by-nc-nd/3.0/
All other rights reserved.
Please contact map.info@mathshell.org if this license does not meet your needs.You can also read