Better health. Within reach. Every day - Hikma Pharmaceuticals PLC 2021 Interim Results
←
→
Page content transcription
If your browser does not render page correctly, please read the page content below

Better health.
Within reach.
Every day.

Hikma Pharmaceuticals PLC
2021 Interim Results
Disclaimer

Save to the extent required by law, neither Hikma Pharmaceuticals PLC nor any of its affiliates (Hikma), nor any other party, is under any duty to update or inform you of any changes to such
information. In particular, it should be noted that the financial information relating to Hikma contained in this document may not have been audited and in some cases is based on management information
and estimates.

No reliance may be placed for any purposes whatsoever on the information contained in this document or on its completeness. No representation or warranty, express or implied, is given by or on behalf of
Hikma or its directors, officers or employees, advisors or any other person as to the accuracy or completeness of the information or opinions contained in this document and no liability whatsoever is
accepted for any such information or opinions or any use which may be made of them.

Certain statements in this presentation, are forward-looking statements, including under the US federal securities laws, including the Private Securities Litigation Reform Act of 1995. By their nature,
forward-looking statements involve a number of risks, uncertainties and assumptions that could cause actual results or events to differ materially from those expressed or implied by the forward-looking
statements. These risks, uncertainties and assumptions could adversely affect the outcome and financial effects of the plans and events described herein. Any forward-looking statements made by or on
behalf of Hikma speak only as of the date they are made and are based upon the knowledge and information available to the directors on the date of this presentation.

Forward-looking statements contained in this presentation regarding past trends or activities should not be taken as a representation that such trends or activities will continue in the future. Hikma does not
undertake any obligation to update or revise any forward-looking statements, whether as a result of new information, future events or otherwise. You should not place undue reliance on forward-looking
statements, which speak as only of the date of this presentation.

By participating in, listening to or accessing this document or by accepting any copy of this document, you agree to be bound by the foregoing limitations.

All names, logos, and trademarks are properties of their respective owners and are used for identification purposes only.

Hikma Pharmaceuticals PLC                                                                                                                                                                                      2

Continued strategic progress and achieved strong Group core revenue and profit
growth

Ongoing strategic progress:

            Resilient broad portfolio                                        Continued to develop our                                       Expanded our portfolio          Continued to engage with the communities
            delivering results across                                        pipeline through R&D and                                       with successful new             in which we operate and make progress on
            three business segments                                          partnerships                                                   launches                        controlling our environmental impact

      Strong financial performance:

                        Core1                                               Core                                                    Core operating                   Operating                   Core basic
                       revenue                                          operating profit                                             profit margin                   cash flow               earnings per share

            $1,216m                                                    $309m                                                        25.4%                        $224m                          96.5¢

1   Core results are presented to show the underlying performance of the Group, excluding exceptional items and other adjustments

Hikma Pharmaceuticals PLC                                                                                                                                                                                              3
Injectables

The US market continues to face some volatility

Diagnosis visit gap1
                                                                                                                                                                                   • Patients are being cautious to
 140M
                                                                                                                                                                                     enter hospitals
 120M                 The Diagnosis
                      Visit Gap
                                                                                                                                                                                   • Fewer diagnostic tests were
                                                                                                                                                                           -978M
 100M
                                                                                                                              Total Gap of Diagnosis
  80M                                                                                                                         Visits in 2020                                         administered in 2020 and this
  60M
                                                                                                                              (Unique patient-provider diagnosis events)
                                                                                                                                                                                     trend continues in 1H21
                                                                   Expected diagnosis visits in 2020

                                                                                                                                                                           -19%
  40M
                                                                   if there was no COVID-19                                   % of Expected Diagnosis                              • Missed diagnosis visits have
 20M                                                               Actual diagnosis visits in 2020
                                                                                                                              Visits in 2020                                         a direct effect on prescription
   0M
        Jan         Feb    Mar          Apr     May       Jun      Jul     Aug      Sep       Oct          Nov    Dec                                                                utilization, elective procedures

                                                                                                                                                                                   • Vaccine deployment and other
  Impact on elective surgeries in the US1
                                                                                                                                                                                     triggers will influence how and
  40%         Jul         Aug           Sep         Oct         Nov       Dec         Jan            Feb         Mar    Apr        May         Jun
                                                                                                                                                                                     when the gap will close, or a
  20%                                                                                                                                                                                new baseline is set
  15%
  10%
   5%
   0%
  -5%
 -10%
 -15%
 -20%
 -25%
 -30%

Hikma Pharmaceuticals PLC        2   IQVIA data, week on week analysis of data, data week ending June 25, 2021                                                                                                          5
Benefitting from broad portfolio and flexible manufacturing

US Injectables revenue by competition and revenue contribution1

                                                                                                                                            119 products
                                                                                              Market leader for 58%
                                                                                                   of these products
                                                    35%
                                                                                                       2 competitors
                                                                                                                                              in our portfolio

                                                                                                     Top 3 for 81%
                                                                                                   of these products
    Sole
  player       2%                                                                     28%
                                                                                                     3-5 competitors

                                                                                                     Top 3 for 52%
                                                                                                                        11
                                                                                                   of these products
                                                 36%                                                                   products launched2
                                                                                                      >6 competitors

1 Revenue based on 1H 2021 US Injectables revenue, does not include contract manufacturing.

Competitors based on IQVIA MAT May 2021
2 As at July 2021

Hikma Pharmaceuticals PLC                                                                                                                                        6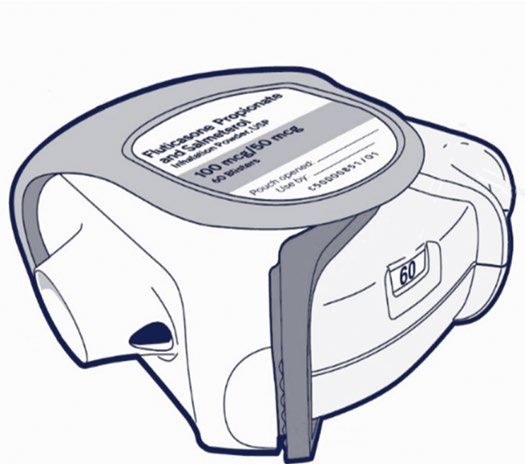
Strong growth in MENA and Europe supporting overall Injectable segment

                                  MENA
                                  +12%           $77 million
                                                               • Broad portfolio and reach across
                                   5 year CAGR   1H21
                                                                 markets allowing us to fill market gaps
       United States                                           • Significant sales force
       $318 million                                            • Partner of choice
       1H21

        +4%                       Europe
        5 year CAGR

                                  +17%           $97 million
                                                               • Broad portfolio delivering results
                                   5 year CAGR
                                                 1H21          • Launching new products across markets
                                                               • Strong manufacturing capabilities
                                                                 positions us as a partner of choice
                                                               • Good demand for contract manufacturing

Hikma Pharmaceuticals PLC                                                                                  7
Generics
Strength and resilience of this business is delivering results

                        Strong foundation
                        • Continued to drive demand for
                          our differentiated portfolio
                        • Manufacturing flexibility enabling
                          us to capture market opportunity                                   Expanding portfolio

                                                                               • Successfully launching new products
                                                                               • Increasing differentiation by building
                                                                                 specialty portfolio
                                                                               • Exceptional contribution from new
                                                                                 launches

                          Driving efficiencies
                           • Identified portfolio optimization opportunities
                           • Continued to improve service levels and achieve
                             manufacturing efficiencies

    Hikma Pharmaceuticals PLC                                                                                             9
Confidential
Strong commercial capabilities enabling us to capture market share
Gradual increase in icosapent ethyl market share1 Good progress with generic Advair Diskus® launch
100.0%
100.0%
We secured strategic business and are confident
90.0% 94.2%
92.2% 91.0% in our ability to achieve target market share
88.7% 88.4% 88.5% 87.4%
80.0% 85.2%
70.0%
60.0%
1
50.0% 2
Launch has been
40.0%
positive, received
30.0% good feedback
from customers
20.0% 14.6% 3
11.3% 11.6% 11.5% 12.6%
7.8% 9.0%
10.0% 5.8%
0.0%
0.0% Volume growth will appear as customers
Oct-20 Nov-20 Dec-20 Jan-21 Feb-21 Mar-21 Apr-21 May-21 Jun-21
work through incumbent inventory
Hikma Amarin
1IQVIA monthy TRx, June 2021
Hikma Pharmaceuticals PLC 10Leveraging our position as a leading supplier of nasal sprays in the US
Naloxone HCl market overview1
100%
90% 30% 38% Retail • Increasing access to important
80%
medication through retail and
government business
70% • Building Hikma Community Health
as a vehicle for broad education
60%
initiatives
50% • Leveraging our position as leading
supplier of nasal sprays and
40% “There is an urgent need for
commercial expertise to meet
patient needs additional resources to combat
30%
this epidemic, and KLOXXADOTM
• Builds upon Hikma Specialty
20%
experience with branded will provide an important new
Public retail sales tool for those on the front lines
10% 70% 62% Health of this fight.”
0% DESIREE CREVECOEUR-MACPHAIL2
Units Sales
1Hikma internal analysis
2 Ph.D.,
Assistant Professor of Psychology, Chapman University and former Director of Quality
Assurance and Utilization Management for the Los Angeles Centers for Alcohol and Drug Abuse
Hikma Pharmaceuticals PLC 11Branded
Delivering growth in Tier 1 markets and benefitting from strong commercial
capabilities

Selected MENA markets by size2
                                                      Tier
                                                              1
                                                                                                                   Saudi Arabia

                                               Iraq
                                                                                                            +9%    • Benefitted from the flexibility of our
                                                                                                                     manufacturing and commercial operations
       Tier
               2            UAE                                                      Saudi                         • Resilient performance from broad portfolio
                                                                                     Arabia
                                                                                                                   Egypt
              Lebanon
                                                                                               Tier 1
              Jordan
                                                   $31                                         markets      +13%   • Some COVID-19 related demand and pull-
                                                                                                                     forward of demand for certain products
          Morocco
                                               billion                                         delivering
                                               market                                          growth
                                                                                                                   • Good performance from broader portfolio
               Sudan
               Tunisia                                                                 Egypt
                                                                                                                   Algeria
  Tier
          3                                                                                                 +39%   • Improved management of commercial strategy
                                                                                                                     and stock levels at wholesalers delivering results
                                Others                                   Algeria
                                                                                                                   • Captured market opportunities due to competitor
                                                                                                                     disruptions
                                                                                                                   • Launched first product from new oncology plant
                                       Tier    4
Hikma Pharmaceuticals PLC   2   Fitch Solutions estimates pharma market sales 2020                                                                                     13
Finance Khalid Nabilsi, Chief Financial Officer
Group financial highlights

                                                                                                                                                          1H20                                                       1H21                                              % change

  Core1 revenue                                                                                                                              $1,132 million                                             $1,216 million                                                       +7%

  Core gross profit                                                                                                                             $577 million                                               $616 million                                                      +7%

  Core operating profit                                                                                                                         $284 million                                               $309 million                                                      +9%

  Core EBITDA2                                                                                                                                  $328 million                                               $358 million                                                      +9%

  Core net income                                                                                                                               $205 million                                               $223 million                                                      +9%

  Basic earnings per share3                                                                                                                        87.6 cents                                               107.4 cents                                                      +23%

  Core basic earnings per share3                                                                                                                   85.3 cents                                                 96.5 cents                                                     +13%

  Interim dividend per share                                                                                                                          16 cents                                                   18 cents                                                    +13%

1 Core results are presented to show the underlying performance of the Group, excluding exceptional items and other adjustments. Core results are a non-IFRS measure and a reconciliation to reported IFRS measures is provided in our 2021 interim results press
2 Core EBITDA is earnings before interest, tax, depreciation, amortisation, impairment and exceptional and other items. EBITDA is a non-IFRS measure, see 2021 interim press release for a reconciliation to reported IFRS results. Core EBITDA is calculated for trailing
twelve months ended 30 June 2021
3 In June 2020, Hikma purchased 12.8 million ordinary shares from Boehringer Ingelheim, which are being held in treasury.

 Hikma Pharmaceuticals PLC                                                                                                                                                                                                                                                          15
Injectables
Core revenue Core operating profit Core revenue
(million) (million)
● Constant currency ● Constant currency
Good growth in MENA, reflecting good demand for our
$600 $250 portfolio and biosimilars
(5)%
$200 Strong growth in Europe, reflecting good demand for
$500 $485 1% $492 $204 contract manufacturing and new launches
(8)% $187
$63 $97 $150
0.2% Launched new products across all markets
$400 $75
$100 Reduced demand for COVID-19 related products in the
$77
US vs strong 1H20
$347
$300 $50
$318 Slowdown in elective surgeries
$0
$200 1H20 1H21 Core operating profit
Less favourable product mix in the US
$100
Operating margin
1H21 Negative foreign exchange movements in MENA
constant
1H20 1H21 Change currency Change
$0
1H20 1H21 Reported 39.6% 35.6% (4.0)p 37.4% (2.2)p
US MENA Europe Core 42.1% 38.0% (4.1)p 39.9% (2.2)p
Hikma Pharmaceuticals PLC 16Generics
Core revenue Core operating profit Core revenue
(million) (million)
$120
Good demand for differentiated products
$400 8% $100 Strong contribution from new launches
$400 39% 100
$369 $80 Increased competition on certain products
$60
72
$300
$40
Core operating profit
$20
$200 Improved product mix driven by new launches
$0
1H20 1H21 Lower operating expenses due to timing of R&D
spend
$100
Operating margin
1H20 1H21 Change
$0 Reported 27.6% 33.5% 5.9pp
1H20 1H21
Core 19.5% 25.0% 5.5pp
Hikma Pharmaceuticals PLC 17Branded
Core revenue Core operating profit Core revenue
(million) (million)
● Constant currency ● Constant currency
Good growth in Tier 1 and other markets
$350 $80
Benefitting from our local presence in Algeria
17% $319 47%
$300
$60 $64
16% Continued demand in Egypt for COVID-19 related
$275 25% products
$250 $51
$40
Captured opportunities in the private market in
Saudi Arabia
$200
$20
More balanced distribution of revenue across the
$150 year
$0
1H20 1H21 Core operating profit
$100
Improvement in product mix
Operating margin
$50
1H21 Increase in SG&A and foreign exchange losses
constant
1H20 1H21 Change currency Change
$0
1H20 1H21 Reported 16.7% 18.5% 1.8pp 21.7% 5.0pp
Core 18.5% 20.1% 1.6pp 23.2% 4.7pp
Hikma Pharmaceuticals PLC 18Core R&D and capital expenditure
Core R&D Cash capital expenditure
(million) (million)
$70 $80
$66 $65
$60
$62
$59 $60
$50
US $26
$40
$38
$40
$30 $29
MENA
$20
$20 $22
$10
Europe
$6 $10
$0 $0
1H20 1H21 1H20 1H21
● Invested 5% of Group core revenue in core R&D ● Upgrading, expanding packaging and adding new technologies in US
● The slight decreased reflects timing of spend. Expect higher ● Strengthening and expanding manufacturing and warehousing
investment in the second half of the year capabilities in MENA
● Expanding and strengthening capabilities in Europe
Hikma Pharmaceuticals PLC 19Cash flow and balance sheet
Debt and leverage
(millions)
860 932 932
777
Operating cash flow
637
685 Jun-20 Jun-21
1.4x 1.2x Operating cash flow 292 224
0.7x Operating cash flow/core
0.9x 26% 18%
0.9x revenue
697 0.4x
546 605 606
361
242
2016 2017 2018 2019 2020 1H21
Net debt Total debt Net debt/core EBITDA
Hikma Pharmaceuticals PLC 20Raised 2021 guidance
Injectables Generics Branded
● Revenue: ● Revenue: ● Revenue growth in constant
mid-single digits $810 million to $830 million currency:
● Core operating margin: ● Core operating margin: mid-single digits
37% to 38% 22% to 24%
Net finance expense Capital expenditure Tax
● Net finance expense: ● Capital expenditure: ● Core effective tax rate:
c.$50 million $140 million to $160 million 22% to 23%
Hikma Pharmaceuticals PLC 21Hikma is well positioned to deliver sustainable growth
Three global Diversified
Businesses revenue stream
Strategic financial Manufacturing sites with close
flexibility proximity to key markets
Little product Lifelong commitment
concentration to quality
Hikma Pharmaceuticals PLC 23Appendix
1H21 exceptional items and other adjustments

    Bridge between 1H21 core and reported operating profit                                          Bridge between 1H21 core and reported net income
    (million)                                                                                       (million)

                                             $17 million                                                                                       $25 million

                                                                                    $326
                  $309                                                                                                                               $17                 $9             248
                                      $29                   $46                                                  $223            $17

               Core operating       Intangible                 Impairment           Reported                               Amortisation and        Unwinding and
                                                                                                                Core net                                                Tax impact on    Reported
                   profit       amortisation (other        reversal of product   operating profit                          exceptional items      remeasurement
                                                                                                                income                                                   exceptional    net income
                                  than software)           related intangibles                                                included in           of contingent           items
                                                                                                                            operating profit        consideration
                                                                                                                                                      and other
                                                                                                                                                  financial liability
                                                                                                                                                        (net)

    Hikma Pharmaceuticals PLC                                                                                                                                                                        25
Confidential
2021 expected exceptional items and other adjustments
Bridge between 2021 core and reported operating profit Bridge between 2021 core and reported net income
(million) (million)
$(14) million $5 million
$1
$60 $46 $14 $21
Core Intangible Impairment Reported Core net Amortisation and Remeasurement Tax impact on Reported
operating amortisation reversal of operating income exceptional of contingent exceptional net income
profit (other than product related profit items included in consideration, items
software) Intangibles operating profit financial liability
and asset (net)
These figures are based on estimates and are subject to change These figures are based on estimates and are subject to change
Graphs are not to scale Graphs are not to scale
Hikma Pharmaceuticals PLC 26
ConfidentialGroup core revenue by segment and region
1H21 Group core revenue by segment 1H21 Group core revenue by region
US
Injectables 59%
41% Generics
33%
Other MENA
EU & ROW
Branded 0% 33% 8%
26%
Hikma Pharmaceuticals PLC 27
ConfidentialCore finance expense
1H21 core finance expense
(million)
$30
$25
$25
Other bank charges, including
5 commissions and factoring
$20
$15 Effective interest rate:
12 3.77%
Interest on loans
$10
Effective interest rate:
$5
8 Interest and fees on 4.41%
(including commitment and amortised upfront fees)
Eurobond ($500m)
$0
1H21 .
Hikma Pharmaceuticals PLC 28
ConfidentialYou can also read