SUPERIOR INDUSTRIES INTERNATIONAL, INC - INVESTOR PRESENTATION JANUARY 16, 2019
←
→
Page content transcription
If your browser does not render page correctly, please read the page content below
SUPERIOR INDUSTRIES
INTERNATIONAL, INC.

INVESTOR PRESENTATION
JANUARY 16, 2019
Forward-Looking Statements and Non-GAAP Financial Measures

Forward-Looking Statements

This webcast and presentation contain statements that are forward-looking statements within the meaning of the Private Securities Litigation Reform Act
of 1995. Forward-looking statements include all statements that do not relate solely to historical or current facts and can generally be identified by the
use of future dates or words such as "may," "should," "could," “will,” "expects," "seeks to," "anticipates," "plans," "believes," "estimates," "intends,"
"predicts," "projects," "potential" or "continue" or the negative of such terms and other comparable terminology. These statements also include, but are
not limited to, the 2018 Outlook included herein, the Company’s ability to integrate European operations, and the Company’s strategic and operational
initiatives, product mix and overall cost improvement and are based on current expectations, estimates, and projections about the Company's business
based, in part, on assumptions made by management. These statements are not guarantees of future performance and involve risks, uncertainties and
assumptions that are difficult to predict. Therefore, actual outcomes and results may differ materially from what is expressed or forecasted in such
forward-looking statements due to numerous factors, risks, and uncertainties discussed in the Company's Securities and Exchange Commission filings
and reports, including the Company's Annual Report on Form 10-K for the year ended December 31, 2017 and other reports from time to time filed with
the Securities and Exchange Commission. You are cautioned not to unduly rely on such forward-looking statements when evaluating the information
presented in this presentation. Such forward-looking statements speak only as of the date on which they are made and the Company does not undertake
any obligation to update any forward-looking statement to reflect events or circumstances after the date of this webcast and presentation.

Use of Non-GAAP Financial Measures

In addition to the results reported in accordance with GAAP included throughout this presentation, this presentation refers to “Adjusted EBITDA,” which
we have defined as earnings before interest, income taxes, depreciation, amortization, acquisition and integration costs, change in fair value of preferred
derivative and plant closure costs, and “Value-Added Sales,” which we define as net sales less pass-through charges primarily for the value of
aluminum. Adjusted EBITDA and Value-Added Sales are not calculated in accordance with GAAP.
Management believes the non-GAAP financial measures discussed in this presentation are useful to both management and investors in their analysis of
the Company’s financial position and results of operations. Further, management uses these non-GAAP financial measures for planning and forecasting
future periods. This non-GAAP financial information is provided as additional information for investors and is not in accordance with or an alternative to
GAAP. These non-GAAP measures may be different from similar measures used by other companies.
For reconciliations of these non-GAAP financial measures to the most directly comparable financial measures calculated and presented in accordance
with GAAP, see the appendix of this presentation.
In reliance on the safe harbor provided under Item 10(e) of Regulation S-K, we have not quantitatively reconciled differences between Adjusted EBITDA
presented in our updated 2018 Outlook to net income, the most comparable GAAP measure, as Superior is unable to quantify certain amounts that
would be required to be included in net income without unreasonable efforts and due to the inherent uncertainty regarding such variables. Superior also
believes that such a reconciliation would imply a degree of precision that could potentially be confusing or misleading to investors. However, the
magnitude of these amounts may be significant.

                                                                                                                                                    2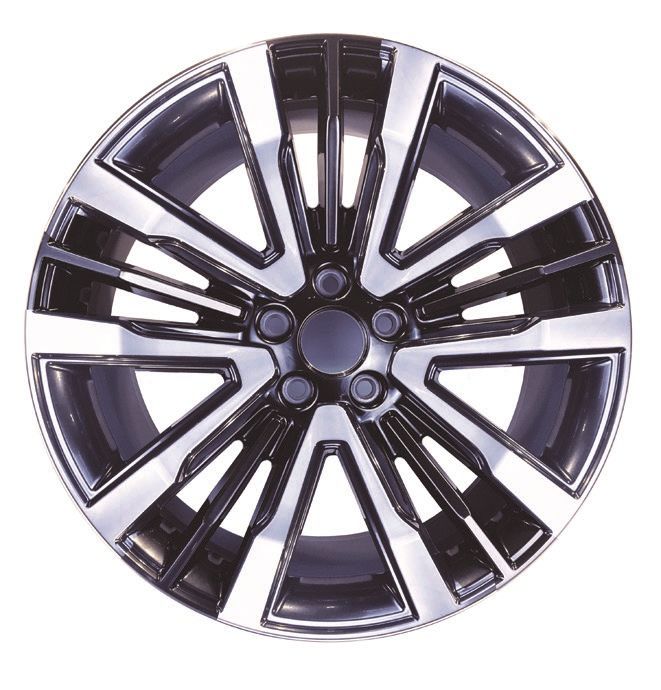
3
Matti Masanovich
Executive Vice President and
Chief Financial Officer
Global Player in an Evolving Landscape

        #1                             #1                                          #3                   ~21.0M
                        AFTERMARKET WHEEL                               OEM WHEEL
    OEM WHEEL                                                                                           2018E WHEEL
                        MANUFACTURER IN EU(1)                       MANUFACTURER IN EU(1)
MANUFACTURER IN NA(1)                                                                                   SHIPMENTS(2)

     ~8,000                                                                                           Diversified
    EMPLOYEES                                                                                        SERVING NEARLY ALL
    WORLDWIDE                                                                                           GLOBAL OEMS

    ~$1.5B                                                                                            Leading EU
                                                    A Leader
  2018E REVENUE(2)                               ALUMINUM WHEELS                                      Aftermarket
                                                FOR LIGHT VEHICLES                                      Brands

      Safety                            9                                        60+
                                                                            YEARS IN THE
WORLD CLASS SAFETY              PRODUCTION
                                                                            AUTOMOTIVE
     RECORD                      FACILITIES
                                                                             INDUSTRY

                        (1)   Company estimate; includes aluminum wheels for light vehicles only
                        (2)   Based on the midpoint of FY2018 Outlook provided on November 9, 2018                     5
Our Locations

1    SOUTHFIELD, MI – USA
     •  Corporate Headquarters

2 FAYETTEVILLE, AR – USA
     •   R&D and Customer Center                                           1
     •   Production                                                            Michigan

3    CHIHUAHUA – MEXICO
     •  4 Plants                                                      2 Arkansas
     •  Shared Services Center                        3
                                                          Chihuahua
     BAD DÜRKHEIM – GERMANY
4    •  European Headquarters
     •  Logistic Center (Aftermarket)

5    WERDOHL / LÜDENSCHEID – GERMANY
     • Production
     • R&D and Customer Center

     STALOWA WOLA – POLAND
6    •  3 Plants
     •  Tool Shop                                                        Poland
                                                          Germany
     FUßGÖNHEIM – GERMANY                         5
7                                                                                   6
     •  Motorsports and Forged Wheel Production
     •  Prototype Development and Production      4 7

                                                                                          6
Historical Financial Performance
                                                      Units                                                                                           Value-Added Sales(1)
                                             (Units in millions)                                                                                                ($ in millions)
                                                                                                                                                                                              $790 - $805
                                                                                             20.85 - 21.05

                                                                       17.0                                                                                                  $616.8

                                         12.3                                                                                                           $408.7
           11.2                                                                                                                      $360.9

                                                                                                               (2)                                                                                      (2)
          2015                          2016                          2017                          2018E                                2015               2016              2017              2018E
                                      Adjusted EBITDA(1)                                                                                  YTD Sales by Customer as of 9/30/2018(3)
                                                 ($ in millions)

                                                                                                                                                             7%             18%
                                                                                              $175 - $180                                                Aftermarket
                                                                                                                                                       6%
                                                                                                                                                      Other

                                                                     $140.1                                                                       3%
                                                                                                                                                 3%
                                                                                                                                                                                        18%
                                                                                                                                                 5%
                                        $88.5
          $76.1                                                                                                                                  5%

                                                                                                                                                       7%
                                                                                                                                                                                  12%
                                                                                                                (2)
           2015                          2016                          2017                         2018E                                                     8%
                                                                                                                                                                       8%
(1) Value-Added Sales and Adjusted EBITDA are non-GAAP financial measures;
   see slide 2 for information about non-GAAP Financial Measures and appendix for a reconciliation to the most comparable GAAP measure
(2) FY 2018 Outlook as provided on November 9, 2018; growth figures based on mid-point of Outlook
(3) Sales in USD as of 9/30/2018

                                                                                                                                                                                                    7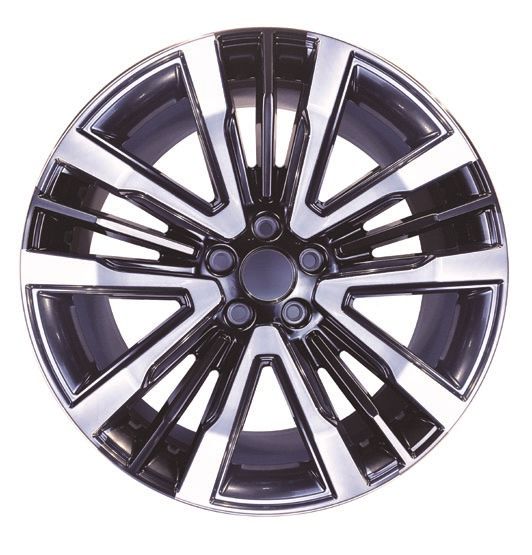
Geographic and Vehicle Diversification for Superior

    GEOGRAPHIC DIVERSIFICATION      GLOBAL VEHICLE DIVERSIFICATION
           2018E UNITS                       2018E UNITS

              North                           Passenger
             America                             Car
              ~54%                              ~40%

                                                          Crossover/
                                                           Minivan
                                      Pickup/SUV            ~24%
                                         ~36%
           Europe
           ~46%

                                                                       8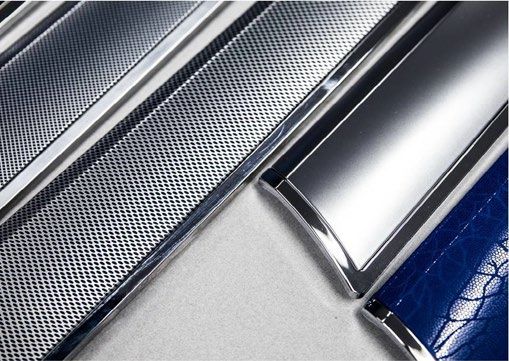
Our Priorities

      Capitalize on secular trends
                                            Generate Profitable
                                               Growth and
                                             Deliver Value to
      Expand customer opportunities
                                              Shareholders

      Invest in new technologies / capabilities

      Build best-in-class organization

      Drive margins and cash flow

                                                                  9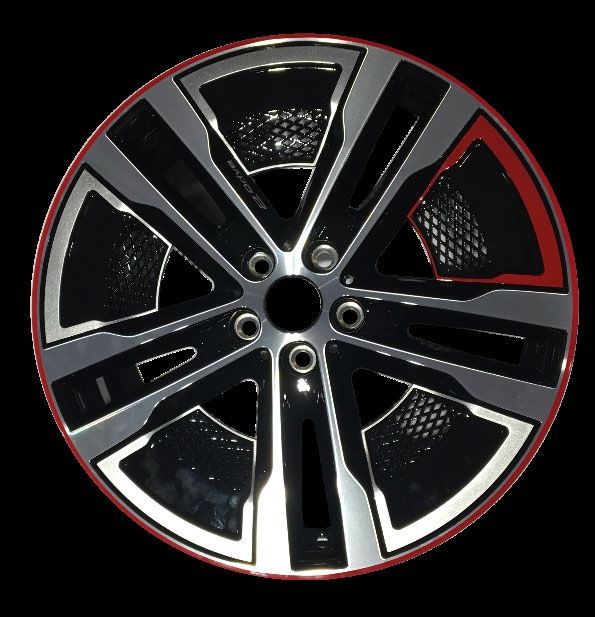
PARVEEN KAKAR
Senior Vice President
Sales, Marketing & Product Development
Video

        11
Secular Tailwinds – Driving Increase in Addressable Market
Premium Finishes
Light Weighting
Larger Diameters
Wheels
2017 2018 2019 2020 2021
Content per Vehicle = Addressable Market
12ALUMINUM WHEELS & AUTOMOTIVE TRENDS
Emission Standards:
Reducing CO2 emissions
Improved fuel efficiency
Global Convergence toward 2025
Wheels Trends:
Increasing Diameters 18” – 22”
Better Ride & Handling
Styling Flexibility
New Finishes
13Aluminum Wheels & Automotive trends
• Weight reduction of up to 20%-35% compared to traditional steel wheel(1)
• Supports ride and handling improvement objectives
• Consumer preference: Styling and Finish
• Revenue opportunity for OEM’s on higher trim levels
(1) Engineering estimate. Varies with wheel size and style.
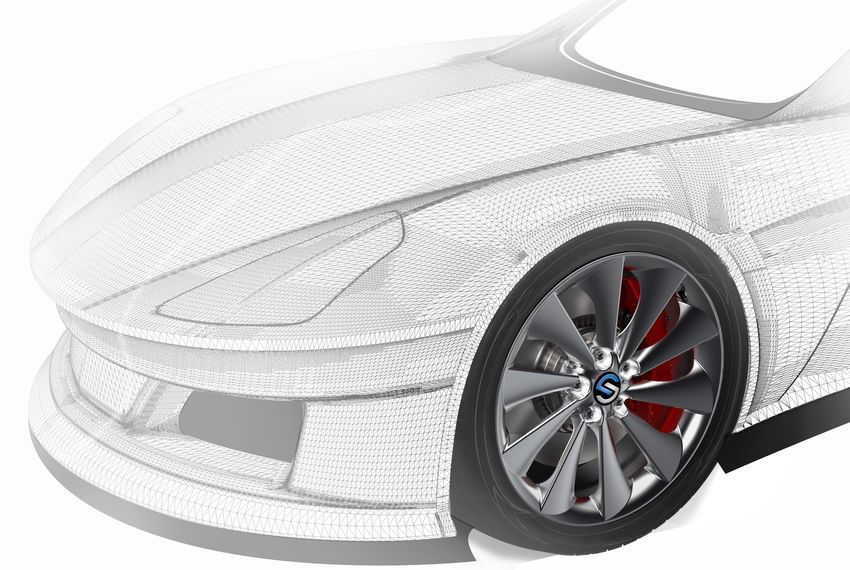
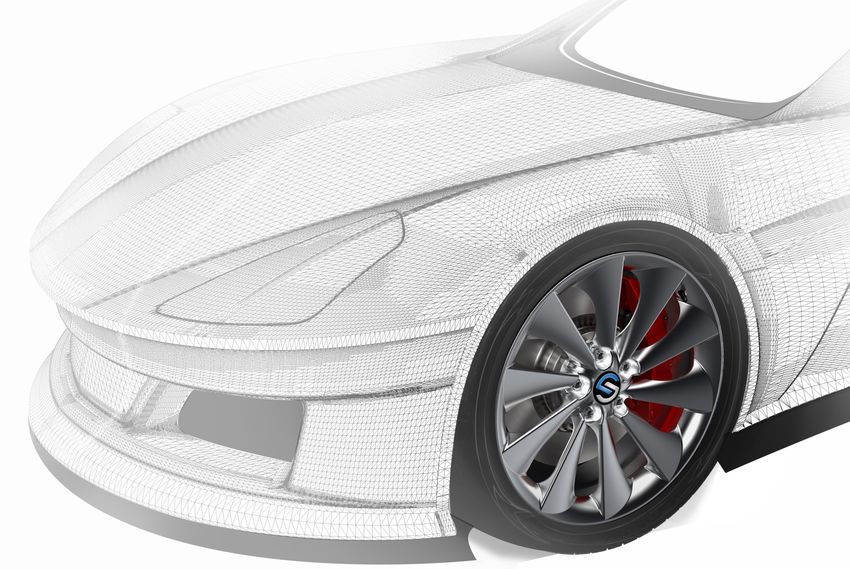
14Our Products
Our Company is a leader in the manufacturing of
Aluminum wheels for Global OEM’s
Finishes Wheels Sizes Technologies
• Fully Painted • Cast Aluminum • AluLite™
• Aero
• Premium Paint Sizes: up to 24” • Flow Forming
• Diamond Cut / Bright Machined • Flow Formed • Laser Etch
• Milled
• Ultra Bright / Mirror Finish Sizes: up to 24”
• Pad Print
• Polished • Forged Wheels • PVD
• PVD (Bright Chrome and Dark Chrome) Sizes: up to 24”
15Superior: Wheel Size Mix
North America
Market(1) 19”+ 10% 23%
Superior 19”+ 20% 30%+
Europe
Market(1) 19”+ 12% 14%
Superior 19”+ 23% 30%+
• Share penetration for 19” and above ahead of market expansion in North America and Europe
• Investing in Mexico for additional 20” capability to accommodate increased share of larger wheels
• Finished expansion in Poland for larger wheel diameter capability
(1) LMC Tire Diameter Data 2018 - 2022
16Safety Critical Component
17Light Weighting Technology Portfolio
STANDARD STEEL WHEEL
30-45 lbs(1) / Vehicle
Weight savings
“Preform” Shape
STYLED CAST ALUMINUM Flow Form Rim
WHEEL
AluLite™
FLOW FORMING
RIM SPINNING
Patented Technology : 10-15 lbs(1) / Vehicle
weight savings 10-15 lbs(1) / Vehicle
weight savings
(1) Engineering estimate. Varies with wheel size and style.
18RIM Flow Forming technology
Grain Structure
Comparison
CAST RIM
Flowform Roller
Cast
“Preform”
Flowform Rim
FLOW FORMED RIM
• By 2022, over 2M (10%+) Superior wheels will use this premium technology
19
19Fuel Efficiency / CO2 Emissions – Aerodynamic Design
Computation Fluid
Dynamics (CFD) Current design approach potentially compromises style &
Simulation weight to improve ‘Aero’ performance
AERODYNAMIC DECORATIVE
INSERTS
Potential savings* up to New design and texture
3gm CO2 / KM possibilities
*RWTH (University of Aachen) for the federal department of Trade and Industry‚ Reduction of CO2 Emissions Concept Prototype
for passenger Cars and Light vehicule trucks after 2020.
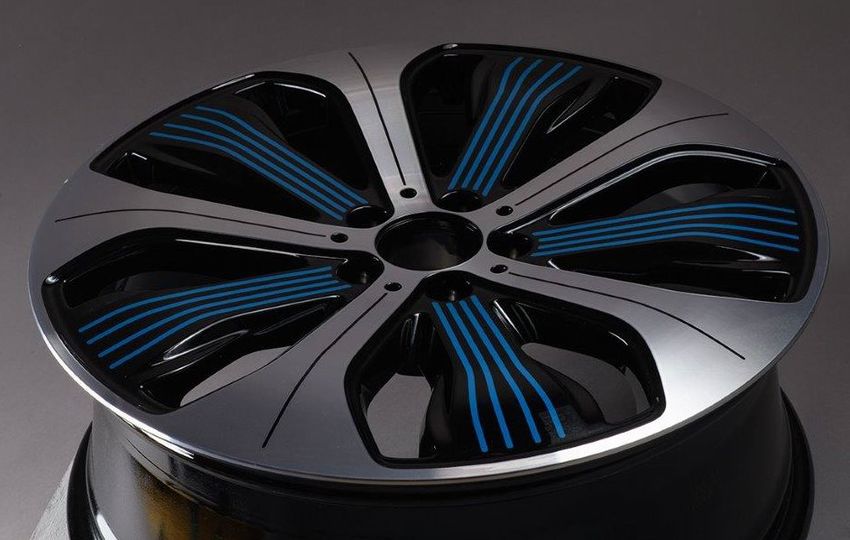
20Premium Finishing Trends
SURFACE PRINT LASER ETCH
BLUE STRIPES LASER ETCH
ENGRAVING
ENGRAVING
State of the art fully automated equipment.
First to market with multi-color contour surface Production starting in North America in 2019.
printing in Europe.
Production started in Europe in 2018.
State of the art 5- Axis Decorative Milling
DECORATIVE ACCENTS Production started in North America in 2018.
5-AXIS MILLING
21Matti Masanovich Executive Vice President and Chief Financial Officer
2018 Financial Outlook

                                                  Key Metrics                                                2018 Outlook(2)

                                   Unit Volume (000s)                                                                 20,850 - 21,050

                                   Net Sales                                                                         $1.48B - $1.51B

                                   Value-Added Sales(1)                                                               $790M - $805M

                                   Adjusted EBITDA(1)                                                                 $175M - $180M

                                   Capital Expenditures                                                      Approximately $85M

                                   Cash Flow from Operations                                                          $130M - $145M

                                   Effective Tax Rate                                                                  At or below 0%

(1) Value-Added Sales and Adjusted EBITDA are non-GAAP financial measures; see appendix for reconciliation of Value-Added Sales to the most comparable GAAP measures;
reference Slide 2 for definition of non-GAAP financial measures
(2) Provided on November 9, 2018

                                                                                                                                                                        23
Capital Allocation Priorities
Reduce Invest in the Create Shareholder
Leverage Business Value
• Utilize cash flow to pay down • Enhance return on invested • EPS accretion
debt capital • Dividends to shareholders
• Drive margins and deliver • Focus on global automotive • Strategic initiatives
Adjusted EBITDA trends
• Enhance working capital • Expand finishing capabilities
management • Pursue operational
excellence initiatives
24Debt Amortization/Maturity Schedule
($ in Millions)
Principal Maturities
$364
$291
Required Principal Amortization
$7 $7 $7 $7 $7 $7
2018 2019 2020 2021 2022 2023 2024 2025
Term Loan B European Equipment Loan Senior Notes
Note: EURUSD of 1.1641 as of Sep 30, 2018
25Key Investment Highlights
Strong Secular Tailwinds
Enhanced Competitive Footprint
Diversified Customers, Geographies and
Segments
Electric / Internal Combustion Agnostic
Driving Margin and Cash Flow Improvement
Delivering Innovation and Technology
26APPENDIX
Reconciliation of Non-GAAP Financial Measures

             Value Added Sales                                                          Twelve Months
                                                                          FY 2017           FY 2016         FY 2015
              Net Sales                                               C   $ 1,108.1 E       $   732.7 A     $ 727.9
              Less:
               Aluminum Value and Outside Service Provider Costs      C       (491.3) RX   (324.0) A            367.1
              Value Added Sales                                       C $      616.8 L   $   408.7 A        $   360.8

             Adjusted EBITDA                                                        Twelve Months
 Unaudited

                                                                         FY 2017       FY 2016              FY 2015
              Consolidated Net (Loss) Income                          C $     (6.0) J  $    41.4 A          $   23.9
              Adjusting Items:
               - Interest Expense (Income), net                       C         40.0    M       (0.2)   A        (0.1)
               - Income Tax Provision                                 C           6.9   M       13.3    A        11.3
               - Depreciation                                         C         54.2    M       34.3    A        34.5
               - Amortization                                         C         15.2    M           -   A            -
               - Inventory Step-up                                    C         12.1    M           -   A            -
               - M&A and Integration Costs                            C         32.1    K           -   A            -
               - Foreign Exchange M&A Gains                           C         (8.2)   K           -   A            -
               - Change in Fair Value of Preferred Derivative         C         (6.2)   M           -   A            -
               - Closure Costs (Excluding Accelerated Depreciation)   C           0.1M            1.2   A          6.3
               - Gain on sale of facility                             C             -M          (1.4)   A            -
                                                                                     R
                                                                          $    146.1        $    47.1       $    52.1
                                                                      C              X                A
              Adjusted EBITDA                                         C   $    140.1 M      $    88.5 A     $    76.1

                                                                                                                28
Reconciliation of Non-GAAP Financial Measures
Outlook for Full Year 2018 Value-Added Sales Outlook Range
Unaudited
Net Sales Outlook $ 1,480.0 $ 1,510.0
Less:
Aluminum Value and Outside Service Provider Costs (690.0) (705.0)
Value-Added Sales Outlook $ 790.0 $ 805.0
29You can also read