SEVEN TOOLS AS THE PROBLEM SOLVING WAYS T0
←
→
Page content transcription
If your browser does not render page correctly, please read the page content below
UNIVERSITAS TRIDHARMA                                                           MECHA JURNAL TEKNIK MESIN
                                                                                       VOL. 3 NO. 2 APRIL 2021
                                                                             E-ISSN: 2656-9906, P-ISSN: 2656-9434

      SEVEN TOOLS AS THE PROBLEM SOLVING WAYS T0
              IMPROVE QUALITY CONTROL

                              Rachmasari Pramita Wardhani1, Erwin Gustianta2
           Program Studi Teknik Mesin, Fakultas Teknik, Universitas Tridharma1,, PDAM Balikpapan2
                           Email : rrrachmasari@gmail.com1, rwing.ir@gmail.com2

                                              ABSTRAK
        Ada banyak cara bagi perusahaan untuk mencapai standar yang baik untuk barang dan jasanya.
Standar penting untuk mencapai tingkat kepercayaan pelanggan. Perusahaan harus menjaga kualitas jasa
dan produknya, termasuk dalam hal ini kualitas barang disamping jasa. Untuk memastikan
pencapaiannya, diperlukan sistem dan proses manajemen yang terarah untuk mencapai tingkat
kepercayaan pelanggan.
        Banyak perusahaan menggunakan alat berkualitas untuk membantu memantau dan mengelola
sistem kualitas mereka. Ada beberapa jenis alat yang bisa digunakan. Namun lebih, ada tujuh alat
manajemen untuk pengendalian kualitas yang paling umum. Tujuh alat dapat digunakan oleh profesional
mana pun untuk memudahkan proses peningkatan kualitas seperti diagram alir, lembar periksa, diagram
Pareto, diagram sebab dan akibat, histogram, diagram pencar, dan diagram kendali.

Kata Kunci : tujuh alat , pengendalian , kualitas, problem solving

                                                ABSTRACT
           There are many ways for the company to reach a good standard for their goods and services.
Standard is essential to achieve a level of customer trust. The company must be maintaining the quality of
their services and products, including in this case the quality of goods beside the services. To ensure its
achievement, a directed management system and processes are needed to achieve the level of customer
trust.
           Many companies use quality tools to help monitor and manage their quality system. There are
several types of tools that can be used. But the more, there are seven management tools for quality
control are the most common. Seven tools can be used by any professional to ease the quality
improvement process like flowcharts, check sheets, Pareto diagrams, cause and effect diagrams,
histograms, scatter diagrams, and control charts.

Key words : seven tools, control, quality, problem solving

PREFACE
        There are many ways for the company               of customer trust. The company must be
to reach a good standard for their goods and              maintaining the quality of their services and
services. Standard is essential to achieve a level        products, including in this case the quality of

                                                                                                                    10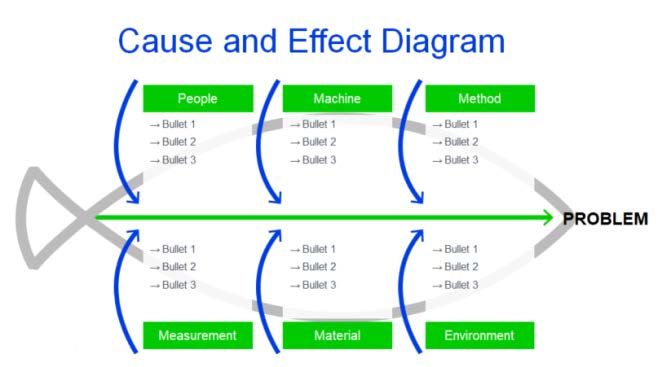
UNIVERSITAS TRIDHARMA                                                        MECHA JURNAL TEKNIK MESIN
                                                                                    VOL. 3 NO. 2 APRIL 2021
                                                                          E-ISSN: 2656-9906, P-ISSN: 2656-9434

goods beside the services. To ensure its              center of attention of researchers based on a
achievement, a directed management system and         specific time sequence in detail.
processes are needed to achieve the level of                   According to Polikinghome (1988) in
customer trust. Many companies use quality            Sandelowski (1991), narrative research is
tools to help monitor and manage their quality        categorized into two, namely descriptive and
system. There are several types of tools that can     explanatory . In descriptive category narrative
be used.       But the more, there are seven          research, the researcher tries to describe (a) part
management tools for quality control are the          or all of individual and group experiences, (b)
most common. Seven tools can be used by any           the relationship between one storyline and
professional to ease the quality improvement          another, (c) the benefits of an event for human
process like flowcharts, check sheets, Pareto         life. While in category narrative research
diagrams, cause and effect diagrams, histograms,      explanatory , the researcher is trying to make a
scatter diagrams, and control charts. The concept     story about how something happened.
behind the seven basic tools came from Kaoru
Ishikawa, is a renowned quality expert from           ANALYSIS
Japan. Dr. Ishikawa (1915 – 1989) had a               Basics quality tools
profound impact on quality improvement world-                  Many types of controlling tools has been
wide. Dr. Ishikawa developed the concept of           used in several of companies. But the old seven
quality circles. He believed that everyone            tools for quality control that are very common as
should be involved in quality improvement.            a different tool is used for different problem-
Quality circles provided a method of doing this       solving techniques. in the top of management
in the organizations. It enabled everyone to          system level must be familiar and know well
work on process improvement by suggesting             about these problem solving tools to
ideas to improve products and processes. Quality      implementing in the company. these tools are
control is a part of quality management system,       namely;
it is an important factor for company or                  1) Cause and Effect Diagrams,
organization to become lean and more                      2) Flow Charts,
productive. In order to check quality first is            3) Check sheets,
identify the attribute that want to measure.              4) Histograms,
         The author has chosen in the writing of          5) Pareto Charts,
this scientific paper, it is about “Seven tools as        6) Control Charts or Shewhart Chart,
the problem solving ways to improve quality               7) Scatter Diagrams.
control “. The topic before ever published by
Neyestani, B. (2017). Seven Basic Tools of            1.Cause and effect diagrams
Quality Control: The Appropriate Techniques                   The cause and effect diagram also
for Solving Quality Problems.                         known as the ‘fishbone diagram’ or Ishikawa
                                                      diagram , the diagram looks like a fish Skelton.
METHOD                                                The Father in ‘Quality Circles’ Professor K.
                                                      Ishikawa, was the first to develop the Cause and
        In this writing, the method used by the       Effect Analysis in the 1960s.
author is descriptive research method and                     Brainstorming is done, and then a
narrative analysis. according to Webster and          diagram is developed after all of the possible
Metrova (2007), narrative ( narrative ) is a          causes of a problem. In this way, a thorough
research method in the social sciences. The           analysis is done of any specifics of the situation.
essence of this method is its ability to understand   This method is best when dealing with
a person's identity and world view by referring       complicated issues.
to the stories (narratives) that he listens to or             The most commonly used in categoare
tells in his daily activities. Thus narrative         in diagram case are people, machine, method,
research can be interpreted as the study of a         measurement, material, and environment.
story that tells and describes an event that is the

                                                                                                                 11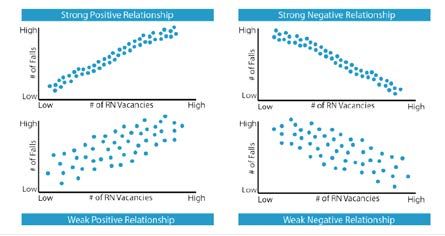
UNIVERSITAS TRIDHARMA MECHA JURNAL TEKNIK MESIN
VOL. 3 NO. 2 APRIL 2021
E-ISSN: 2656-9906, P-ISSN: 2656-9434
According to Ishikawa (1982), check
sheets have the following functions:
• Production process distribution checks,
• Defective item checks,
• Defective location checks,
• Examination of the causes of defects
(defective cause checks),
• Check-up confirmation checks
4. Histograms,
Figure 1 Cause and effect diagram A histogram is the most commonly used
Source: ease.io graph to show frequency distributions. A
histogram is a graph of the frequency
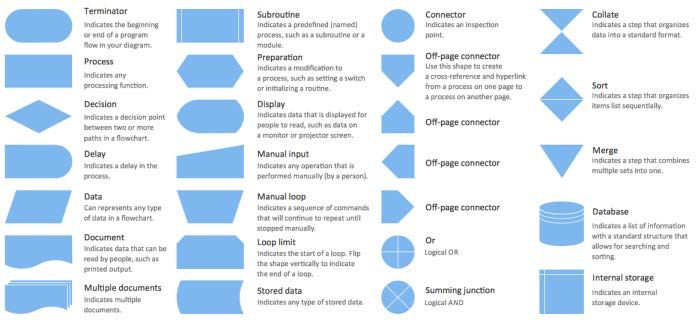
2. Flow chart distribution in which the vertical axis represents
A flow chart is a diagram that shows the the count (frequency) and the horizontal axis
step-by-step flow of operation to get a solution represents the possible range of the data values.
of a problem or to figure out the correct It displays the different measures of central
sequence of the process. Flow charts are often tendency (mean, mode, and average). It should
used to document existing process standards, so be designed properly for those working into the
they become guidelines in carrying out the operation process can easily utilize and
production process. Flow charts or flow understand them. Also, a histogram can be
diagrams are also used to carry out analysis of applied to investigate and identify the
the production process so that they can make underlying distribution of the variable being
continuous improvements to the process. Flow explored (Omachonu and Ross, 2004; Forbes
chart is a tool used to perform Process Planning, and Ahmed, 2011).
Process Analysis and Process Documentation as
standard Production Guidelines. The following
are standard shapes or symbols that are often
found in Flow charts:
Figure 3 histogram
Histograms can show what the normal
distribution is for a process that is running
Figure 2 flow chart symbol
smoothly. However, by routinely producing
Source : conceptdraw.com
histograms, any variation is quickly detected.
This is a major advantage for organizations
3. Check sheets,
because it supports finding and dealing with
The check sheet is one of the simplest of
process variation quickly. In Six Sigma, it is
basic quality tools. Here, use it to collect data. IT
used to find variation in a process. A bar chart is
is used for collecting and analyzing data in real
used to show, for example, where delays are
time at the location where the data is generated.
occurring by finding the frequency of delays in
Data Collection is staring point of useful process
each step of the process. Using the data, project
improvement and problem-solving tools. A
checksheet is also called a tally sheet.
12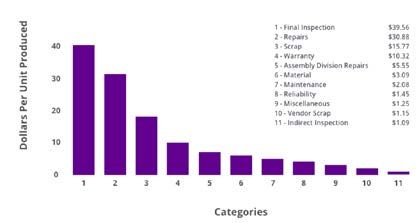
UNIVERSITAS TRIDHARMA                                                       MECHA JURNAL TEKNIK MESIN
                                                                                   VOL. 3 NO. 2 APRIL 2021
                                                                         E-ISSN: 2656-9906, P-ISSN: 2656-9434

leaders can then find the best ways to reduce                  A control chart (also known as a
variation.                                            Shewhart chart) is a graph used to study how a
                                                      system or process changes over time. Data is
5. Pareto Charts,                                     plotted in time order. Control chart always has a
         Pareto analysis uses the pareto principle,   mean as the centre line, an upper control limit
also called the 80:20 rule, to analyze and display    and a lower control limit which show where we
data. Quality expert J.M Juran applied the            would expect future data.
principle to quality control. And found that 80                The centre line, upper control limit and
percent of problems stem from 20 percent of the       lower control limit help us when interpreting the
possible causes. The numbers 80 and 20 are not        variation that exists in the process. By
meant to be absolutes. The main point as Juran        comparing current data to these lines, it can
stated is that we should focus on the vital few       identify whether the process is stable and
problems (those in 20 percent category) rather        predictable (common cause variation) or
than on the trival many to make the most              unstable and needs investigation (special cause
significant improvements in product quality.          variation). A control chart we can know how
         A pareto chart are a graphical tool used     monitor process performance, prediction the
in Pareto analysis, it is a bar chart that displays   process performance in the future, find out the
the relative importance of problems in a format       improvement and monitor sustainability of
that is very easy to interpret. Some of the           improvements.
problems for examples are like measurement,
frequency, etc. is represented by the tallest bar,    Out of Control
the next most important problem is represented                 Beyond Control Limit Indicates Lack of
by the next tallest bar and so on. When you look      Control for Process. Control charts can show
at a Pareto Chart, you can see break points in the    problems with processes when a identifiable
heights of the bars which indicate the most           cause exists in the system. A process with a
important categories. This information is useful      identifiable cause is said to be "out of control".
when you are establishing priorities.                 Some of the data points for the control chart will
                                                      be outside the control limits. In other words, if
                                                      any measurement or test data is outside the
                                                      control limits, it will be known that something is
                                                      wrong in the process. Obviously, this is the time
                                                      to take corrective action.

Figure 4 Diagram Pareto
Source : Juran.com

6. Control Charts or Shewhart Chart,
         Walter Shewhart in 1924 designed a
chart to indicate whether or not the observed
                                                      Figure 5 Control Chart
variations in the percent of defective apparatus
of a given type are significant; that is, to
                                                      7. Scatter Diagrams.
indicate whether or not the product is
                                                              A scatter diagram — also known as a
satisfactory”. This was the first control chart,
                                                      “scatter plot” — is a graphic representation of
and it has been the basis of statistical quality
                                                      the relationship between two variables. Teams
control ever since. The data obtained regularly
                                                      use scatter diagrams to help them identify cause-
from the QC materials are, in general,evaluated
                                                      and-effect relationships between two variables.
by control charts.
                                                      For example, after brainstorming multiple causes
                                                      and effects using a fishbone (cause and effect)

                                                                                                                13
UNIVERSITAS TRIDHARMA MECHA JURNAL TEKNIK MESIN
VOL. 3 NO. 2 APRIL 2021
E-ISSN: 2656-9906, P-ISSN: 2656-9434
diagram, your team might use a scatter diagram 3. Using a check sheet is appropriate when the
to determine whether a particular cause and data can be observed and collected
effect are related. repeatedly by either the same person or the
A scatter diagram graphs one variable same location. Cheek sheet is an effective
on the X-axis and the other variable on the Y- tool when collecting data on frequency and
axis. If the two variables are related, the data identifying patterns of events, problems,
points will fall along a diagonal line or curve — defects, and defect location, and for
that is, values for variable X will be associated identifying defect causes.
with values for variable Y. This could show 4. Histogram is show the shape and
either a positive correlation (values for both distribution of your data. The greatest
variables increase or decrease) or a negative benefit that comes with their use is the
correlation (values for one variable increase ability to monitor basic information about
while those for the other decrease). the dataset, such as the median value, the
width of spread and the overall distribution.
5. Pareto diagram analysis can help improve
the efficiency, profitability, and
effectiveness of company performance.
which can optimize the performance of the
organization as a whole.
6. A Control Chart also helps in checking the
process stability and verifying whether the
process is stable enough to improve and
make necessary improvements in the process
Figure 6 Scatter Diagram wherever required.
7. The purposes of using a Scatter Diagram,
which is to show the correlation exists
CONCLUSION between two sets of data.
Seven tools method are carried out as
quality control aims to improve the quality of REFERENCE
processes and products so it can be can be more
effective and more efficient, to reach customers Manfred Reichenba¨cher l Ju¨rgen W. Einax
satisfaction with good quality and increase ,Challenges in Analytical Quality
profits for the company. The seven tools will Assurance,springer, 2011. Chapter 8
help the company or organization to solve their
problems as the way of solution. Piotr Konieczka and Jacek Namie´snik “Quality
1. We use cause and effect or fishbone diagram Assurance and Quality Control in the
to see and analyze the cause of the matter Analytical Chemical Laboratory: A
problems. This can help you search for root Practical Approach, Taylor & Francis
causes, identify areas where there may be Group, 20009. Chapter 1.9
problems, and compare the relative
importance of different causes. W. Funk, V. Dammann, G. Donnevert, Quality
2. With the help of flowchart, problem can be Assurance in Analytical Chemistry:
analysed in more effective way therefore Applications in Environmental, Food,
reducing cost and wastage of time. The and Materials Analysis, Biotechnology,
diagrams themselves can improve and Medical Engineering”, John Wily,
communication of processes and workflows, 2007. Chapter 2.6.7
especially when an existing process is being
updated or refined. For instance, Montgomery, D. C. (1990). Pengantar
manufacturing employees can follow a Pengendalian Kualitas dan Statistik.
flowchart while setting up machines.
14UNIVERSITAS TRIDHARMA MECHA JURNAL TEKNIK MESIN
VOL. 3 NO. 2 APRIL 2021
E-ISSN: 2656-9906, P-ISSN: 2656-9434
Gajah Mada University Press,
Yogyakarta.
Heizer, J., & Render, B. (2011). Operation
Management (10th edition). Upper
Saddle River, N.J : Prentice Hall
Besterfield, D. H. (2003). Total quality
management (3rd edition). New York:
Pearson Education Inc.
Neyestani. B, (2017), Seven Basic Tools of
Quality Control: The Appropriate
Techniques for Solving Quality
Problems in the Organizations.
https://doi.org/10.5281/zenodo.40083
2
15You can also read