Ground-Motion Data from Seismicity Induced in the Southern Montney Formation, Northeastern British Columbia - Geoscience BC
←
→
Page content transcription
If your browser does not render page correctly, please read the page content below
Ground-Motion Data from Seismicity Induced in the Southern Montney Formation,
                       Northeastern British Columbia
A.M.M. Bustin, The University of British Columbia, Vancouver, BC, abustin@eos.ubc.ca
E.O. Munson, The University of British Columbia, Vancouver, BC
D.J. Jones, The University of British Columbia, Vancouver, BC
G.R.L. Chalmers, The University of British Columbia, Vancouver, BC

Bustin, A.M.M., Munson, E.O., Jones, D.J. and Chalmers, G.R.L. (2019): Ground-motion data from seismicity induced in the southern
Montney Formation, northeastern British Columbia; in Geoscience BC Summary of Activities 2018: Energy and Water, Geoscience BC,
Report 2019-2, p. 55–62.

                        Introduction                                    stations was upgraded to include a three-component (3C),
                                                                        4.5 Hz geophone. This paired station was recently de-
The limited availability of data to researchers is arguably
                                                                        ployed to a seismically active area, where it is co-located
the greatest challenge to advancement of the understanding
                                                                        with a long-term station and two temporary stations. The
of induced seismicity in Western Canada and hence to the
                                                                        four accelerometers were installed at different depths (30,
development of proactive mitigation schemes and frame-
                                                                        60, 90 and 120 cm) in order to test the impact of burial depth
works for hazard assessment. To address the data gap, a 15-
                                                                        on the response spectra. Additional ongoing work includes
station array is being developed to densely monitor hydrau-
                                                                        the addition of algorithms to the online portal for real-time
lic-fracturing operations in the Montney Formation. The
                                                                        calculation of hypocentres and magnitudes. Following test-
pre-existing accelerographs, which are now providing real-
                                                                        ing of the paired station, geophones will be added to the
time data to an online interactive platform, were deployed
                                                                        other stations and the entire array will be deployed to
to monitor two disposal wells and four hydraulic-fracturing
                                                                        densely monitor hydraulic-fracturing operations on three to
operations in the past year. Although no events have yet
                                                                        five multilateral wellpads. The datasets will then be inte-
been detected after 1.5 years by the station installed to mon-
                                                                        grated into three-dimensional (3-D) hydro-geomechanical
itor a disposal in a seismically inactive area, 12 events were
                                                                        models to address the study’s objectives, summarized by
recorded on the four-station array installed to monitor a dis-
                                                                        Bustin and Longobardi (2017).
posal in an active area. Single stations were deployed with-
in 3 km of the four completions, three of which were in seis-
mically active areas. No events were detected on the                                         Station Design
smallest of the three operations, while four and six events             The design for this low-cost, mobile, easy-to-install station
were recorded during the two larger operations. In total, 25            was modified from the early earthquake detectors devel-
events were recorded during the deployments, with site-                 oped by the Earthquake Engineering Research Facility
corrected, peak ground accelerations (PGAs) ranging from                (EERF) at The University of British Columbia and installed
0.027%g to 0.23%g. The real-time ground-motion parame-                  in BC schools for the Earthquake Early Warning System
ters are calculated for the geometric mean of the horizontal            (Azpiri, 2016). The units are powered by a solar panel with
components, which are then corrected to a reference site us-            an absorbent glass mat (AGM) deep-cycle battery. For
ing correction factors calculated during post-processing.               long-term and distant stations, two solar panels and three
For events located by the NRCan network or the local oper-              batteries were used for backup. Advanced RISC (reduced
ator-deployed array, the corrected PGAs were plotted ver-               instruction set computer) machine (ARM) processors run-
sus hypocentral distances. A good fit between the data and              ning Linux, which are stored within protective (weather-
the prediction models was demonstrated by Babaie Mahani                 and animal-proof) cases, run the system, while the data are
and Kao (2017). The dataset was also used to confirm the                stored on ultra–high-capacity USB drives. The protective
completeness threshold.                                                 case also encloses a global positioning system (GPS) for
In order to detect smaller events and to facilitate locating            timing and station location. Telemetry is currently provided
events and calculating magnitudes in real time, one of the              by cellphone modems with antennas and, in some cases,
                                                                        machine-to-machine (M2M) cellphone boosters to im-
                                                                        prove the signal. Satellite M2M systems are currently being
                                                                        investigated to provide telemetry in more remote locations.
This publication is also available, free of charge, as colour digital
files in Adobe Acrobat® PDF format from the Geoscience BC web-          The solar panels are mounted on an aluminum frame that
site: http://www.geosciencebc.com/s/SummaryofActivities.asp.            was designed in house, which has recently been upgraded

Geoscience BC Report 2019-2                                                                                                        55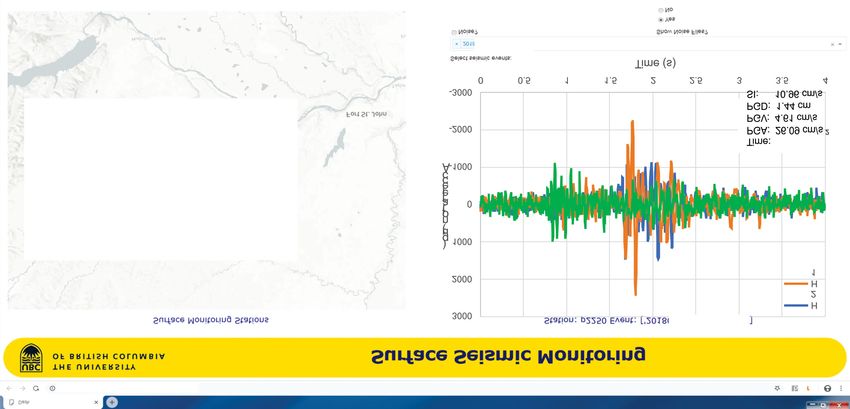
to include a raised, covered shelf to enclose the protective Dataset
case and batteries off the ground.
During the past year, the accelerographs were deployed to
The commercial, 3C, microelectromechanical systems monitor two disposal wells, one in an active area of induced
(MEMS) accelerometers are enclosed in sealed tubes, 50– seismicity, and four hydraulic-fracturing completions,
80 cm in length and 7.5 cm in diameter, that are buried be- three of which were in an active area of induced seismicity.
neath surficial alluvium with a shovel to depths of 30– While a four-station array was deployed to monitor the dis-
120 cm. To improve the detection, location and magnitude posal in the active area, single-station deployments were
calculation of events, the stations are being augmented with used to monitor the other operations. In addition to sites ob-
commercial, 3C, 4.5 Hz geophones. The geophones are tained through operator agreements, stations are also cur-
shallowly buried in conical, 15 cm long enclosures. The rently deployed at research sites and on a private ranch.
first of these paired stations was recently deployed for test-
ing.
Although no events have yet been detected after 1.5 years
by the station installed to monitor the disposal in a seismi-
The raw data are collected and stored at 250 Hz for the ac- cally inactive area, 12 events were recorded by the four-sta-
celerometers and 500 Hz for the geophones. When a tion array during its 6 months of operation. One event was
ground motion is recorded above a set threshold, an alert is recorded on three stations and three events were recorded
emailed and the data are transferred to the online, interac- on two stations. The event recorded by three stations in the
tive platform (dashboard). The platform can then be used to array was the largest magnitude event reported by Natural
plot the accelerations and calculate the ground-motion pa- Resources Canada (NRCan) from the Canadian National
rameters for the event. The raw data are first run through a Seismograph Network (CNSN) stations during the deploy-
0.1 Hz, high-pass, 4th order, Butterworth filter. The maxi- ment. The three events detected on two stations and five
mum amplitude for the peak ground acceleration (PGA) is events detected by single stations were not reported by
then determined for the vertical component and the geo- NRCan, while three other events detected by single stations
metric mean of the horizontal components. The filtered ac- were reported by NRCan. Two events reported by NRCan
celeration data are integrated to velocities, which are then were missed by the four-station array (discussed further in
further integrated to displacements. The peak ground ve- the ‘Magnitude of Completeness’ section). All events re-
locity (PGV) and peak ground displacement (PGD) are corded by both the study’s array and the NRCan network
then determined for the vertical component and the geo- have magnitudes between 2 and 3, and hypocentral distan-
metric mean of the horizontal components. Additionally, ces between 10 and 14 km.
the spectral intensity (SI), which provides a measure of the
damage potential to structures by events, is calculated ac-
cording to Rosenberger (unpublished report, 2010). The No events were detected during the first hydraulic-fractur-
study defines SI as the maximum velocity of two, 20% ing operation monitored this year, which was the smallest
dampened, single-degree-of-freedom systems with reso- of the three operations in the seismically active area. The
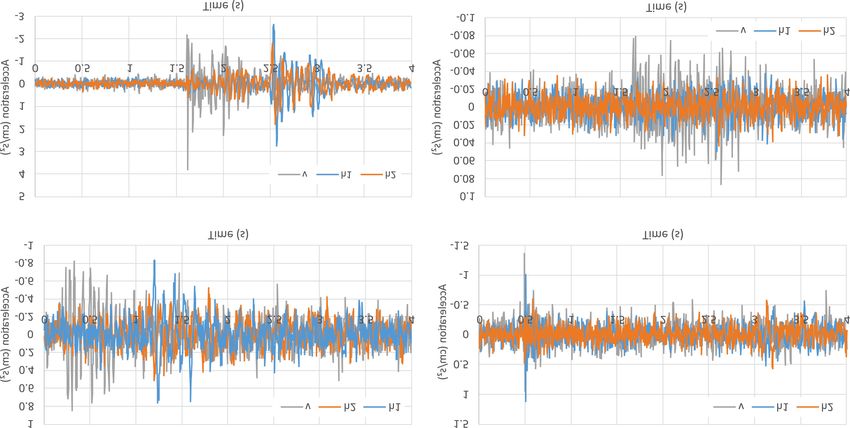
nant frequencies of 1.5 s and 2.5 s. An example of an event station was deployed for two months following the comple-
recorded by one of the stations, displayed on the dashboard, tions, in which time eight events with Mw > 1.5 were re-
is shown in Figure 1. Additional algorithms are currently corded on the local, operator-deployed (local) array in the
being developed for real-time calculation of magnitudes, area. The two largest events were recorded by the study’s
hypocentres and shake maps. station, the largest of which was also reported by NRCan.
During pre-completion monitoring, the two events were
also detected by the station that was deployed for the sec-
A simple amplitude threshold is being used for event detec- ond operation. Five out of the six Mw > 1.5 events and one
tion. More sophisticated autodetection techniques were in- event with Mw < 1.5 recorded by the local array during the
vestigated (for a summary, see Li et al., 2018); however, the second completion were detected by the study’s station.
heavy contamination of the recordings at all stations from One of the five events with Mw > 1.5 recorded on the local
large-amplitude animal and anthropogenic noise makes array during the third operation was not detectable above
auto-discrimination of seismic events difficult. In particu- the digital noise.
lar, seismic events recorded on single stations are difficult
to discriminate from noise when the amplitudes are close to
the digital noise (0.2 cm/s2 for geometric mean of the hori- In total, 25 events were recorded during the deployments,
zontal components and 0.4 cm/s2 for the vertical compo- with pre–site-corrected PGAs (for geometric mean of hori-
nent). During dense deployments, a stacked local similarity zontal components) ranging from 0.035%g to 0.29%g. Ex-
function will be used for real-time discrimination of amples of typical 3-axis acceleration data for events re-
seismic events to ensure detection of smaller events. corded by the study’s stations are shown in Figure 2.
56 Geoscience BC Summary of Activities 2018: Energy and Water
Geoscience BC Report 2019-2
                              Figure 1. Example of typical 3-axis acceleration data recorded for a seismic event by one of the study’s stations, as displayed on the online, interactive dashboard. Event time and station loca-
                              tion have been removed for confidentiality.

57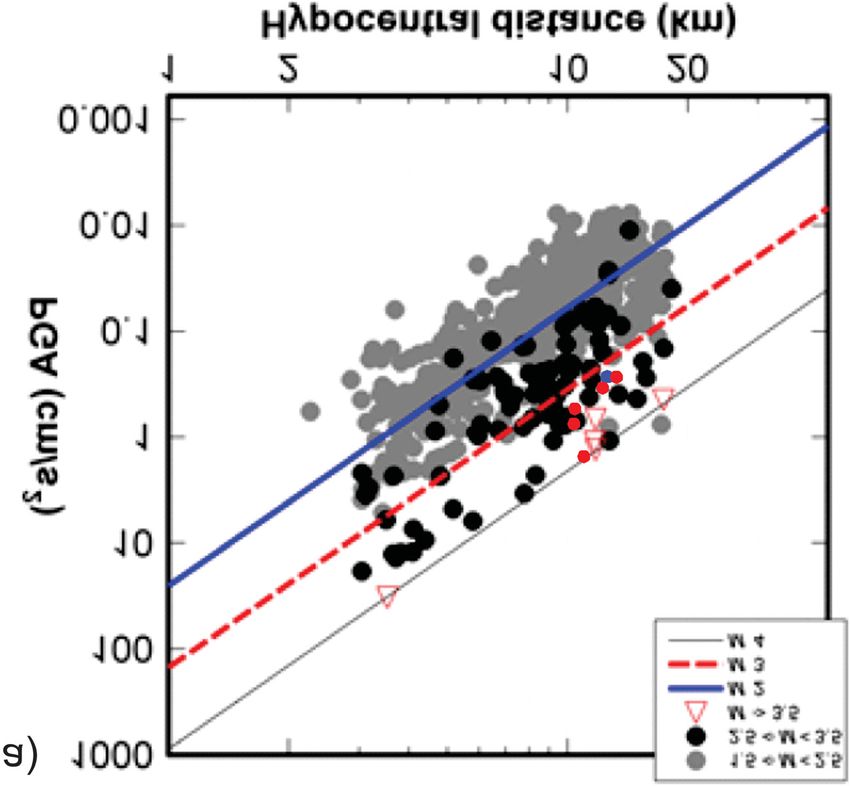
58
                                                             Figure 2. Examples of 3-axis acceleration data recorded for seismic events by the study’s stations.

Geoscience BC Summary of Activities 2018: Energy and Water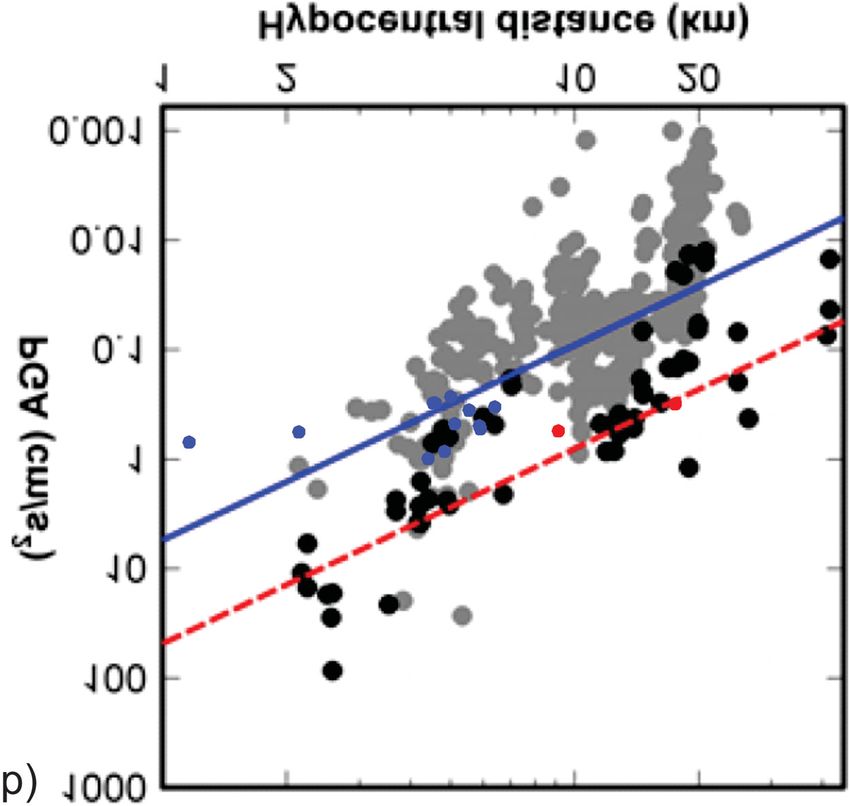
Site Corrections                                   The results, which are plotted in Figure 4, show that the
                                                                        datasets are consistent; however, the predictive model for
The measured PGAs were corrected for each event to a ref-               area (a) slightly underestimates the study’s data.
erence site-class with a time-averaged shear-wave velocity
over the top 30 m (Vs30) of 760 m/s using the amplification                         Magnitude of Completeness
factors from Seyhan and Stewart (2014). In the first step,
the response spectral acceleration (PSA) was calculated at              To investigate the magnitude of completeness for the sen-
frequencies of 0.1–100 Hz for the geometric mean of the                 sors, the magnitude was plotted versus hypocentral dis-
horizontal components and the vertical component. The                   tance in Figure 5 for events that were detected by one or
spectral ratio of the horizontal to vertical components (H/             more of the study’s stations (blue) and events that were not
V) was then calculated for each event, following which the              detected (red). The results indicate that M > 1.5 events are
H/V ratios were log-averaged for each station. The H/V                  consistently detected within 5 km and M > 2 events within
spectral ratios calculated for the study’s stations are shown           10 km of one of the stations. It is not possible to comment
in Figure 3. The fundamental frequency (fpeak) was then de-             on the detection threshold for events with M < 1.5 because
fined as the frequency at the peak H/V amplitude. Using the             many smaller events are currently being missed by the sim-
correlation of Hassani and Atkinson (2016), Vs30 values                 ple amplitude threshold and single-station deployments.
were estimated from fpeak for each station with recorded                Three events stand out on Figure 5: one M ≈ 1.5 event with
events. The class for each site could then be determined                hypocentral distance of
Table 2. Site-corrected PGA for each seismic
event recorded by the study’s stations, as
well as event magnitude and hypocentral
distance when available.
Depth of Burial
To investigate any possible effects that depth of burial of
the study’s sensors might have on recorded ground mo- Figure 4. Site-corrected PGA versus hypocentral distance for seis-
mic events recorded by the study’s array, with events of
tions, four sensors were installed very recently at different 2.5 < M < 3.5 plotted as red dots (a) and those of 1.5 < M < 2.5 plot-
depths (30, 60, 90 and 120 cm) at a single site in a seismi- ted as blue dots (b) on figures from Babaie Mahani and Kao (2017).
cally active area. The 90 cm station is the new paired sta-
tion, while the 60 cm station is a long-term station already
located at the site. The sensors are a maximum of 5 m apart, to monitor two disposal wells and four hydraulic-fracturing
with the 30 and 90 cm sensors and the 60 and 120 cm sen- operations in the past year. Twenty-five events were re-
sors being within 1 m of each other. While waiting for an corded during the deployments, with site-corrected PGAs
event, a test was performed in which a steel I-beam was for the geometric mean of the horizontal components rang-
struck several times with a sledgehammer at a distance of ing from 0.027%g to 0.23%g. These values are consistent
~15 m from the stations. Due to the short distance between with the data and prediction models previously presented
the tests and the stations, the difference in amplitudes (pre- for the Montney Formation. The study’s first paired station
sented in Table 3 for a typical test) results from the varying with both a 3C accelerometer and a 3C geophone was re-
source-receiver distance and not the depth of burial. cently deployed for testing, and algorithms are being devel-
oped for use with the dashboard to locate events and calcu-
Summary
late magnitudes in real time. Additional ongoing work
The study’s accelerographs, which are now providing real- includes a study testing the impact of sensor burial depth on
time data to an online interactive dashboard, were deployed recorded ground motions.
60 Geoscience BC Summary of Activities 2018: Energy and WaterFigure 5. Magnitude versus hypocentral distance for events that were detected by one or
more of the study’s stations (blue) and events that were not detected (red).
Table 3. Comparison of PGA Babaie Mahani, A. and Kao, H. (2017). Ground motion from M1.5
(PGAh, geometric mean of hori- to 3.8 induced earthquakes at hypocentral distance62 Geoscience BC Summary of Activities 2018: Energy and Water
You can also read