INVESTORPRESENTATION Q32019 - cloudfront.net

Page created by Ann Malone
 
CONTINUE READING
INVESTORPRESENTATION Q32019 - cloudfront.net
INVESTOR PRESENTATION   Q3 2019
INVESTORPRESENTATION Q32019 - cloudfront.net
2
INVESTORPRESENTATION Q32019 - cloudfront.net
COMPANY OVERVIEW

3
INVESTORPRESENTATION Q32019 - cloudfront.net
Return to Shareholders
                                                                               • ~3.7% yield
                                                        • ~90% institutional ownership
                      5-Year Total Return (1)                                                                                Annual Dividend History (4)

                                                                                                                                                                                         $1.36

          36%                                    $674M                                                                                                             $1.16
                                                                                                                                                                                 $1.28

    Dividend increase                                       Cash                                                                                     $1.08
     over last 5 years                                 dividends paid                                                                   $1.00

                                                                                                                          $0.84

                                                                                                            $0.72

      Increased annual dividend
    in each of the past four years
        amid peak capex cycles
                                                                                                          Nov. 2007 - Dec. 2010 - Aug. 2013 - Mar. 2016 - Mar. 2017 - Mar. 2018 - Mar. 2019 -
                                                                                                          Nov. 2010    July 2013   Feb. 2016  Feb. 2017   Feb. 2018   Feb. 2019    Current

     1)   As of 9/30/2019
4    2)   As reported in USD. The adoption of ASC 606 impacted how we record certain revenues. See Note 3 to our financial statements as included in our Form 10K filed Feb 28, 2019
     3)   CNK value increase due to stock price appreciation and dividends – does not assume dividend reinvestment
     4)   As expected. Based on paid date
INVESTORPRESENTATION Q32019 - cloudfront.net
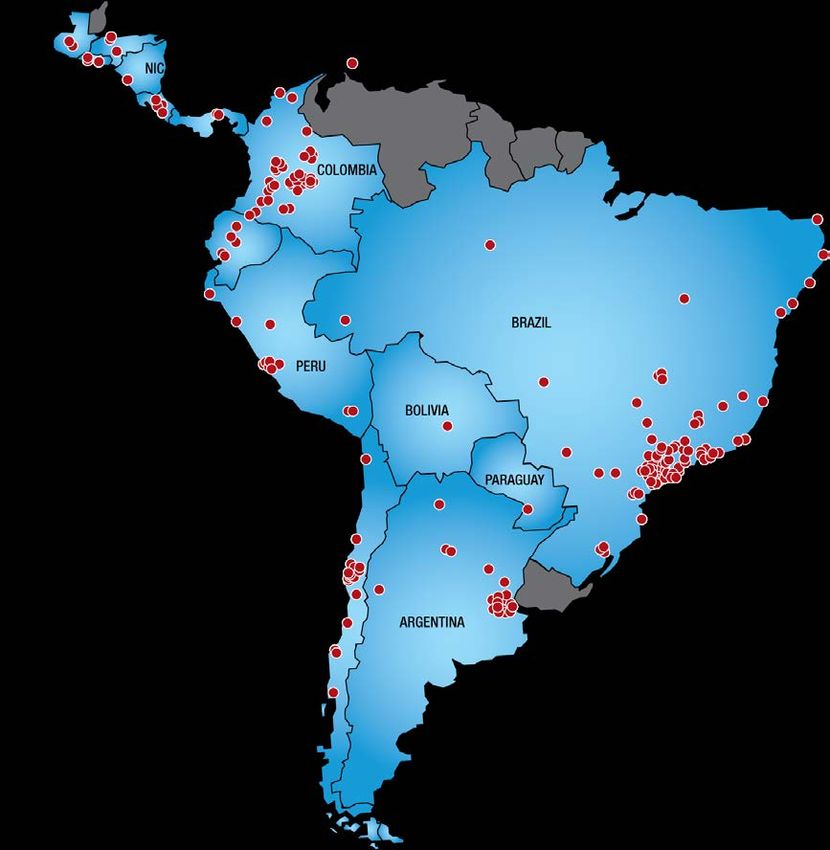
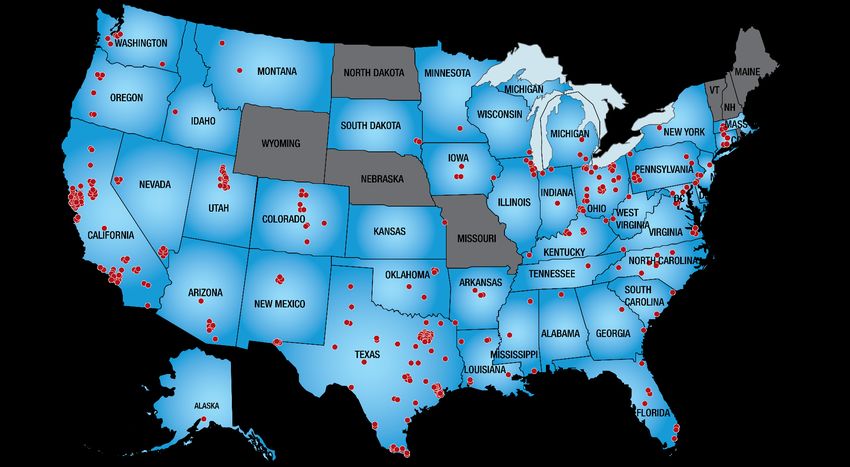
Cinemark Domestic Theatres

    41         States

    104               DMAs

    #1 or #2
     in ~80% of our
     top 25 markets

5
     1) Ranking based on box office revenues as of 12/31/18.
INVESTORPRESENTATION Q32019 - cloudfront.net
Cinemark International Theatres

      15
     Countries
                                            26
                                     Years operating
                                       experience

      14
of the top 20 largest
                                     ~30%
                                          Market share
metropolitan areas                           In key
 in South America                          countries

6    Ranking based on box office revenues as of 12/31/18
INVESTORPRESENTATION Q32019 - cloudfront.net
Broad and Leading Presence in the Americas
           Strong and expansive presence strategically important for film distribution and
                          to potential Pan-Regional promotional partners
                      Strong Americas Presence                                         Approximate Market Share 1
                                                                              Brazil
                                                                                                                             Cinemark
                                Years in
    As of 9/30/19               Country      Theatres   Screens   Rank (1)                  37%                  28%         Cinépolis
                                                                                                                             Kinoplex

                       USA              33     344       4,630      #3                                             14%       Araújo
                                                                                              5% 6%
                                                                                                            9%               UCI
                     Brazil             23      84        623       #1                                                       Other

               Argentina                22      22        190       #1
                                                                             Argentina                                       Cinemark
                      Chile             26      19        127       #2                            22%
                                                                                                                   33%       Village Cines

                                                                                           8%                                Nat'l Amusements
                Colombia                20      35        198       #2
                                                                                             10%                             Lumiere
                                                                                                                 15%
                       Peru             22      13        93        #2                               11%
                                                                                                                             Cinemacenter
                                                                                                                             Other
                 Ecuador                22      8         51        #3
                                                                               Chile                       3%
       Central America                  22      20        141
                                                                                                   17%                       Cinemark
                   Bolivia              5       1         13                                                           37%   Hoyts Chile
                 Curacao                4       1          6                                                                 Cineplanet
                                                                                                   43%
                                                                                                                             Other
                Paraguay                3       1         10

                                               548       6,082

7
       1) FY 2018 based on box office
INVESTORPRESENTATION Q32019 - cloudfront.net
Significant Latin American Screen Growth Potential

                                                                                                                          2018 Population &
                            Population per Screen
                                                                                                                           Screen Data 1, 3
      U.S. (2)              8.1
                                                                                                                                      Total
                                                                                                                     Population     Screens in    CNK
      U.K. (2)                        15.0                                                                           (Millions) 3    Country     Screens

      Mexico                             17.7                                                                          125.9          7,126        04

        Chile                                                           40.1                                            17.9           447        127
                                                                                              Screen Growth
                                                                                                 Potential              31.3           639         93
         Peru                                                                       49.0
                                                                                                 ~2x incremental
                                                                                                   screens in
    Argentina                                                                        50.2         underserved           44.7           890        190
                                                                                                countries to reach
                                                                                                  Mexico levels
    Colombia                                                               42.9                                         48.2          1,123       198

        Brazil                                                                                        62.6             208.8          3,338       623

       1) Screens source: Rentrak Data excludes Central American countries. CNK screens are as of 9/30/19.
       2) Sources: US & Canada (2018 MPAA). UK (2019 British Film Institute).
8      3) Population source: CIA World Factbook
       4) Sale of Mexico theatres closed 11/15/2013
INVESTORPRESENTATION Q32019 - cloudfront.net
Exhibition Industry Trends
                                        Stable, long-term industry growth trends across
                                         technology innovations and economic cycles
                                                       North America Industry Box Office Trends
                                                                                                                                                    Recliners and
     Recession year                                                                                                                                enhanced food
                                                                                                DVD player
                                                                                                                    Digital projector conversion    Investments ...
                                                                                               drops to$100
                                                                                              (DVD hey-day)
                                                                                                                                 Mass OTT streaming adoption ...
                                                                                                                    Financial
                                                                                           Exhibition                  crisis
                                                                                         bankruptcies/
                                                                                         consolidation
                                                                       Megaplex and
                                                                      stadium seating

                                                                Internet begins
                                                              to go mainstream

                   VHS begins
                     to ramp                                                              1.57B patrons
                  post beta-max
                                                                                                              1.38B patrons
                                                                                                                                         1.3B patrons

                                                                                                                                                            $11.9B
    $2.6B

                                    1.1B patrons
    1978

                            1983

                                                1988

                                                              1993

                                                                                  1998

                                                                                                  2003

                                                                                                                    2008

                                                                                                                                        2013

                                                                                                                                                            2018
                      VCR                                            Internet                    DVD                                   Streaming

9
            Sources: North America: Rentrak, NATO
INVESTORPRESENTATION Q32019 - cloudfront.net
Consistent Industry Outperformance

                     38 out of 43 quarters of North American industry out-performance
     2013 – 2018 Admission Revenue Growth (1)                                                                CNK WW Adjusted EBITDA Growth (1, 2)

            30.5%
               Worldwide C$

                                                                                                                                                                $924.2
                                        18.7%

                                                                                                                                                                Constant $
                                                                                                                          $639.0
                                           U.S.

                                                                     8.8%

                                                                      North                                                 2013                             2018
                                                                    American
                                                                    Industry                                                                               Constant $
     Source: MPAA and Public Filings.
     1) As of December 31, 2018. 8% WW growth in USD as reported. Constant currency is a non-GAAP measurement calculated using the average exchange rates for the
         corresponding months for 2013. We translate results of our international operating segment from local currencies into U.S. dollars using currency rates for respective
         reporting periods. Significant changes in foreign exchange rates from one period to the next can result in meaningful variations in reported results. We provide constant
10       currency amounts to compare performance without the impact of foreign currency fluctuations.
     2) Adjusted EBITDA has been presented including all cash distributions from equity investees for all year presented
2019 Film Slate
                 January 11       January 18          February 8         February 22         March 8        March 22

1Q
‘19

                  The Upside         Glass         The LEGO Movie 2    How to Train Your   Captain Marvel      Us
                                                                          Dragon 3

                   April 5         April 26            May 10              May 24             June 21       June 28

 2Q
 ‘19

                   Shazam!     Avengers: Endgame   Detective Pikachu       Aladdin           Toy Story 4    Yesterday

11     3D denoted in red
2019 Film Slate
                          July 5        July 19              July 26              August 2           August 16              September 6

3Q
‘19

                     Spider-Man:     The Lion King     Once Upon a Time in      Hobbs & Shaw        Angry Birds 2         IT Chapter Two
                    Far From Home                          Hollywood

                         October 4   November 15          November 22           November 22        December 13             December 20

4Q
‘19

                           Joker     Ford v. Ferrari   A Beautiful Day in the     Frozen 2     Jumanji: The Next Level   Star Wars: The Rise
12                                                        Neighborhood                                                      of Skywalker
     3D denoted in red
2020 Notable Film Titles

Q1     Universal      Warner Bros.             Fox                       Disney                     Sony                     Disney

Q2                                                                    Wonder
                                                                      Woman                                             “Top Gun”
     United Artist      Disney                   Universal            Warner Bros.             Disney                   Paramount

                          Ghostbuster
                              s

Q3                                                                                          “Spider-Man Universe”
                                                                                                                    UNTITLED SEQUEL

        Universal            Sony             Warner Bros.              Disney                      Sony                Warner Bros.

                                                                       Steven Spielberg’s

Q4             Sony                  Disney                  Disney              Fox            Universal               Warner Bros.
2021 Films Announced To-Date

                               Untitled

   3
STRATEGIC INITIATIVES

15
Strategic Initiatives

                             Primary Objectives:
     1) Further enhance in-theater quality, service and amenities
            2) Continue to expand food & beverage offerings
                 3) Increase guest interaction and engagement

    Luxury                         Enhanced food     Loyalty          Digital
                    XD premium                                       marketing
   Lounger                          & beverage     programs &
                    large format                                  transformation
recliner seats                        tactics      subscription

16
Luxury Lounger Recliner Seats

      3Q 2019:

     58%
      of U.S. circuit

     Est. YE 2019:

     ~60%
       of U.S. circuit

17
World’s #1 Exhibitor Premium Large Format Brand

                                                      4%
                                                   Worldwide Screens
                                                                                                   9%           (1)

                                                                                                 Worldwide Box Office

                 265                                                     75%             (2)
                                                                                                                      100%
                                                                                                                        THX Certified
                                                                                                                                        (3)

           Global XD Auditoriums                                       Feature Luxury Loungers

     1)   Data 3Q19
18   2)   75% of US auditoriums
     3)   Latin America certification in-process
Enhanced Food & Beverage Tactics

                          51
                                                                F&B Per Cap Growth

                                                                +67%                 $4.82

                 Consecutive Quarters
                 US Food & Beverage
                  per Patron Growth

                                                                       $3.44

                                  YE 2019:

                                ~75%
                                  Expanded F&B
                                                    $2.88

       YE 2019:

     ~50%
     Alcohol Activation                            2008                2013          2018

19
                                                 US F&B stats
Evolution of Loyalty Program

                                                                MEMBER BENEFITS                                     (1)
                                                                                                  FREE!   $8.99/month
          Even higher level of engagement
                                                                Earn 1 Point for Every $1 Spent               
                                                                Redeem Points for Tickets
                                                                and More Rewards
                                                                                                              
                                                                Member Access to Screenings
              Dollar-based point system                         & Advance Tickets
                                                                                                              

                                                                Free Birthday Reward                          
                                                                Free Large Popcorn &
                                                                Drink Refills
                                                                                                              
          Compelling benefits & rewards
                                                                Exclusive Member Offers                       

                                                                1 Ticket Per Month                             

            Simplified loyalty messaging                        20% off Concessions                            

                                                                Waived Online Fees                             

                                                                Unused Tickets Roll Over                       
               Personalized experiences                         Member Pricing for
                                                                Additional Tickets
                                                                                                               

20
     1)    Movie Club priced at $9.99/month in select markets
(1)

Program Highlights:
• One 2D ticket per month                                      • Add-on tickets at member pricing
• Unused credits roll over                                     • One companion ticket per transactio
• 20% concessions discount                                     • Upgrade to XD/3D/DBOX for upcharg
• Waived online fees                                           • Not a breakage model
• Ability to share member benefits                             • No long-term commitment

21

     1)   Movie Club priced at $9.99/month in select markets
Progress since December 5, 2017 launch…

                  850K                 29M                 ~15%
          Active members =         Cumulative tickets
                                                         of 3Q19 box office
        2400 members/theater       sold via Movie Club

                         3x            80%                     2x
         Member visits relative       Movie credits      Upgrade to XD than
           to non-members           redeemed to-date       non-members
22

     Information as of 11/5/2019
FINANCIALS

23
Capital Structure
                                                    Significant cash reserves
                          Ability to take advantage of growth opportunities as they arise

                                 $'s in millions                                    Sep. 30, 2019
                                 Long-term Debt, including current maturities:
                                  Senior Secured Credit Facility                     $    648.0
                                  4.875% Senior Notes due 2023                       $    755.0
                                  5.125% Senior Notes due 2022                       $    400.0
                                  Finance Lease Obligations                          $    141.8
                                  Other                                              $      1.4
                                  Total Debt                                         $ 1,946.2
                                  Cash and Cash Equivalents                          $   482.8
                                  Net Debt                                           $ 1,463.4

                                                No near-term debt maturities
                                                               Covenant-lite debt

24   Note: The Company has 98.8mm available on its revolver.
Solid Recent Results

1) As reported in USD. The adoption of ASC Topic 842, effective Jan 1, 2019, impacted how we record certain expenses. See Note 3 to our financial statements as included in our Form 10Q filed on November 5, 2019 ,in
addition to Form 8K filed May 7, 2019. Additionally, the adoption of ASC Topic 606, effective Jan 1, 2018, impacted how we record certain revenues. See Note 3 to our financial statements as included in our Form 10K
filed Feb 28, 2019.

Adjusted EBITDA represents net income before income taxes, interest expense, interest income, foreign currency exchange gain (loss), interest expense – NCM, equity in income of affiliates, loss on debt amendments
and refinancing, other cash distributions from equity investees, depreciation and amortization, impairment of long-lived assets, loss on disposal of assets and other, changes in deferred lease expense, non-cash rent
expenses, amortization of long-term prepaid rents and share based awards compensation expense, as calculated below. Adjusted EBITDA is a non-GAAP financial measure commonly used in our industry and should not
be construed as an alternative to net income as an indicator of operating performance or as an alternative to cash flow provided by operating activities as a measure of liquidity (as determined in accordance with
GAAP). Adjusted EBITDA may not be comparable to similarly titled measures reported by other companies. We have included Adjusted EBITDA because we believe it provides management and investors with additional
information to measure our performance and liquidity, estimate our value and evaluate our ability to service debt. In addition, we use Adjusted EBITDA for incentive compensation purposes. See reconciliation of net
income, the most directly comparable GAAP measure, to Adjusted EBITDA in the 10Q filed on November 5, 2019 or at investors.cinemark.com.

2) Adjusted EBITDA margin is calculated by dividing Adjusted EBITDA by Worldwide Revenues

   25
Thank You
                  Contact:
        Chanda Brashears
     VP Investor Relations
cbrashears@cinemark.com
            (972) 665-1671
You can also read