OLED Investor Presentation - 4Q 2020 (updated: November 2020) UNIVERSAL DISPLAY CORPORATION 2020 ALL RIGHTS RESERVED
←
→
Page content transcription
If your browser does not render page correctly, please read the page content below
OLED
                        Investor
                    Presentation
                                   4Q 2020
                          (updated: November 2020)

© UNIVERSAL DISPLAY CORPORATION 2020 ALL RIGHTS RESERVED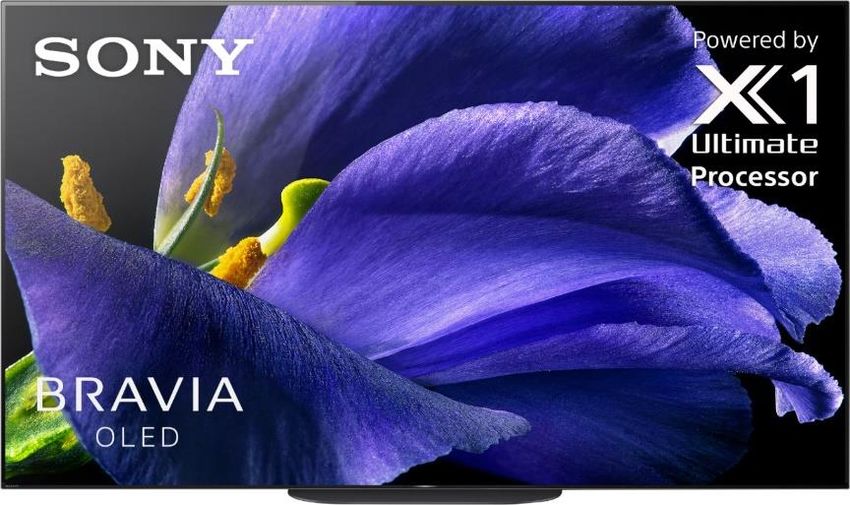
All statements in this document that are not historical, such as those relating
             to the impact of the COVID-19 pandemic on the Company and otherwise, the
             Company’s technologies and potential applications of those technologies, the
             Company’s expected results and future declaration of dividends, as well as
             the growth of the OLED market and the Company’s opportunities in that
             market, are forward-looking financial statements within the meaning of the
             Private Securities Litigation Reform Act of 1995. You are cautioned not to
Forward-     place undue reliance on any forward-looking statements in this document, as
             they reflect Universal Display Corporation’s current views with respect to
Looking      future events and are subject to risks and uncertainties that could cause
Statements   actual results to differ materially from those contemplated. These risks and
             uncertainties are discussed in greater detail in Universal Display
             Corporation’s periodic reports on Form 10-K and Form 10-Q filed with the
             Securities and Exchange Commission, including, in particular, the sections
             entitled “Risk Factors” in Universal Display Corporation’s Annual Report on
             Form 10-K for the year ended December 31, 2019 and subsequent Quarterly
             Reports on Form 10-Q. Universal Display Corporation disclaims any obligation
             to update any forward-looking statement contained in this document.
                                                                                               2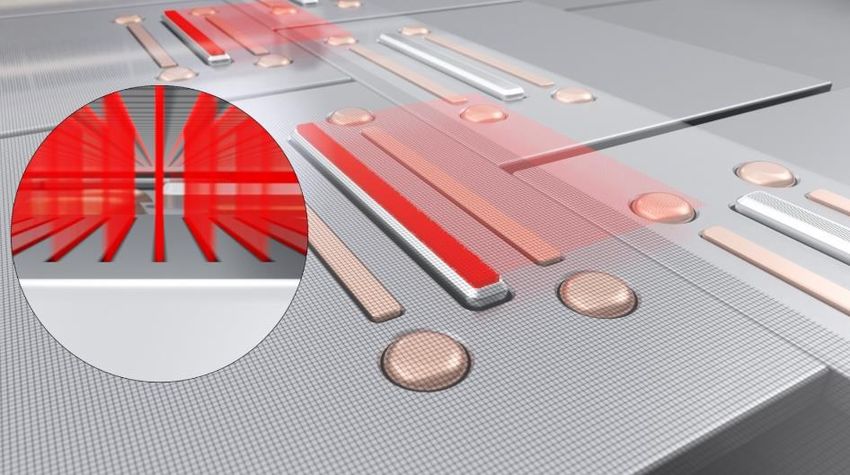
Universal Display Corporation

                                 Highly
Critical OLED                   Energy-
 Innovator &                    Efficient
   Enabler                      PHOLED                                       Fabless

                    OLED
                                                       5,000+
                  Materials
                                                        Global
                Supplier & IP
                                                       Patents*
                  Licensor

                                            * Pending and Issued Patents Worldwide as of February 17, 2020   3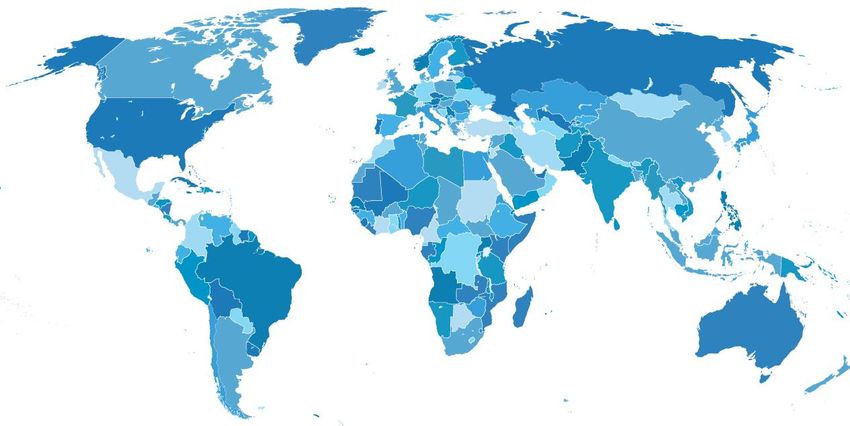
What is an OLED?
➢   An Organic Light Emitting Diode is a series of organic thin films between two
    conductors
➢   When electrical current is applied, bright light is emitted
➢   OLEDs can be used for displays and lighting
➢   OLEDs are not just thin and efficient - they can also be made flexible and transparent

                                                                                    30-40nm

                                            Note: For illustrative purposes only.             4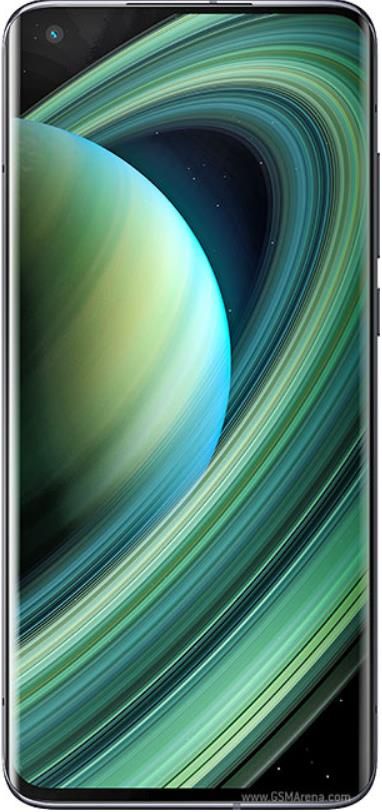
Business Model
                   OLED       Innovation &
  Revenues
                  Enabler       Invention

  License         Patent        Device &
     &           Licensing    Architecture
  Royalty                          IP
    Fees

                  PHOLED      Composition
  Material
                 Emitters &   of Matter IP
   Sales
                   Hosts

                                             5
OLED Display Market Potential
                                                  Mobile          TV   IT/Wearables    Other
                 $50.0

                                                                                                       $45.8
                                                                                               $43.6
                 $40.0                                                                $40.0
                                                                         $35.6

                                                          $30.3
    $ BILLIONS

                 $30.0                                                                                 765M*
                                        $25.2                                                  725M*
                         $23.6
                                                                                      669M*
                 $20.0
                                                                         594M*

                 $10.0                  471M*             475M*
                         408M*

                  $0.0
                         2018            2019              2020          2021         2022     2023    2024
*Unit Numbers are for mobile phones only
Source: Omdia OLED Display Market Tracker – Q2 2020 (October 2020)
                                                                                                               6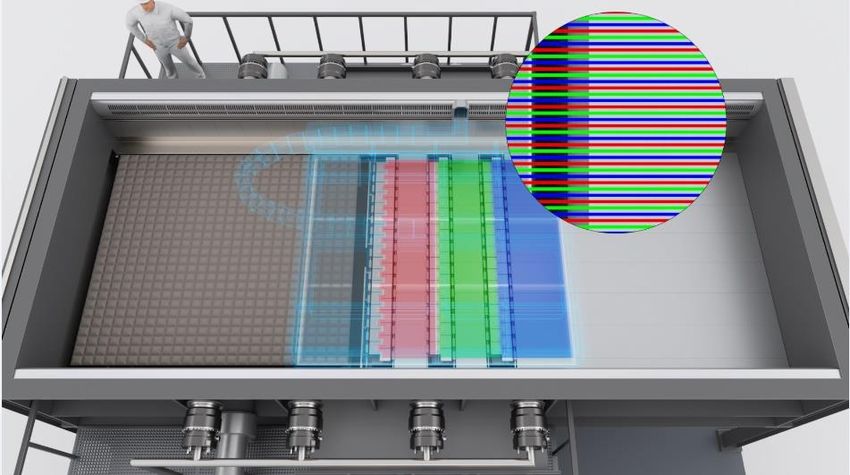
OLED Panel Area Demand
                                                     Mobile    TV     IT/Wearables   Other
                                20.0
                                                                                                       19.1

                                                                                               16.6    9.6M*
                                                                                        14.9
    MILLIONS OF SQUARE METERS

                                15.0
                                                                            13.0               8.0M*

                                                                                       7.3M*
                                                              10.1
                                10.0                                        6.5M*
                                               8.2
                                        6.7
                                                              4.9M*
                                               3.3M*
                                 5.0   3.0M*

                                 0.0
                                       2018    2019            2020         2021        2022   2023    2024
*Unit Numbers are for OLED TVs only
Source: Omdia OLED Display Market Tracker – Q2 2020 (October 2020)
                                                                                                               7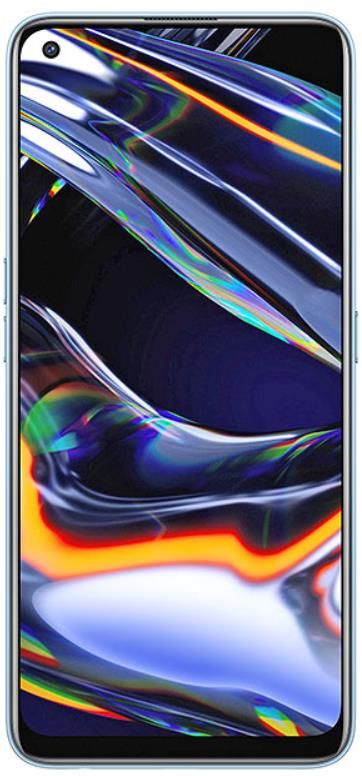
Strong OLED Display Market Drivers

                    • RED Phosphorescence                          • Improved image                                 • Fewer manufacturing

                                                                                              More Cost Effective
                                             Superior Aesthetics
                      reduces power                                                                                   process steps
Lower Power Usage

                                                                     quality
                      consumption by 25%                                                                            • Lower bill-of-
                                                                   • Thin and Light
                    • Add GREEN: 45%                                                                                  materials
                                                                   • 180 degree viewing
                      cumulative reduction                                                                           • No backlight
                                                                     angle
                    • Add BLUE: 75%                                                                                    required
                                                                   • 2,000,000+: 1
                      cumulative reduction                                                                           • No color filter
                                                                     contrast ratio – TRUE
                    • Enabled by PHOLEDs                             BLACK                                             required
                                                                   • Real-time video                                 • No liquid crystal
                                                                     speeds – excellent for                            required
                                                                     3D                                              • Reduced driver IC
                                                                   • Self-emissive display                             costs
                                                                   • Low UV output                                  • Enables non-glass
                                                                                                                      substrates
                                                                   • Minimal Bezel
                                                                   • Flexible

                                                                                                                                            8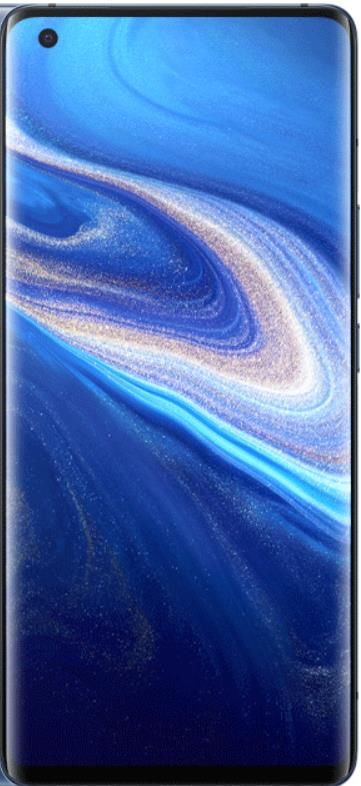
New OLED Smartphones

                                                                      Huawei Mate 40 Pro       iPhone 12          Samsung Galaxy
ZTE nubia Red Magic 5S TCL 10 Pro        Meizu 17    Xiaomi Mi 10 Ultra                                           Note20 Ultra 5G

         LG WING™ 5G                vivo X51 5G     Oppo Reno4 Pro   Honor 30     Google Pixel 5   Realme 7 Pro   OnePlus 8T
                                                                                                                                9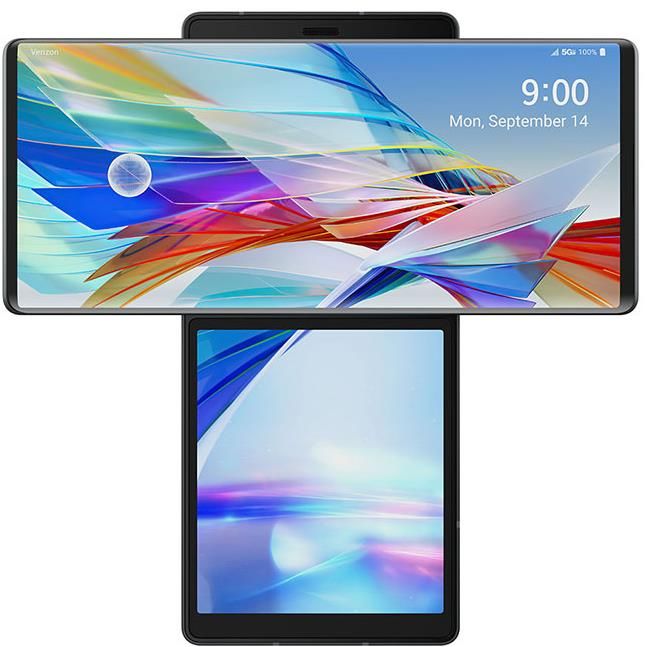
More OLED Products
Samsung Lenovo Tab
Galaxy P11 Pro
Tab S7+
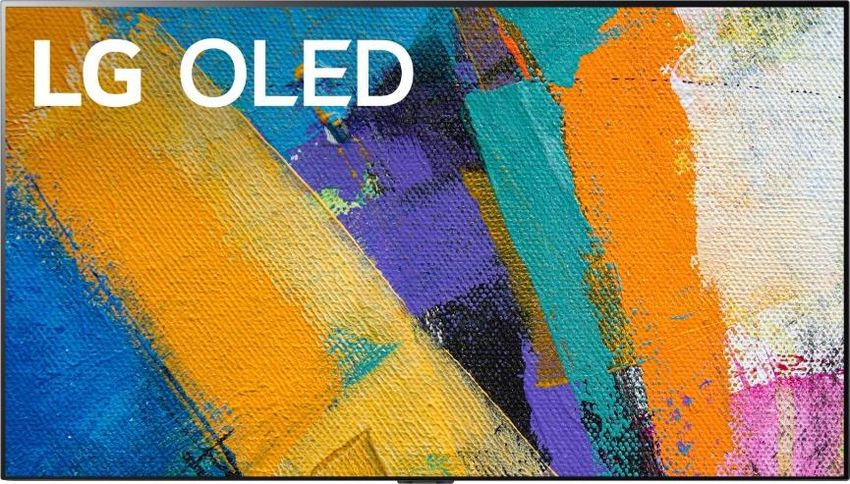
HP ENVY 15 Laptop LG 65" Class GX Series OLED 4K UHD
Sony 65" A9G MASTER Series OLED 4K UHD
2021 Cadillac Escalade Oculus Quest All-In-One VR
Samsung Galaxy Watch 3 Huawei Watch GT 2e
LG Watch Style
Apple Watch Series 6 10LCD vs. OLED
TFT+OLED+Refiner
Diffuser Polarized Polarized
Sheet Film Film
Cell
TFT
Backlight
Unit
Polarized
Film
Color
Prism
Filter
✓ Lower BOM (bill of materials)
✓ Better Performance, More Efficient
✓ Thinner and Flexible Form Factor
✓ Vivid Colors and Superior Contrast Ratio
Image source: LG
11Strong OLED Lighting Market Drivers
Image source: LG Display
• Low drive voltage • Wide range of CCT, • Thin and lightweight
Highly desirable color quality
Novel form factor & Low
• Low operating high CRI possible • Transparent
environmentally friendly
temperatures, • Color tunable • Non-breakable,
Energy-efficient &
Cost Potential
cool to touch • Instant “ON” , Conformable, Flexible,
• Long lifetime Dimmable without Foldable, Rollable
• Easy to control flicker
• No glare, no noise • Scaling advantage
• Low UV content • Roll to roll process
12OLED Lighting Around the World Today
13Innovation: Future Revenue Streams
Ink Jet
Barrier
Encapsulation
Nozzle
Liquid Solution Barrier
Printing Organic Vapor Jet Printing Encapsulation
P2OLED (OVJP)
14Future Growth: Flexible
New Form Factors Unbreakable Lighter Thinner
Samsung
Galaxy Z
Flip
Huawei
Mate X
Lenovo ThinkPad X1 Fold
Galaxy Z Fold2 5G 15Strong, Broad and Deep Patent Portfolio
We develop and license enabling
technologies that are at the heart of
consumer OLED products worldwide, from
AR/VR, smartwatches, smartphones, IT,
automotive and TVs to lighting products.
We believe that our extensive portfolio of
patents, trade secrets and non-patented
know-how enable our leadership position
in the OLED ecosystem.
Our R&D innovations allow us to
continuously bolster the depth and
breadth of our global OLED intellectual
property framework, which currently
stands at over 5,000 issued and pending
patents worldwide (as of February 17,
2020).
16Patents are Universal
China
Europe (I-308 / P-234)
(I- 786 / P-152)
United States South Korea Japan
(I-1205 / P-496) (I-385 / P-331) (I-823 / P-127)
Taiwan
(I-336 / P-36)
Over 5,000 patents and pending applications*
*as of February 17, 2020
17Strategic Display & Lighting Partnerships
Display Lighting
• AU Optronics • Fraunhofer IPMS
• BOE Technology • HotaluX
• China Star Optoelectronics • Kaneka
• Innolux • Konica Minolta
• Japan Display • LG Display
• LG Display • Lumiotec
• Tohoku Pioneer • OLEDWorks
• Royole • Sumitomo Chemical
• Samsung Display
• Seeya Technology
• Sharp
• Tianma Micro-electronics
• Visionox
18Historical Financial Performance
Revenue Income
($ in millions)
$428 $160 $156.1
$400.0 $405
$138.3
$130.5
$336
$326 $120 $115.4(3)
$300.0
$247
$199 $80
$200.0 $191
$58.8
$44.8(2) $48.1
$40
$100.0
$- $0
2015 2016 2017 2018 2019 2015 2016 2017 2018 2019
ASC 605 Adjustment $- $- $- $78.9 $22.9
Hosts $12.5 $1.4 $1.6 $- $- (2) Adjusted net income excludes the inventory write-down and its
Royalty & License $77.8 $96.1 $126.5 $80.6 $150.0 related impact on the effective tax rate.
(3) Adjusted net income excludes the one-time charge due to the
Emitters $100.6 $97.9 $198.7 $153.2 $243.4 enactment of the Tax Cuts and Jobs Act.
See "Reconciliation of Non-GAAP Measures" for further discussion of
As discussed in the 2019 10-K, the Company changed its method for accounting for
these non-GAAP measures on slide 20.
revenue from contracts with customers due to the adoption of ASC Topic 606
(adopted January 1, 2018). 19Reconciliation of non-GAAP measures
The following table details our reconciliation of non-GAAP measures to the most directly comparable GAAP measures:
(1) The adjusted net income per common share, basic and diluted is derived from dividing adjusted net income by the number of weighted average shares used in computing basic and
diluted net income per common share.
(2) Adjusted net income is based on excluding the impact of the one-time charge due to the enactment of the Tax Cuts and Jobs Act for the year ended December 31, 2017.
(3) Adjusted net income assumes an effective tax rate of 32% for the year ended December 31, 2015 and is based on excluding the impact of the inventory write down.
Non-GAAP Measures - To supplement our selected financial data presented in accordance with U.S. generally accepted accounting principles (GAAP), we use certain non-GAAP measures.
These non-GAAP measures include adjusted net income (loss), adjusted net income (loss) per common share, basic and adjusted income (loss) per common share, diluted. Reconciliation
to the nearest GAAP measures of all non-GAAP measures included in the presentation can be found within the tables detailing the reconciliation of non-GAAP measures to GAAP measures
above. We have provided these non-GAAP measures to enhance investors' overall understanding of our current financial performance, and as a means to evaluate period-to-period
comparisons. We believe that these non-GAAP measures provide meaningful supplemental information regarding our financial performance by excluding the effect of the release of
income tax valuation allowances that may not be indicative of recurring core business operating results. We believe that the non-GAAP measures that exclude the impact of the release
of income tax valuation allowances and deferred income tax expense recognized after the release of the allowances, when viewed with GAAP results, enhance the comparability or
results against prior periods and allow for greater transparency of financial results. The presentation of non-GAAP measures is not intended to be considered in isolation or as a substitute
for, or superior to, the financial information prepared and presented in accordance with GAAP.
20Robust Capital Structure
($ in thousands, except share data)
September 30, 2020
Cash, Cash Equivalents and
$672,668
Short-Term Investments
Total Assets $1,224,961
Long-term Debt ------
A/P and Accrued Liab. $43,318
Deferred Revenue $190,048
Shareholders’ Equity $879,636
Total Shares Outstanding* 47,260,331
*Weighted average diluted shares used in computing net income per common share
21Company Summary
Global OLED Materials & Strong Financial
Technology Leader Performance
• Lighting up the OLED Revolution • ~$673M Cash, no debt*
• License & Sell Proprietary • ~$14.20 in cash/share*
Phosphorescent OLED Technology • High Margin Business
and Materials to Display & Solid- • Lean Operating Model
State Lighting Manufacturers OLED Strong
• Fabless Model; Partnering w/ PPG Leader Financials *as of Sept 30, 2020
• ~348 Employees (243 R&D, 122
PhDs); Largest Global PHOLED Team Leading Robust Comprehensive
Customers IP & Robust IP
Blue-Chip Customer Base
• Largest Phosphorescent
• Displays: Samsung, LG Display, OLED (PHOLED) Technology
BOE, Tianma, Visionox, CSOT, Sharp & Materials Portfolio
• Lighting: HotaluX, Kaneka, Konica • Over 5,000** Issued &
Minolta, LG Display, OLEDWorks, Pending Patents Worldwide
Sumitomo Chemical and Growing
• Working with over 25 Companies
**as of Feb 17, 2020
.
22You can also read