Atlantic Large Whale Take Reduction Plan Proposed Modifications 2021 - Request for Comments
←
→
Page content transcription
If your browser does not render page correctly, please read the page content below
Atlantic Large Whale
    Take Reduction Plan
Proposed Modifications 2021
    Request for Comments
       January, February 2021
                                Colleen.Coogan@NOAA.gov
                                Marisa.Trego@NOAA.gov
                                Chao.Zou@NOAA.gov
                                Kara.Shervanick@NOAA.gov

                                               Slide 1
Presentation Overview
Purpose: Provide information to prepare stakeholders to comment on a Proposed Rule and Draft
Environmental Impact Statement to modify the Atlantic Large Whale Take Reduction Plan

Background
   ● Status of Right Whales
   ● Overview or MMPA Take Reduction Program and                                                Atlantic
     Large Whale Take Reduction Team (TRT)
Developing the Proposed Rule
   ● Recent Take Reduction Efforts
   ● Alternative Development
NEPA Analysis and Proposed Rule
   ●   Preferred Alternative
   ●   Non-Preferred Alternatives
   ●   Comparison of Biological Impacts
   ●   Comparison of Economic Impacts
Process for Providing Public Comments                                                  Photo Credit: FL FWC FWRI

                                                                                                    Slide 2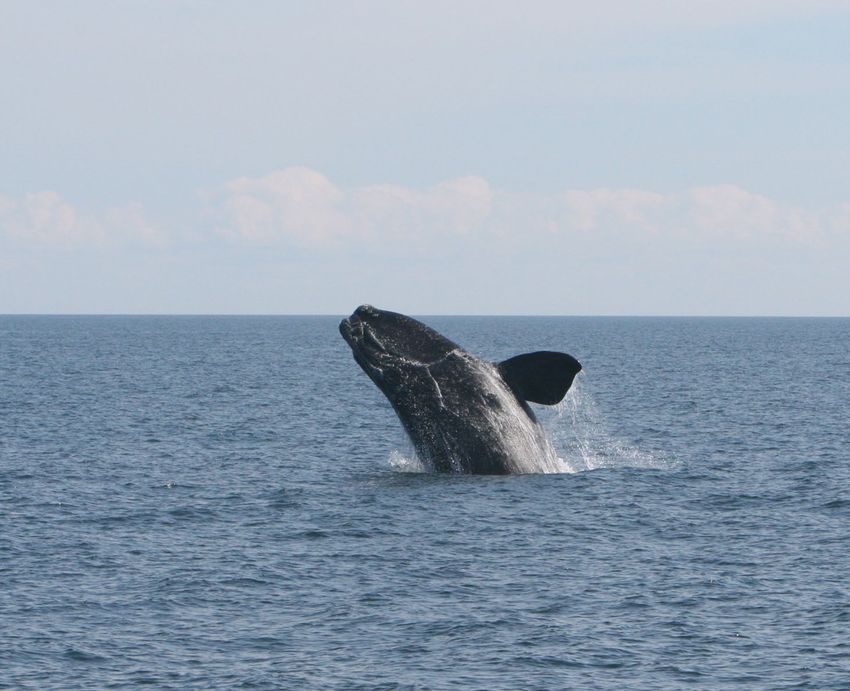
Background

             Slide 3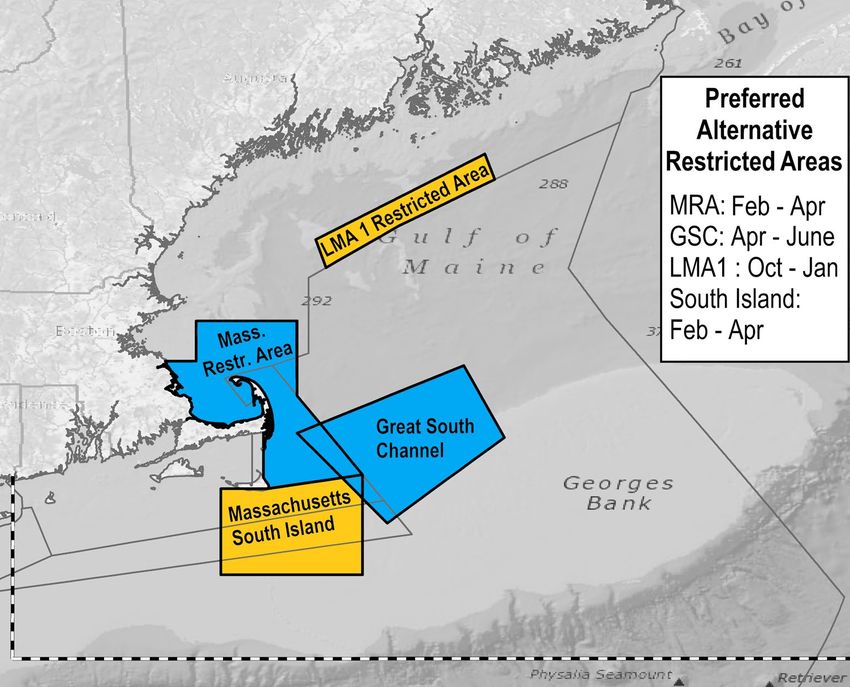
BY THE NUMBERS
            NORTH ATLANTIC RIGHT WHALES
                      References: Pace et al 2017, Hayes et al 2020, Pettis et al 2020                                                 ~366†
                                  Data on this slide through Dec 8, 2020                                                               TOTAL WHALES AT THE
                                                                                                                                       BEGINNING OF 2019

                                                                                                                       ~412*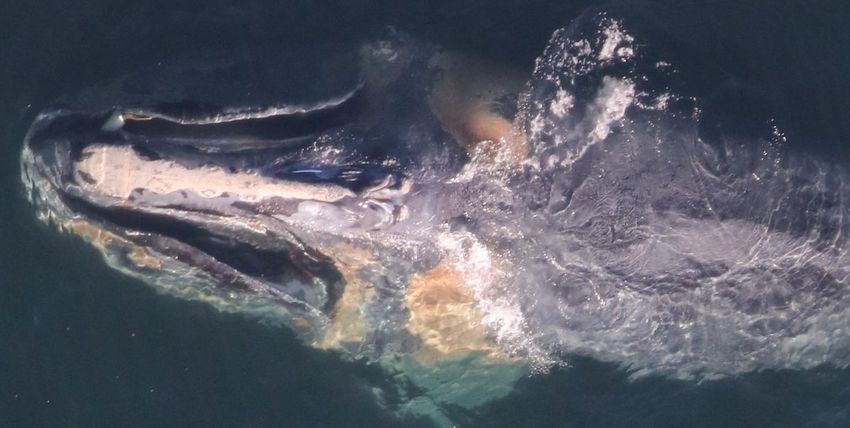
Right Whale Recovery Efforts
   Endangered Species Act (ESA):
     ● Recovery Plan Implementation Teams
          ○ Northeast Implementation Team (NEIT)
          ○ Southeast Implementation Team (SEIT)
     ● ESA Section 7 Consultations
     ● Vessel Strike Regulations:
          ○ Speed reduction management areas
     ● Species in the Spotlight
     ● Collaboration with Canada

   Marine Mammal Protection Act (MMPA):
     ●    Marine Mammal Health and Stranding Response
           ○ Unusual Mortality Event
     ●    Marine Mammal Take Reduction Program - specific to U.S. commercial fisheries

Underlined text throughout this presentation are links to more information in the static slide deck at fisheries.noaa.gov/ALWTRP

                                                                                                                                   Slide 5
Marine Mammal Protection Act Take Reduction Program
     The MMPA prohibits take of marine mammals - but provides conditional exception
                       for incidental take in commercial fisheries

 ●   Required if incidental mortality and serious   Atlantic Large Whale Take Reduction Team (ALWTRT)
                                                                 Group                 # of Members
     injury exceeds Potential Biological
                                                            Trap/Pot Fishery                18
     Removal (PBR)
                                                             Gillnet Fishery                 5
 ●   Take Reduction Planning (TRP):                    Conservation/Environmental            6
        ○   Develop and recommend take reduction           Academic/Scientific               9
            measures                                        State Managers                  14
                                                           Federal Managers                  5
        ○   Consensus-based
                                                    Fishery Management Organizations         4
 ●   NMFS has the ultimate responsibility to                     Total                      61
     take action
                                                                                             Slide 6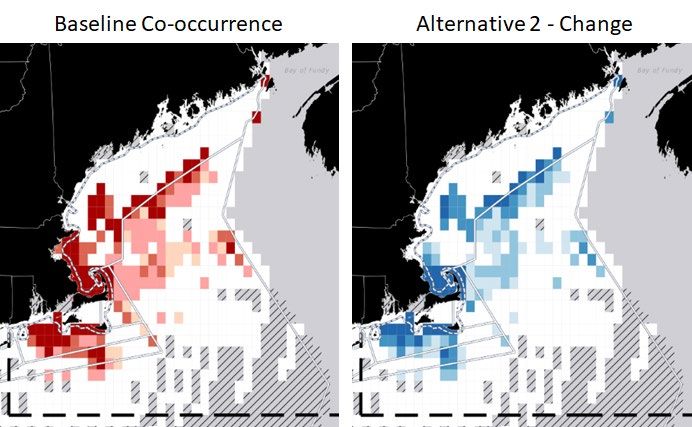
Site and Source of Entanglements Usually Unknown

     Dragon, 2020. Photo taken by CCS

                                                   Slide 7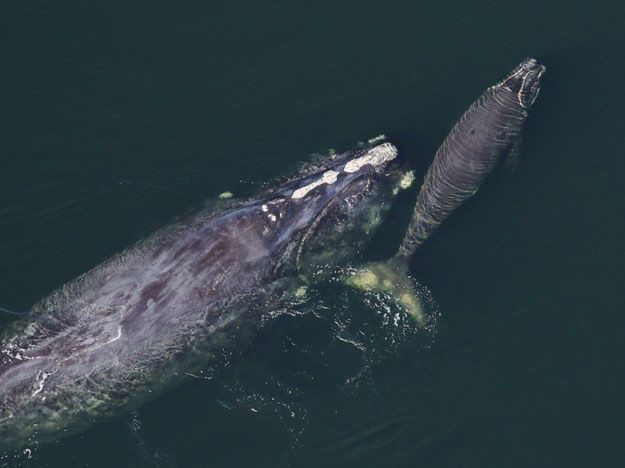
Serious Injuries and Mortalities Continue To Exceed PBR

                                                           Serious Injury and Mortality* of NARWs
                                                       Known US entanglements and those first seen in US**

                                   *Five year rolling average.
                                   **Graph does not include known Canadian entanglements or those first seen in Canada

                                                                                                  Slide 8
Proposed Rule Development

                            Slide 9
Recent Take Reduction Efforts
Develop recommendations to reduce mortalities and serious injuries of right whales in U.S. fisheries by
60% to 80% to below the potential biological removal level
 ● Assumes mortalities and serious injuries of unknown origin occur equally in U.S. and Canada
 ● Decision Support Tool (DST) used to compare/evaluate measures
 ● Best opportunity for Team to collaborate to provide input on measure
 ● Start with northeast lobster and Jonah crab fisheries (93% of vertical lines where right whales occur)

                                                                                             Slide 10
Basic Principles for Alternative Development
Risk reduction of 60% or greater as assessed with
Decision Support Tool (DST)
Consideration of April 2019 TRT Recommendations
● Spread risk reduction across jurisdictions
● Include broad application of reduced line and weak rope
● Jurisdictional approach: incorporate State proposals,
American Offshore Lobster Association for LMA3
NMFS Approach:
● Direct the most protection to areas of predictable high
seasonal aggregations
● Substantial risk reduction across areas of co-occurrence
● Precautionary measures everywhere
Slide 11Proposed Rule and
Draft Environmental Impact
Statement
The National Environmental Policy Act (NEPA) requires an Environmental Impact Statement
(EIS) for major actions. Requires alternatives and effects analyses.
Slide 12The Alternatives and the Proposed Rule
Two alternatives to consider:
● Preferred
○ We use terms “preferred alternative” and “proposed rule” interchangeably
○ Primarily derived from proposals and ideas from the states and AOLA
○ Additional measures included for sufficient risk reduction across area
● Non-Preferred
○ Contains proposed measures not included in the preferred alternative
○ Some measures contain Scenarios A and B, for example restricted area
alternatives in southern New England
Slide 13PREFERRED ALTERNATIVE / PROPOSED RULE
ALWTRP Measures
● Trawl up by LMA, distance from shore outside of ME exempt waters or 3 nmi
● Restricted areas changed from closure to ropeless (closed to buoy lines)
● Two new restricted areas:
○ South Island Restricted Area Feb -Apr Risk Reduction ~64%
○ LMA 1 Restricted Area Oct - Jan
Analyzed proposal: restricted area Oct - Jan Reduction in right whale
Co-proposal 1-A: no restricted area Co-Occurrence
Co-proposal 1-B: restricted area Oct-Jan based on future ~69%
determinations
Proportion Line Weakened ~30%
● Region-wide conversion to weaker line
○ Nearshore: a set number of insertions based on distance from shore
First Year Cost $6.9~$15.4
○ Offshore: full weak line or equivalent in the top of one line
million
Other Measures
● Ongoing and planned line reduction in LMAs 2 & 3
● No singles on MA vessels larger than 29 ft permitted after 1/1/2020
● Credit for the Massachusetts Restricted Area (MRA) from Feb - Apr
● Delayed open of MRA state waters until surveys confirm whales have left
Slide 14Preferred Alternative/Proposed Rule:
Line Reduction Measures
Measure Source
Increased trap/trawl requirements based on distance from shore and/or LMA: ME and MA for
● ME state waters outside of exemption 3 traps/trawl LMA1 and 2 and
● ME 3-6 nm (already 10 traps/trawl for NH, MA) 8 traps/trawl in consultation with
● LMA1 6-12 nm 15 traps/trawl Atlantic Offshore
● LMA2, Outer Cape 3-12 nm 15 traps/trawl Lobstermen’s
● LMA 1 & 2 over 12 nm 25 traps/trawl Association (AOLA)
● LMA3 45 traps/trawl for LMA3
In LMA3, increase maximum ground line length from 1.5 nm to 1.75 nm AOLA
Slide 15Preferred Alternative:
Seasonal Restricted
Areas
● Existing restricted areas (in blue)
modified to allow ropeless (with
Exempted Fishing Permit)
● State waters of MRA would be
closed by MA in May unless
whales leave the area
● Up to two new seasonal ropeless
areas proposed (in yellow)
Slide 16Full weak line Insertion at
Preferred Alternative: Weak Line Measures equivalent 25% and 50%
Area Insertion % from the top Source
State waters 1 weak insertion at 50% ME, MA Weak
////////
Insertion
////////
Maine state waters outside 50%
2 weak insertions at 25% and 40 ft
exemption area and all northeast 3 ME, MA
50%
to 12 nm
////////
////////
12 nm to border (all northeast) 1 weak insertion at 33% ME, MA
LMA3-weak line (75%) One full weak line top 75% AOLA
////////
# of inserts X 40ft
Risk Reduction = X risk reduction for full weak line
depth X scope ratio
Slide 17Example: New Hampshire
Preferred Alternative: Gear Marking Federal Water State Water
Marks Marks
● State specific colors (new and existing marks):
Maine = Purple (already implemented through state regs)
New Hampshire = Yellow
Massachusetts = Red
Rhode Island = Silver/gray
LMA3 = Black
● New three-foot long mark within two fathoms of surface system
● State waters: two one-foot marks, top and bottom half of buoy line
● Federal waters: six-inch green mark within one foot of long mark
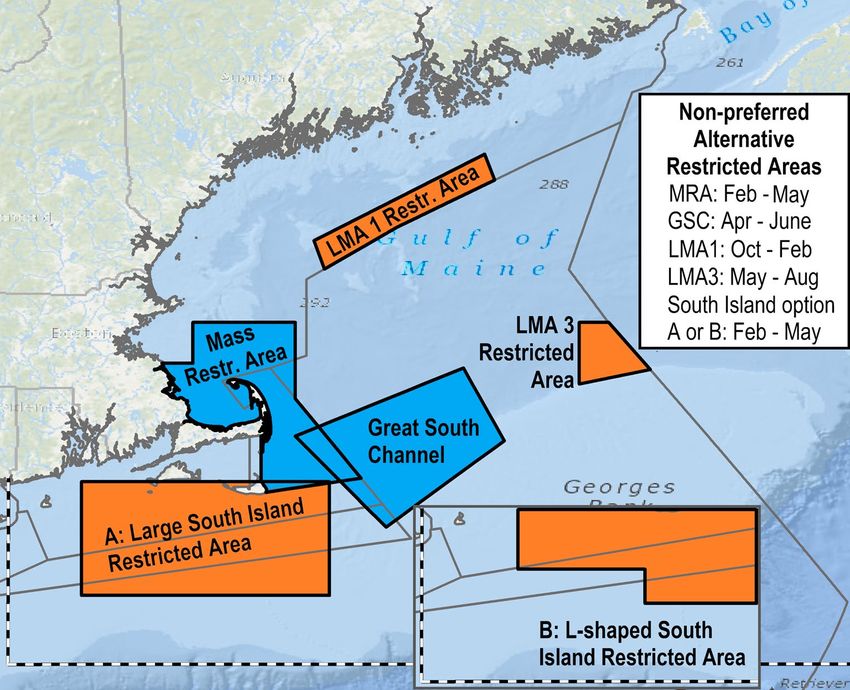
Slide 18NON-PREFERRED ALTERNATIVES
NON-PREFERRED ALTERNATIVES
ALWTRP Measures
● Line cap 50% of monthly average in federal waters
● Trawl up in LMA3 May - Aug
● Restricted areas changed from closure to ropeless (closed to buoy lines)
● New restricted areas or seasons: Risk Reduction ~69 - 72%
○ Extend the MRA closure, soft open
○ LMA1 Restricted Area, Oct - Feb, soft open Reduction in right whale
○ LMA3 Restricted Area, May - Aug Co-Occurrence
○ South Island restricted Area Feb - Apr: ~83 - 88%
Scenario A: Large rectangular area
Scenario B: L-shaped area Proportion Line Weakened ~74%
● Region-wide conversion to weaker line
○ Nearshore: full weak topper in all lines First Year Cost $28~$46
○ Offshore options: million
Option 1: One full weak line topper all year
Option 2: Shorter weak section as topper with a longer weak topper on one end from May -
Aug
Slide 19Non-Preferred Alternative: Line Reduction Measures
Measure Source
50% line cap in federal waters based on the monthly average, TRT October 2018 proposal, scoping comments,
May - Aug ASMFC Lobster Whale Working Group
Increase the number of traps/trawl in LMA 3 to 45, May - Aug AOLA
In LMA3, increase maximum ground line length from 1.5 nm to
AOLA
1.75 nm
Slide 20Non-Preferred Alternative:
Seasonal Restricted Areas
● Existing restricted areas (in
blue) modified to allow
ropeless (with Exempted
Fishing Permit)
● Three new seasonal ropeless
areas proposed (in orange)
● Longer LMA1 Restricted Area
than in preferred
● Extension of Mass Restricted
Area into May unless right
whales leave
Slide 21Non-Preferred Alternative: Weak Line Measures
Area Proportion of line weakened Source
Everywhere outside of LMA 3 Full weak rope in the top 75% of all lines Proposals, scoping
comments
LMA 3 Option 1 Weak line in the top 75% of one line AOLA
LMA 3 Option 2 One weak line in the top 75% of one line AOLA
and 20% on other line (May - August), top
20% weak Sep-Apr
Slide 22Non-Preferred Alternative: Gear Marking
● State specific colors (new and existing marks):
Maine = Purple (already implemented by state regs)
New Hampshire = Yellow
Massachusetts = Red
Rhode Island = Silver/gray
LMA3 = Black
● New three-foot long mark within two fathoms of the buoy
● Replace rope in buoy line with rope with identification tape
that identifies home state and target species
Surface System 3-foot Mark
Slide 23National Environmental Policy
Act Analyses
Slide 24Biological Impacts: How We Measured
Proxies used to assess the
potential biological impacts:
● Percent line reduction
● Percent co-occurrence reduction
○ IEC/NMFS co-occurrence
model
○ reduction in overlap between
vertical lines & whales
● Percent total line weakened
The darker red cells represent areas of high co-occurrence
The darker blue cells represent areas with greater decrease in co-occurrence
White cells represent low to no co-occurrence
Grey cells represent area where we have insufficient data for co-occurrence
Slide 25Biological Impacts: Change in Vertical Line & Co-Occurrence
Non-Preferred Alternative
Preferred Alternative
Scenario A Scenario B
Lines Out Relocation Lines Out Relocation Lines Out Relocation
% Reduction in Vertical Lines
Of all lines outside of
19.2% 18.8 % 50.6% 50.1% 50.5% 50.0%
Maine Exempt waters
% Reduction in Co-Occurrence
Right Whale 69.2% 69.1% 88.4% 86.0% 86.4% 83.8%
Humpback Whale 19.5% 19.4% 57.4% 56.5% 57.2% 56.3%
Fin Whale 27.9% 27.9% 59.1% 58.3% 58.9% 58.1%
Taken from Table 5.9 in DEIS
Slide 26Biological Impacts: Proportion Converted to Weak Line
Prefeap
● Every line will have weaknesses introduced, some with full weak rope and some with weak inserts
● Inserts were compared to the full weak rope equivalent of inserts every 40 feet
Non-Preferred Alternative
Preferred Alternative
Scenario A Scenario B
Lines Out Relocation Lines Out Relocation Lines Out Relocation
Proportion of line that is less than or equal to 1700 lbs (weak line) or the equivalent
Maine Exempt
31.7% 31.7% 75.0% 75.0% 75.0% 75.0%
Waters
Outside Maine
26.6% 26.5% 73.4 - 73.9% 73.3 - 73.8% 73.3 - 73.9% 73.3 - 73.8%
Exempt Waters
Taken from Table 5.8 in DEIS
Slide 27Economic Impacts: What Costs Impacts Are Analyzed
● Number of Affected Vessels
● Compliance costs for: Harmonia, a 2020 mom, with a young calf during the 2015-2016 season.
○ Restricted Areas
■ Lines out
■ Relocation
○ Gear Configuration
■ Trawling up
■ Weak rope
○ Gear Marking
○ Buoy Line Cap
● Comparison of cost efficiency between
alternatives Credit: Photo by Sea to Shore Alliance; taken under NOAA research permit #15488
Slide 28Economic Impacts: Number of Vessels Analyzed in DEIS
Measures
State/Area
Weak Gear Trawling Up Trawling Up Line Cap (Non-
Rope Marking (Preferred) (Non-preferred) preferred)
ME
2,300 1,185 1,602 0 1,185
(Non-exempt)
NH 241 241 0 0 0
MA 1,216 1,216 21 0 187
RI 131 131 7 0 37
LMA 3 82 82 82 74 82
Total 3970 2855 1,712 74 1,491
Data Source: IEc.2017 Model Vessel Database (pulled in 2020)
Slide 29Economic Impacts: Summary of Affected Vessels and Annual
Costs of Federally Managed Restricted Areas
Non-Preferred Alternative
Preferred Alternative
Restricted Scenario A Scenario B
Area
Vessels Vessels Cost Range (in Vessels Vessels Cost Range (in Vessels Vessels Cost Range (in
Lines Out Relocation thousands $) Lines Out Relocation thousands $) Lines Out Relocation thousands $)
LMA1 0 45 $106 - $315 0 45 $114 - $340 0 45 $114 - $340
South IslandEconomic Impacts: Summary of Compliance Costs by
Alternatives
Non-Preferred Alternative
Preferred Alternative (in millions $)
Measures (in millions $)
Scenario A Scenario B
First Year 6 Years First Year 6 Years First Year 6 Years
Gear marking $2.0 $12.0 $4.3 $15.2 $4.3 $15.2
Weak rope $2.2 $2.2 $10.2 $10.2 $10.2 $10.2
Trawling up $2.7 - $11.0 $13.2 - $45.0 $0.8 - $1.8 $2.7 - $6.5 $0.8 - $1.8 $2.7 - $6.5
Restricted Areas $0.1 - $0.3 $0.6 - $1.9 $1.3 - $1.9 $7.5 - $11.0 $1.1 - $1.7 $6.6 - $10.0
Line cap - - $11.4 - $28.2 $45.5 - $114.0 $11.4 - $28.2 $45.5 - $114.0
Total $6.9 - $15.4 $28.0 - $61.0 $27.9 - $46.3 $81.2 - $157.3 $27.8 - $46.1 $80.2 - $156.0
Adapted from Table 6.22 DEIS
Slide 31Comparison Estimated Risk Reduction and Costs*
Non-Preferred Alternative
Indices Preferred Alternative
Scenario A Scenario B
Co-Occurrence Reduction 69% 86 - 88% 83 - 86%
First Year Co-Occurrence Reduction
$2.8~$11.3 million $13.5~$31.7million $13.3~$31.7 million
Costs
First Year Costs for Each Percent of
$41,000-$164,000 $155,000-$364,000 $157,000-$375,000
Co-Occurrence Reduction
Proportion of Line Weakened 26% 73% 73%
First Year Costs of Converting to
$2.2 million $10.2 million $10.2 million
Weak Rope
First Year Costs for Each Percent of
$81,000 $139,000 $139,000
Line Weakened
*Costs of other measures that do not reduce risk, primarily gear marking, are included. Taken from Tables 1.3, 1.4 and Table 6.22 DEIS
Slide 32Input needed:
● Are there other equivalent risk reduction options that should be considered? For example,
restricted areas not in TRT recommendation.
● Are estimates of time required for gear marking and gear conversion reasonable?
● Maine proposed trawling up or the use of a single buoy line on multi-trap trawls. Comments?
● Some LMA3 vessels may not have deck or rope storage capacity to fish 45 trap/trawls.
Comments on consideration of using permit conditions to allow variety as long as the average
is 45 traps/trawl in LMA3 would be appreciated. In other LMAs?
● Are weak links at the buoy or at surface system connection needed onces inserts are required
within the buoy line?
Slide 33Next Steps
● Collect comments, analyze, prepare responses
● Update analyses including new data, publications,
information from public comments
● Complete and make available Final Environmental
Impact Statement (FEIS)
● Complete and file Final Rule after FEIS 30-day
cooling off period is completed
● Complete Endangered Species Act Section 7
Consultation on fisheries
○ Issue Biological Opinion by May 31, 2021
Slide 34Providing Written Public Comment
Attendance at a Public Hearing is not necessary to provide comments
Proposed Rule and DEIS can be found here: fisheries.noaa.gov/ALWTRP
To submit written comments:
● Go to: www.regulations.gov/#!docketDetail;D=NOAA-NMFS-2020-0031
● Click: “Comment Now”
● Identify with Docket Number*: NOAA-NMFS-2020-0031
*You may need to search regulations.gov using the docket number
Slide 35Two-Part Public Meetings Plan Written comments
Regional Informational Presentations:
●Present overview of information in DEIS and Proposed Rule ● Attendance at a meeting is not necessary to provide
●Answer questions on DEIS and Proposed Rule comments.
● Written comments due within 60 days of publication.
Public Hearings: ● Submit written comments at regulations.gov under
●Brief overview identification number NOAA-NMFS-2020-0031.
●Bulk of time for public input
Need more information? Questions?
Visit fisheries.noaa.gov/ALWTRP for:
● Draft Environmental Impact Statement Contact Colleen Coogan at:
● Proposed Rule colleen.coogan@noaa.gov or 978-281-9181
● Public Meeting Schedule
● ‘How-To’ guides if you are not familiar with GoToWebinar
● Instructions for submitting written comments
Thank you to our many collaborators, particularly the members of the ALWTRT
Slide 36You can also read