FORMER TGIF RESTAURANT - LoopNet
←
→
Page content transcription
If your browser does not render page correctly, please read the page content below

Offering Memorandum

                                        FORMER TGIF RESTAURANT
PR ESEN TED BY
Steven D. Weinstock
First Vice President/Regional Manager
Chicago Oak Brook Office
Tel: (630) 570-2250                           5300 West War Memorial Dr • Peoria, IL 61615
steven.weinstock@marcusmillichap.com
License: IL 471011175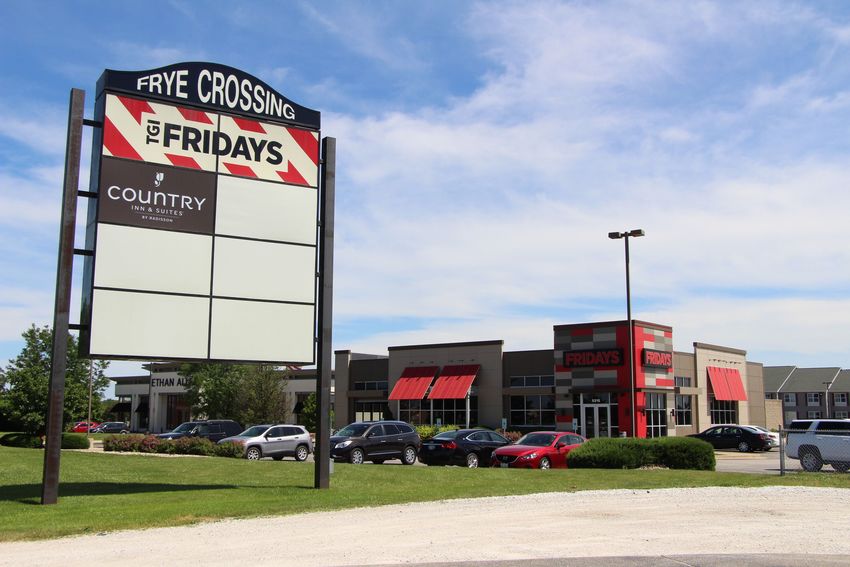
NON-ENDORSEMENT AND DISCLAIMER NOTICE

Confidentiality and Disclaimer
The information contained in the following Marketing Brochure is proprietary and strictly confidential. It is intended to be reviewed only by the party receiving it from Marcus & Millichap and
should not be made available to any other person or entity without the written consent of Marcus & Millichap. This Marketing Brochure has been prepared to provide summary, unverified
information to prospective purchasers, and to establish only a preliminary level of interest in the subject property. The information contained herein is not a substitute for a thorough due
diligence investigation. Marcus & Millichap has not made any investigation, and makes no warranty or representation, with respect to the income or expenses for the subject property, the
future projected financial performance of the property, the size and square footage of the property and improvements, the presence or absence of contaminating substances, PCB's or
asbestos, the compliance with State and Federal regulations, the physical condition of the improvements thereon, or the financial condition or business prospects of any tenant, or any
tenant's plans or intentions to continue its occupancy of the subject property. The information contained in this Marketing Brochure has been obtained from sources we believe to be
reliable; however, Marcus & Millichap has not verified, and will not verify, any of the information contained herein, nor has Marcus & Millichap conducted any investigation regarding these
matters and makes no warranty or representation whatsoever regarding the accuracy or completeness of the information provided. All potential buyers must take appropriate measures to
verify all of the information set forth herein. Marcus & Millichap is a service mark of Marcus & Millichap Real Estate Investment Services, Inc. © 2018 Marcus & Millichap. All rights reserved.

Non-Endorsement Notice
Marcus & Millichap is not affiliated with, sponsored by, or endorsed by any commercial tenant or lessee identified in this marketing package. The presence of any corporation's logo or
name is not intended to indicate or imply affiliation with, or sponsorship or endorsement by, said corporation of Marcus & Millichap, its affiliates or subsidiaries, or any agent, product,
service, or commercial listing of Marcus & Millichap, and is solely included for the purpose of providing tenant lessee information about this listing to prospective customers.

ALL PROPERTY SHOWINGS ARE BY APPOINTMENT ONLY.
PLEASE CONSULT YOUR MARCUS & MILLICHAP AGENT FOR MORE DETAILS.

TGI FRIDAY'S
Peoria, IL
ACT ID ZAB0010137

                                                                                                                                                                                               2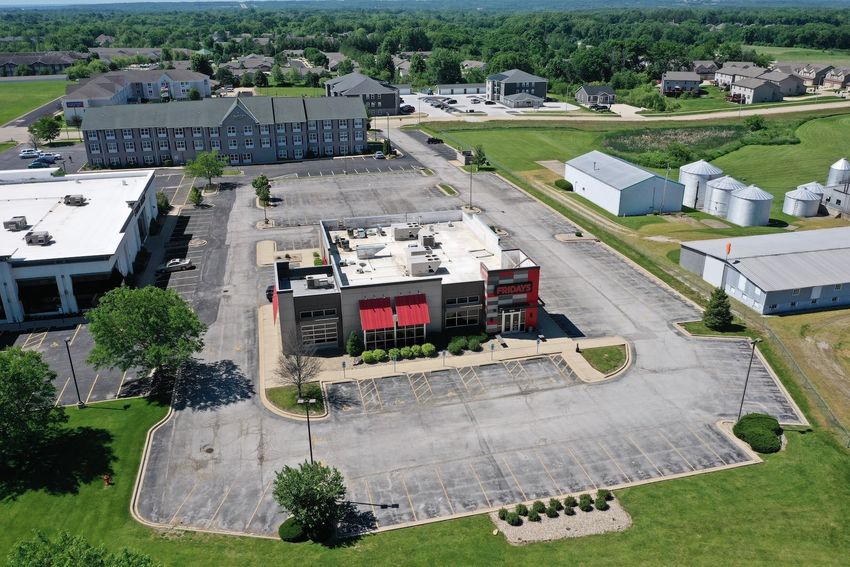
NET LEASED DISCLAIMER

Marcus & Millichap hereby advises all prospective purchasers of Net Leased property as follows:

The information contained in this Marketing Brochure has been obtained from sources we believe to be reliable. However, Marcus & Millichap has not and will
not verify any of this information, nor has Marcus & Millichap conducted any investigation regarding these matters. Marcus & Millichap makes no guarantee,
warranty or representation whatsoever about the accuracy or completeness of any information provided.

As the Buyer of a net leased property, it is the Buyer’s responsibility to independently confirm the accuracy and completeness of all material information before
completing any purchase. This Marketing Brochure is not a substitute for your thorough due diligence investigation of this investment opportunity. Marcus &
Millichap expressly denies any obligation to conduct a due diligence examination of this Property for Buyer.

Any projections, opinions, assumptions or estimates used in this Marketing Brochure are for example only and do not represent the current or future performance
of this property. The value of a net leased property to you depends on factors that should be evaluated by you and your tax, financial and legal advisors.

Buyer and Buyer’s tax, financial, legal, and construction advisors should conduct a careful, independent investigation of any net leased property to determine to
your satisfaction with the suitability of the property for your needs.

Like all real estate investments, this investment carries significant risks. Buyer and Buyer’s legal and financial advisors must request and carefully review all legal
and financial documents related to the property and tenant. While the tenant’s past performance at this or other locations is an important consideration, it is not
a guarantee of future success. Similarly, the lease rate for some properties, including newly-constructed facilities or newly-acquired locations, may be set based
on a tenant’s projected sales with little or no record of actual performance, or comparable rents for the area. Returns are not guaranteed; the tenant and any
guarantors may fail to pay the lease rent or property taxes, or may fail to comply with other material terms of the lease; cash flow may be interrupted in part or in
whole due to market, economic, environmental or other conditions. Regardless of tenant history and lease guarantees, Buyer is responsible for conducting
his/her own investigation of all matters affecting the intrinsic value of the property and the value of any long-term lease, including the likelihood of locating a
replacement tenant if the current tenant should default or abandon the property, and the lease terms that Buyer may be able to negotiate with a potential
replacement tenant considering the location of the property, and Buyer’s legal ability to make alternate use of the property.

By accepting this Marketing Brochure you agree to release Marcus & Millichap Real Estate Investment Services and hold it harmless from any kind of claim, cost,
expense, or liability arising out of your investigation and/or purchase of this net leased property.

                                                                                                                                                                  3
PROPERTY
TGI FRIDAY'S
           NAME

                                                                                   PRICING   LOCATION
                                                                                   PRICING AND
                                                                                           AND TENANT SUMMARY
                                                                                                      OVERVIEW
                                                                                               VALUATION
                                                                                               VALUATION MATRIX
                                                                                                         MATRIX

                            5300 W War Memorial Dr, Peoria, IL 61615

                                                                                     Property Highlights
                                                                       ▪   Ideal owner/user opportunity
                                                                       ▪   Property offers excellent street frontage of
                                                                           142 feet onto a 6-lane road and easy
                                                                           access to Highway 6
                                                                       ▪   -+/-6,121 s.f. restaurant situated on +/-1.68
                                                                           acres of land providing abundant on-site
                                                                           parking
                                                                       ▪   Strategically situated across the street from
                                                                           The Shoppes at Grand Prairie
                                                                       ▪   Located in front of a Country Inn & Suites
                                                                           and Candlewood Suites with 3 other
                                                                           national branded hotels nearby

                                                                                   Location Highlights
                                                                  The subject property benefits being near large
                                                                  traffic generators such as Home Depot, HyVee,
                                                                  AMC Theaters along with The Shoppes at Grand
                                                                  Prairie (reported 468,520 sq. ft. of retail space).
                                                                  Peoria is the 4th largest MSA in the state of Illinois
                                                                  situated 160 miles south of Chicago. Peoria
                                                                  enjoys a current city population estimated at
                                                                  110,000.

      CLOSE PROXIMITY TO:

                                                                                                                           4#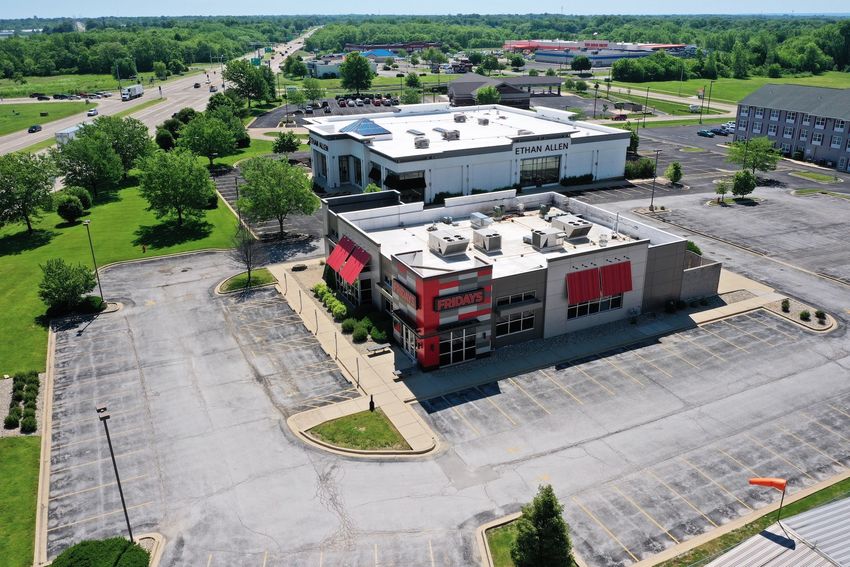
TGI FRIDAY'S

                                                                                                              DESCRIPTION SECTION

  The subject property is a former TGI Friday’s restaurant located in Peoria, Illinois. Consisting of approximately 6,121 sq. ft. of
  improvements the property is situated on approximately 1.68 acres of land providing for 121 on-site parking spaces.
  Originally constructed in 2006, the building was remodeled in 2017 to reflect TGI Friday’s restaurant design. There is tenant
  signage available on a large shared monumental sign.
  The location is appealing because it offers easy access to Highway
  6 and is situated directly across the street from The Shoppes at
  Grand Prairie, a modern outdoor lifestyle center anchored by
  Dick’s Sporting Goods, Marshalls and HomeGoods. There are 5
  national branded hotels located within blocks from the subject
  property along with the AMC Grand Prairie 18 Theaters. Daily
  traffic count reported on West War Memorial Drive is 25,100 with
  over 32,400 cars on State Route 6.
  The city of Peoria is the county seat to Peoria with a population
  reported at 111,388. Peoria is a major port on the Illinois River for
  trading and shipping and is a large agriculture area that produces
  maize, soybeans and livestock. Average Household Income within
  a 1-mile radius from subject property is reported at $133,261 with
  over 65,729 residents within a 5-mile radius.

  All existing restaurant equipment and seating is included in the sale, so an owner/user could purchase a turn-key restaurant.

                                                                                                                                       5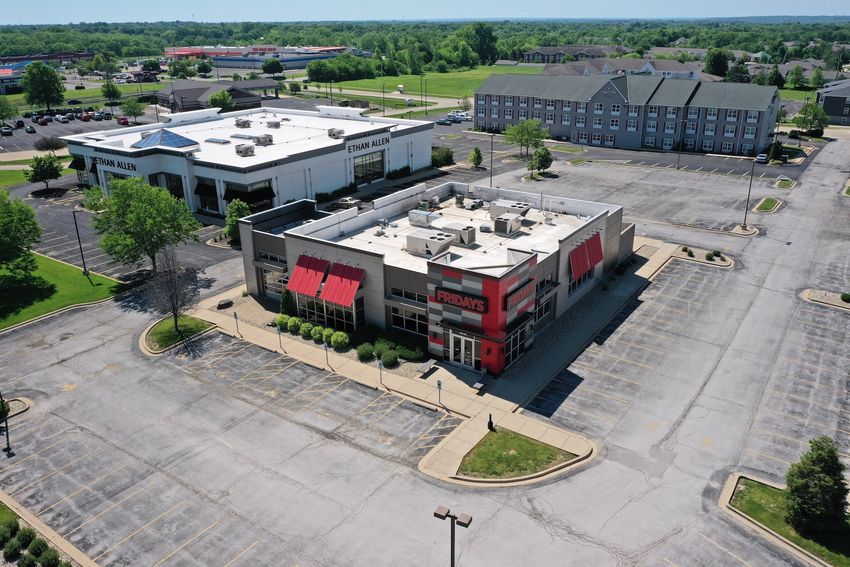
PROPERTY
   TGI FRIDAY'S
              NAME

                                           PRICING
                                           PRICING   LOCATION
                                                   AND TENANT
                                                REGIONAL
                                                   AND        SUMMARY
                                                              OVERVIEW
                                                       VALUATION
                                                       VALUATION MATRIX
                                                         AND LOCAL
                                                                 MATRIX
                                                                   MAP
5300 W War Memorial Dr, Peoria, IL 61615

                                                                     6#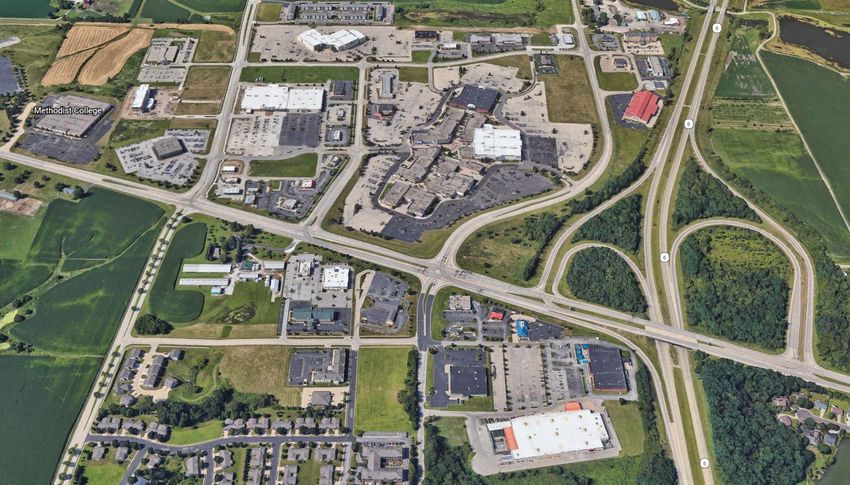
Subject
Property

           7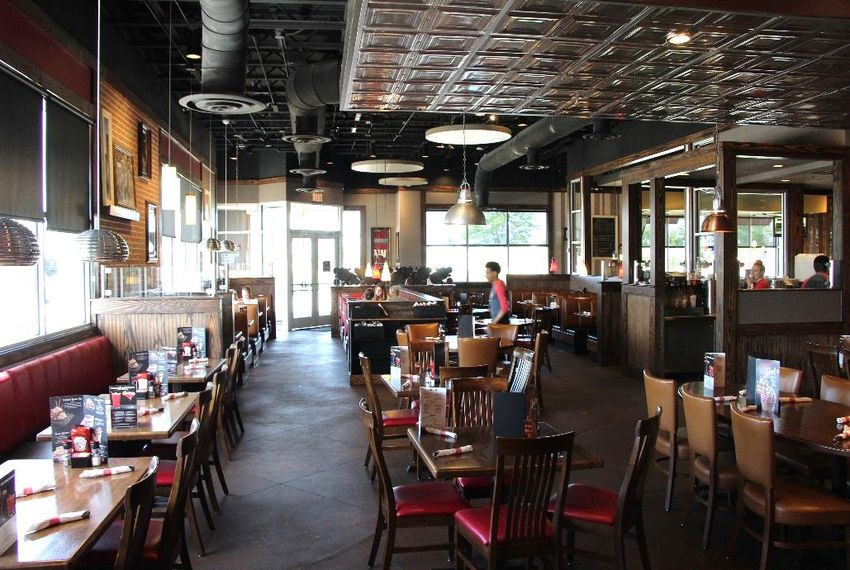
TGI FRIDAY'S

               INTERIOR PROPERTY PHOTOS

                                    128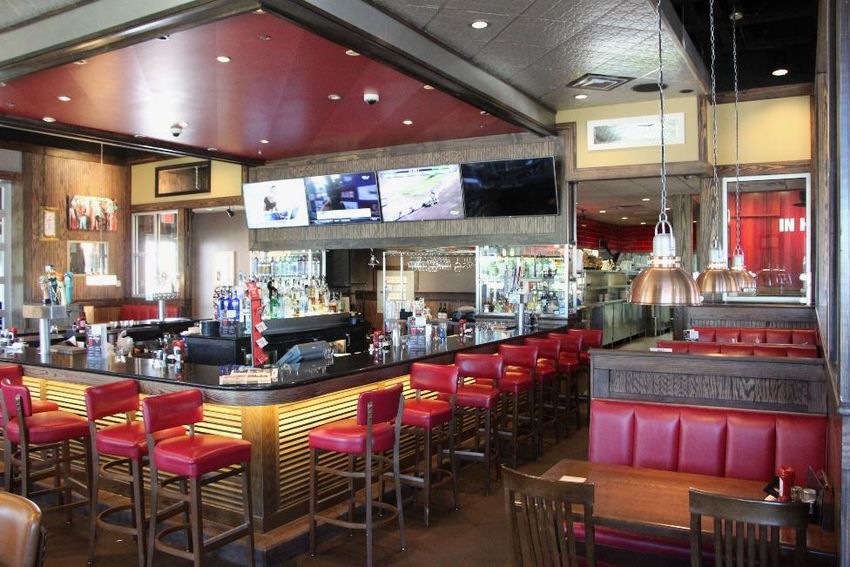
TGI FRIDAY'S

               EXTERIOR PROPERTY PHOTOS

                                      9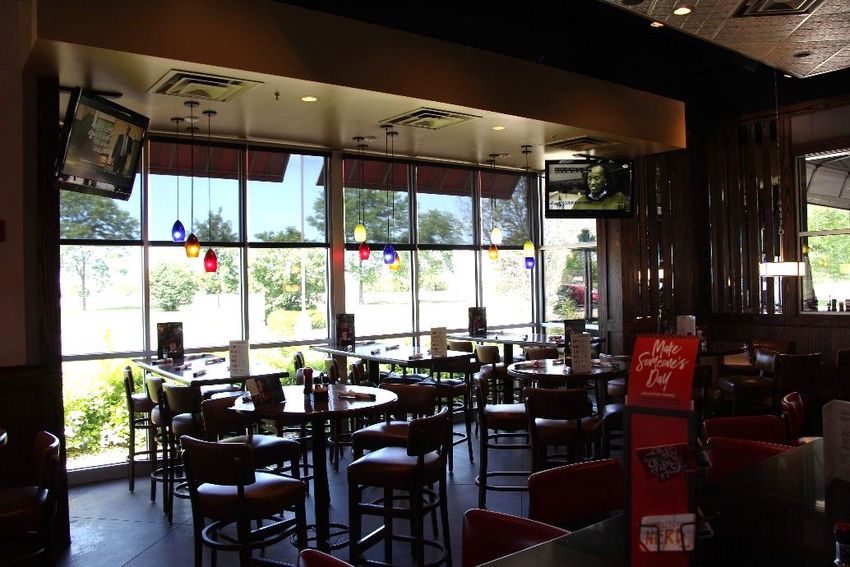
TGI FRIDAY'S

               EXTERIOR PROPERTY PHOTOS

                                     10
TGI FRIDAY'S
OFFERINGSUMMARY
OFFERING SUMMARY
PROPERTY SUMMARY
THE OFFERING ANNUALIZED OPERATING INFORMATION
Property Former TGIF Restaurant INCOME
Property Address 5300 West War Memorial Drive Proforma Net Operating Income $153,024
Peoria, IL 61615
Price $1,700,000 RENT SCHEDULE
Proforma Capitalization Rate 9.00% ANNUAL RENT MONTHLY RENT RENT/SF
Price/SF Building $277.73 $153,024 $12,752 $25.00
Price/SF Land $23.23
PROPERTY DESCRIPTION
Year Built / Renovated 2006
Gross Leasable Area 6,121 SF
Zoning C-2
Type of Ownership Fee Simple
Lot Size 1.68 Acres
APN #13-11-303-002
NOTES
1) Property currently for lease at $2.08 s.f. NNN that includes tenants use of all restaurant kitchen equipment and seating.
2) Zoning is C-2 (Large Scale Commercial District)
11PROPERTY NAME
RETAIL/VACANT USER
DEMOGRAPHICS
MARKETING TEAM
POPULATION 1 Miles 3 Miles 5 Miles HOUSEHOLDS BY EXPENDITURE 1 Miles 3 Miles 5 Miles
2025 Projection Total Average Household Retail
$89,750 $84,621 $80,098
Expenditure
Total Population 3,753 19,558 64,383 Consumer Expenditure Top 10
2020 Estimate Categories
Total Population 3,694 19,480 64,309 Housing $24,422 $22,799 $21,528
2010 Census Transportation $14,643 $14,094 $13,159
Total Population 3,762 19,758 65,370 Shelter $14,161 $13,346 $12,545
2000 Census Food $10,832 $9,749 $9,081
Total Population 2,216 17,089 58,001 Personal Insurance and Pensions $9,149 $8,514 $7,782
Current Daytime Population Health Care $6,091 $5,798 $5,658
2020 Estimate 2,667 19,023 71,968 Utilities $4,377 $4,228 $4,089
Entertainment $4,003 $3,770 $3,544
HOUSEHOLDS 1 Miles 3 Miles 5 Miles
Household Furnishings and
2025 Projection $3,244 $2,704 $2,487
Equipment
Total Households 1,483 8,505 28,049 Apparel $2,793 $2,486 $2,246
2020 Estimate POPULATION PROFILE 1 Miles 3 Miles 5 Miles
Total Households 1,463 8,410 27,841 Population By Age
Average (Mean) Household Size 2.57 2.31 2.28 2020 Estimate Total Population 3,694 19,480 64,309
2010 Census Under 20 31.62% 25.39% 24.52%
Total Households 1,480 8,487 28,250 20 to 34 Years 14.20% 20.52% 19.33%
2000 Census 35 to 39 Years 7.18% 6.97% 6.64%
Total Households 896 7,183 24,616 40 to 49 Years 14.50% 12.40% 11.64%
Occupied Units 50 to 64 Years 17.76% 18.16% 18.77%
2025 Projection 1,483 8,505 28,049 Age 65+ 14.72% 16.56% 19.08%
2020 Estimate 1,631 9,432 31,302 Median Age 37.97 37.87 39.61
HOUSEHOLDS BY INCOME 1 Miles 3 Miles 5 Miles Population 25+ by Education Level
2020 Estimate 2020 Estimate Population Age 25+ 2,396 13,594 45,505
$150,000 or More 27.96% 18.66% 14.94% Elementary (0-8) 0.89% 0.81% 1.13%
$100,000 - $149,000 21.79% 18.47% 17.23% Some High School (9-11) 3.26% 3.52% 4.41%
$75,000 - $99,999 14.15% 16.98% 15.22% High School Graduate (12) 13.58% 16.32% 19.63%
$50,000 - $74,999 10.41% 16.90% 18.29% Some College (13-15) 15.66% 19.06% 20.49%
$35,000 - $49,999 7.45% 10.32% 10.78% Associate Degree Only 7.99% 9.70% 9.48%
Under $35,000 18.24% 18.67% 23.54% Bachelors Degree Only 32.12% 29.89% 26.22%
Average Household Income $141,775 $115,663 $101,237 Graduate Degree 26.42% 20.42% 18.00%
Median Household Income $99,545 $80,753 $71,486
Per Capita Income $56,289 $50,011 $44,094
Source: © 2019 Experian
12PROPERTY NAME
RETAIL/VACANT USER
DEMOGRAPHICS
MARKETING TEAM
Population Race and Ethnicity
In 2019, the population in your selected geography is 3,694. The The current year racial makeup of your selected area is as follows:
population has changed by 66.70% since 2000. It is estimated that the 68.96% White, 12.25% Black, 0.01% Native American and 13.79%
population in your area will be 3,753.00 five years from now, which Asian/Pacific Islander. Compare these to US averages which are:
represents a change of 1.60% from the current year. The current 69.84% White, 12.88% Black, 0.20% Native American and 5.75%
population is 47.60% male and 52.40% female. The median age of the Asian/Pacific Islander. People of Hispanic origin are counted
population in your area is 37.97, compare this to the US average independently of race.
which is 38.21. The population density in your area is 1,173.85 people
per square mile. People of Hispanic origin make up 3.76% of the current year
population in your selected area. Compare this to the US average of
18.38%.
Households Housing
There are currently 1,463 households in your selected geography. The The median housing value in your area was $237,702 in 2019,
number of households has changed by 63.28% since 2000. It is compare this to the US average of $221,068. In 2000, there were 618
estimated that the number of households in your area will be 1,483 owner occupied housing units in your area and there were 278 renter
five years from now, which represents a change of 1.37% from the occupied housing units in your area. The median rent at the time was
current year. The average household size in your area is 2.57 $560.
persons.
Income Employment
In 2019, the median household income for your selected geography is In 2019, there are 2,164 employees in your selected area, this is also
$99,545, compare this to the US average which is currently $62,990. known as the daytime population. The 2000 Census revealed that
The median household income for your area has changed by 69.90% 79.04% of employees are employed in white-collar occupations in this
since 2000. It is estimated that the median household income in your geography, and 21.88% are employed in blue-collar occupations. In
area will be $114,917 five years from now, which represents a change 2019, unemployment in this area is 2.65%. In 2000, the average time
of 15.44% from the current year. traveled to work was 20.00 minutes.
The current year per capita income in your area is $56,289, compare
this to the US average, which is $34,935. The current year average
household income in your area is $141,775, compare this to the US
average which is $90,941.
Source: © 2019 Experian
13TGI FRIDAY'S
PROPERTY NAME
PRICING LOCATION
PRICING AND
AND TENANT SUMMARY
OVERVIEW
VALUATION
VALUATION MATRIX
DEMOGRAPHICS
MARKETINGMATRIX
TEAM
CREATED ON NOVEMBER, 2020
1 Miles 3 Miles 5 Miles
POPULATION
2023 Projection 4,546 21,431 69,718
2018 Estimate 3,774 19,894 65,729
2010 Census 3,762 19,758 65,370
2000 Census 2,216 17,089 58,001
INCOME
Average $133,261 $109,255 $95,830
Median $94,389 $77,675 $68,427
Per Capita $52,647 $47,025 $41,557
HOUSEHOLDS
2023 Projection 1,789 9,300 30,194
2018 Estimate 1,487 8,549 28,323
2010 Census 1,480 8,487 28,250
2000 Census 896 7,183 24,616
HOUSING
2018 $234,144 $186,275 $163,248
EMPLOYMENT
2018 Daytime
2,021 17,904 71,260
Population
2018
3.22% 3.53% 4.21%
Unemployment
2018 Median Time
20 19 18
Traveled
RACE & ETHNICITY
White 69.31% 71.58% 72.50%
Native American 0.01% 0.04% 0.05%
African American 11.96% 12.31% 13.63%
Asian/Pacific
13.78% 11.34% 9.52%
Islander
Source: © 2015 Experian
14PRESENTED BY
Steven D. Weinstock
First Vice President/Regional Manager
Chicago Oak Brook Office
Tel: (630) 570-2250
steven.weinstock@marcusmillichap.com
License: IL 471011175
www.MarcusMillichap.com
15You can also read