Orlando-Sanford International Airport - Florida ...
←
→
Page content transcription
If your browser does not render page correctly, please read the page content below
Airport Profile                                          2015
                                                                  BY THE NUMBERS

Orlando-Sanford
                                                                           1,227,803
International                                                          Enplanements

Airport                                                                    1,093,195
                                                                           Passengers

Orlando-Sanford International Airport (SFB) is an airport
located in Sanford, Florida in Seminole County, Florida. Since                 $91.01
the airport’s conversion from a Naval Air Station in 1969, the          Average Fare
airport has rapidly grown and served numerous destinations
across the country and the globe.
                                                                                    57
SFB is located within very close proximity to the city of
Orlando, which is well-known as a tourist destination for            U.S. Cities Served
travelers from all over the world. This close proximity makes
the airport an excellent gateway for passengers bound for the
Orlando area as well as east coast beaches. SFB is a major                          11
component in augmenting air service capacity to the Orlando              International
area market.
                                                                          Destinations
Enplanements at SFB increased nearly 14 percent between
2014 and 2015. This could be partially attributed to the
addition of 13 domestic destinations served, bringing the total
destination count to 57 domestic and 11 international in 2015.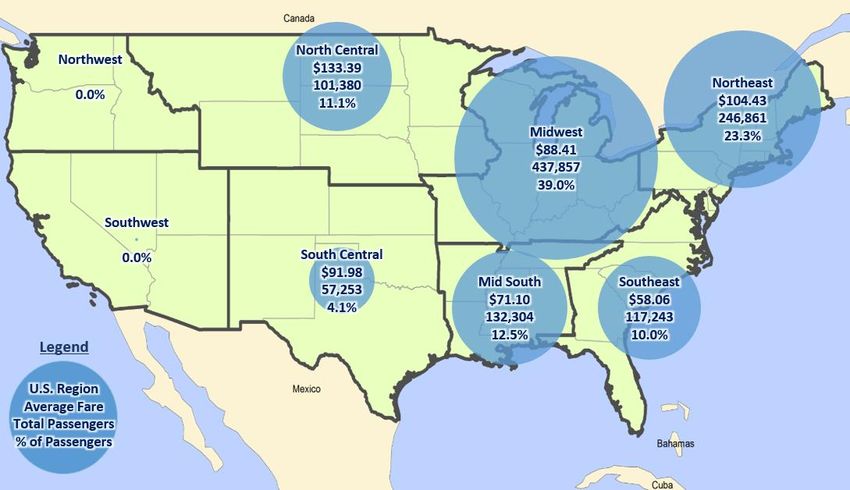
Data Explanation
For this report, three key data sources were used: Passenger Origin-Destination Survey from the U.S.
Department of Transportation, the Official Airline Guide (OAG) and Airline Reporting Corporation (ARC).
In this profile, data are combined and compared in order to identify general trends about the airport, as
well as offer certain analysis on the findings. A description of these data sources is presented below.
Throughout the text, the data sources will be further explained, but this section provides a general
overview of the data used in the development of this Airport Air Service Profile.

Air Passenger Origin and Destination (O&D) Survey
DB1B Coupon: The Airline Origin and Destination Survey (DB1B) is a 10 percent sample of airline tickets
from reporting carriers collected by the Office of Airline Information of the Bureau of Transportation
Statistics. Data from this source provides coupon-specific information for each domestic itinerary of the
Origin and Destination Survey.
T-100 Domestic Market: This data source contains domestic market data reported by both U.S. and
foreign air carriers, including carrier, origin, destination, and service class for enplaned passengers,
freight and mail when both origin and destination airports are located within the boundaries of the United
States and its territories.

Official Airline Guide (OAG)
OAG data were summarized as weekly averages for the reported year. All OAG data are for direct flights
and represents statistically significant samples of data.

Airline Reporting Corporation (ARC)
The data provided by this source represent a statistically significant and representative sample of airline
tickets purchased with a consumer form of payment through an ARC-accredited agency, including major
online travel agencies (OTAs), such as Expedia, Orbitz, and Travelocity.
The data represent a 10 percent sample, an industry standard sample size, of passengers from
participating agencies. Passenger volumes represented by the data can vary significantly by individual
markets, depending on several factors including, but not limited to, the following: 1) the overall
composition of air travelers (leisure vs. business); 2) the presence of carriers whose distribution is more
heavily weighted toward the direct vs. agency channel (e.g. low cost carriers); and 3) the presence of
carriers with limited participation in the ARC settlement system (e.g. Southwest Airlines).
The data used represent passengers and zip codes from where in Florida tickets were purchased. The
data include purchases from Florida zip codes only. Because the data in this document represent
consumer purchases of airline tickets, there is a natural bias toward leisure and unmanaged business
travel behavior and may not account for all business travel. There also may be limitations due to
misrepresentation of the passenger information in instances where a person from one zip code
purchased a ticket for another person in a different zip code.
Airline Reporting Corporation (ARC) did not assist in the preparation of this analysis, all analyses
disclosed herein were performed by Kimley-Horn and Associates, INC., the consultant to the Florida
Department of Transportation, Central Aviation Office.

1
Orlando-Sanford International Airport Air Service Summary
Introduction
Originally commissioned as a naval air station in 1942, Orlando-Sanford International Airport (SFB) is
currently managed by the Sanford Airport Authority. SFB has four runways measuring 3,578 feet, 6,002
feet, 6,647 feet, and one at 11,000 feet in length. SFB served 1,227,803 total enplanements in 2015.
Although the airport has seen a dramatic growing trend in terms of enplaned passengers, SFB continues
to serve destinations that differ from other commercial service airports in Florida.
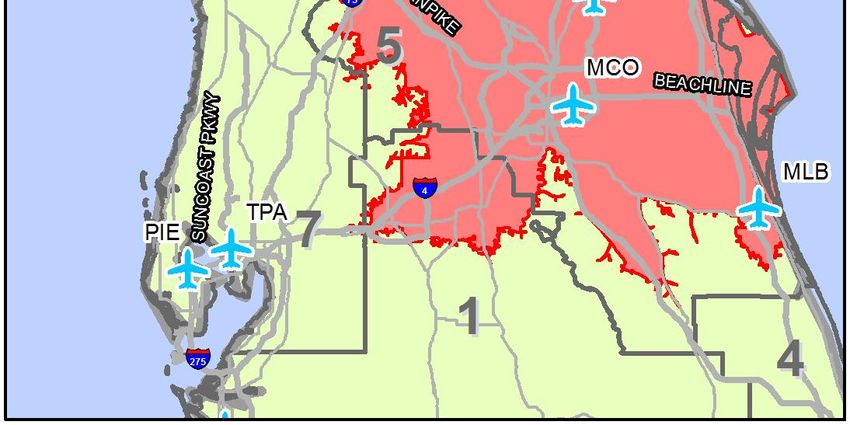
SFB is located in the East Central Continuing Florida Aviation System Planning Process (CFASPP)
region and FDOT District Five. Also included in this region are Daytona Beach International Airport (DAB),
Melbourne International Airport (MLB), and Orlando International Airport (MCO). This airport profile will
illustrate statistical data about SFB including: annual enplanements, local population data, and many
other metrics. The following statistical information will provide a description of the most recent overall
performance of SFB and how that compares to previous years’ performance.
More information about SFB can be found at: http://www.orlandosanfordairport.com/
Annual Enplanements
Figure 1 represents total annual enplanements at SFB between 2000 and 2015. This analysis shows the
gradual increase in enplanements over the last four years. Annual enplanements in 2015 were 1,227,803
compared to 1,080,252 in 2014, a nearly 14 percent increase and the highest recorded number for the
airport.
Figure 1. Annual Enplanements1
1
Annual airport passenger traffic reports, provided by FDOT
2
Passengers and Fares
SFB has experienced a steady increase in annual enplanements over the past six years. In addition, the
passenger count for 2015 was marked at an all-time-high of 1,093,195 which is nearly 180,000 more
passengers than 2014. This high passenger count is in continuation of the steady and drastic growth in
annual passengers seen since 2010. In concert with the increase in annual passengers, the average
annual fare decreased about $6.59 to an average price of $91.01. Figure 2 displays the annual
passengers and annual average fare at SFB.

                  Figure 2. Annual Domestic Passengers and Average Fares 2

Domestic Destination Airports
SFB served 57 domestic destinations in 2015. Only one of these destinations was located within the state
of Florida, Miami International Airport (MIA). MIA is one of Florida’s four large hub airports. The top five
domestic destinations served by SFB include:

    ·   Cincinnati/Northern Kentucky International Airport (CVG) – 9 average weekly flights
    ·   Lehigh Valley International Airport (ABE) – 7 average weekly flights
    ·   McGhee Tyson Airport (TYS) – 7 average weekly flights
    ·   Blue Grass Airport (LEX) – 6 average weekly flights
These top destinations are unique to SFB when compared to the top destinations of other airports around
the state. It should be noted that the average weekly flights to these top destination are relatively low
when compared to the rest of the state; however, the diverse and unique destinations served makes SFB
a vital and unique airport to Florida’s aviation system. Due to a lack of data representing low cost carriers
such as Allegiant Air, some data presented in this profile, such as domestic destinations, is not
completely represented. Figure 3 displays SFB’s domestic destinations.

2
 U.S. Department of Transporta on (U.S. DOT) Bureau of Transporta on Sta s cs (BTS) O&D Survey & T-100
Domes c Market All Carriers

3
Figure 3. SFB’s Domestic Destinations 3

3
    The Official Airline Guide (OAG)

4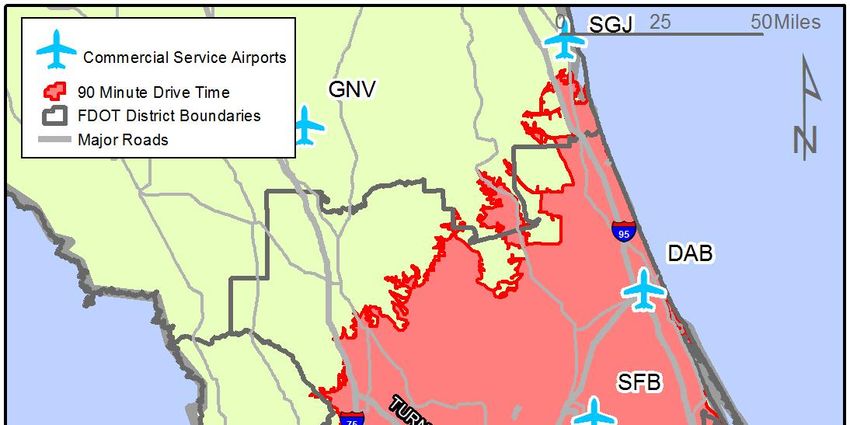
Domestic Regional Analysis
Figure 4 displays the average fare, number of passengers, and percentage of total passengers departing
SFB and bound for each of the eight regions of the United States. The data shows that 39.0 percent of
passengers departing SFB were bound for destinations in the Midwest region. Following the Midwest,
SFB had high passenger activity to the Northeast region with 23.3 percent, the Midsouth with 12.5
percent, the North Central region with 11.1 percent, and the Southeast region with 10 percent.

                               Figure 4. Domestic Passengers and Fares 4

International Flight Departures
SFB served an average of 15 international flights a week in 2015. Of these 15 international flights, one a
week was bound for Georgetown, Guyana in South America, three were bound for Cancun, Mexico, and
11 were bound for destinations in Europe. The European destinations included:
      ·    Manchester, England – 3 average flights per week
      ·    London, England – 3 average flights per week
      ·    Amsterdam, Netherlands – 2 average flights per week
      ·    Glasgow, Scotland – 2 average flights per week
      ·    Newcastle, England – 1 average flight per week
The majority of these European destinations are located in the United Kingdom. The relatively high
volume of international flights, paired with a diverse pallet of international destinations, confirms the
unique role and vital presence SFB plays on the state’s air transportation system. This level of
international service is rare for an airport of SFB’s size and presence, but it highlights the importance and
potential opportunity the airport has for growth and continued success.

4
    The Official Airline Guide (OAG)

5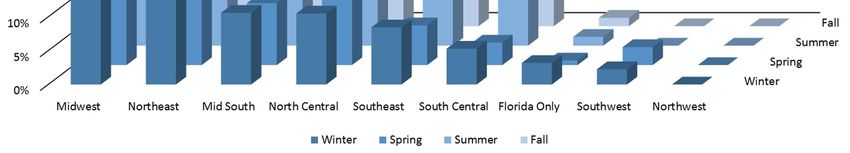
Aircraft Type
Of the 57 domestic destinations served by SFB, all 57 were served by large jet aircraft. The use of large
jet aircraft has a direct impact on the average seats per flight at an airport. Generally larger jet aircraft
substantially increase the average seats per flight, which was 168 for SFB in 2015.

Seasonal Flight Comparison
The data shown below in Figure 5 further supports the identification of major routes to airports in the
Midwest region. This region contains Chicago O’Hare international Airport (ORD), a large hub airport that
received a large number of SFB’s flights in 2015. For all four seasons of the year, the majority of flights,
were bound for airports in the southeast region. In the Summer, flights to the southeast airports reduced,
and flights to airports in Florida increased substantially. This data also confirms the strong seasonal
service to the south central region of the U.S. where DFW is located.

                                     Figure 5. Season by Region Analysis      5

Average Load Factors
Average load factors represent the number of passenger miles traveled as a proportion of available seat
miles. Higher average load factors represent more total passenger boardings. The average load factor at
SFB was 81.73, slightly lower than the U.S. average, 82.68, for 2015. Load factor statistics were derived
from the Bureau of Transportation Statistics (BTS) T-100 segment data for the years 2014 and 2015. A
summary of 2014 and 2015 average load factors is shown in Table 1.

5
    The Official Airline Guide (OAG)

6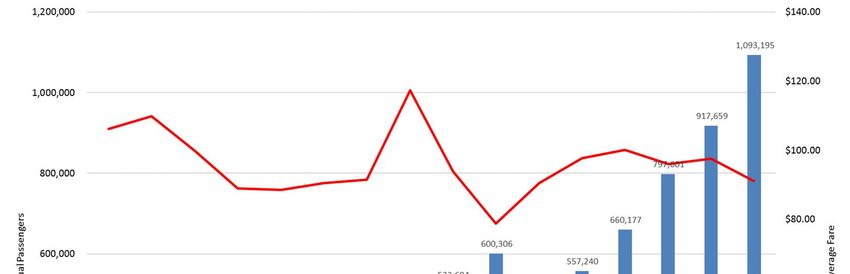
Table 1. Average Load Factor Analysis 6
                              Year        Domestic        International    Total
                                       Orlando-Sanford International
                              2014           87.73           64.79         83.87
                              2015           85.34           60.34         81.73
                                                All U.S. Airports
                              2014           84.49           81.03         82.69
                              2015           84.98           80.61         82.68

On-Flight Market Freight Statistics
Freight statistics represent the total number of pounds of freight, property other than mail and passenger
baggage, transported by air from a given airport. In 2015, SFB shipped 7,872 pounds of freight, a roughly
1,500-pound increase from 2014. A summary of 2014 and 2015 on-flight market freight statistics is shown
in Table 2. Freight statistics were derived from the Bureau of Transportation Statistics (BTS) T-100
segment data for the years 2014 and 2015.

                                            Table 2. SFB Freight7

                                        Year         Freight (in pounds)
                                        2014               6,321
                                        2015               7,872

6
    The Bureau of Transporta on Sta s cs (BTS) T-100 Table Data
7
    The Bureau of Transporta on Sta s cs (BTS) T-100 Segment Data

7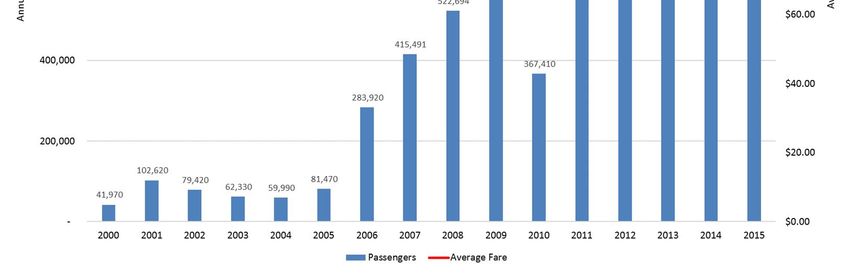
Market Leakage Study
Introduction
Florida has the highest number of large hub airports (4) of any state in the U.S. Florida also has many
commercial service airports (20), which compete for the same potential passengers. There are many
factors that play into the decision-making of passengers, ranging from cost-to-airport proximity to how
direct a flight is. Because of these factors, many smaller commercial airports in Florida experience market
leakage, or a loss of passengers who choose to drive further distances to airports for various reasons,
such as less expensive flights or more convenient flight options. For large airports located in large
metropolitan areas leakage may be a less significant factor because they still carry large numbers of
passengers. Conversely for smaller airports the loss of passengers to larger airports may potentially be
more significant. This analysis looks at tickets purchased in Florida zip codes to see which Florida airports
may lose business due to market leakage. The market leakage study analyzes zip codes from where a
ticket was purchased and subsequently which airport was departed from for that ticket purchase. To
better understand the market leakage findings, key demographic data are presented as part of the market
leakage study.

Metropolitan Statistical Area (MSA)
SFB is one of two commercial airports located in the Orland-Sanford-Kissimmee-Sanford MSA. According
to the U.S. Census, an MSA is “a geographic entity based on the concept of a core area with a large
population nucleus, plus adjacent communities having a high degree of economic and social integration
with that core.” Per this definition, looking at population, employment, and other important factors at the
level of an MSA, should prove beneficial in better understanding the area. Data are also analyzed at the
county level where appropriate.

Drive Time and Population Analysis
                                                           Table 3. Population Within 90 Minutes 8
Figure 6 displays the area around SFB that can
access the airport with a 90-minute or less drive                      Population Trends
    Figure 6. 90 Minute Drive Time      Area9           2010 Total Population                    3,730,688
                                                        2016 Total Population                    4,083,564
                                                        2021 Total Population                    4,423,744
                                                        2040 Total Population                    5,995,734
                                                        2016-2021 Annual Rate of Change            1.61%
                                                        2016-2040 Percent Change                    47%
                                                      time. Further, Table 3 displays the population of that
                                                      area in 2010 and 2016 as well as a projected
                                                      population of the area for 2021 and 2040. The
                                                      projected annual rate of change, or growth rate,
                                                      between 2016 and 2021 of the population in that area
                                                      is 1.61 percent. With this growth rate, this area is
                                                      expected to have a 47 percent growth in population by
                                                      the year 2040. Therefore, by the year 2040, it is
                                                      anticipated that 5,995,734 people will have a 90
                                                      minute or less drive time from their homes to SFB.

8
    U.S. Census Bureau, Census 2010 Summary – ESRI Housing Profile
9
    U.S. Census Bureau, Census 2010 Summary – ESRI Housing Profile

8
Therefore, it is anticipated that the demand for air service will increase proportionally in the future.

Income Levels
Income levels for the Orlando-Kissimmee-Sanford MSA depict a high population within the “middle class”
when compared to other MSAs in the state. The income in an area may impact the demand for air travel
in an area. In an area that has a comparatively high number of upper income households, more people
may be willing to pay more in order to travel a shorter distance to the airport. Conversely, in lower income
areas, people may be likely to drive a greater distance for air travel in order to capture reduced fares. A
summary of income data for the MSA is shown below in Figure 7.

                            Figure 7. MSA and Florida Income Comparison 10

25%

20%
                                                                                                  Orlando-
                                                                                                  Kissimmee-
15%                                                                                               Sanford, FL
                                                                                                  Metro Area

                                                                                                  Florida
10%

     5%

     0%
          Less than $10,000 $15,000 $25,000 $35,000 $50,000 $75,000 $100,000 $150,000 $200,000
           $10,000    to      to      to      to      to      to       to       to     or more
                    $14,999 $24,999 $34,999 $49,999 $74,999 $99,999 $149,999 $199,999

Employment
The type of employment that is located in an area may also have an effect on airline travel. For areas that
have a large number of companies that participate in professional and financial services, demand for local
air travel will likely increase because they may be less concerned about the cost of flights and more
concerned about ease of access to the airport. In most cases, differences will exist between the MSA and
the state averages, but these discrepancies are generally not large enough to impact commercial air
service demand. The Orlando-Kissimmee-Sanford MSA shows differences from the state average for
employment by industry group. Specifically, the MSA has a higher percentage of employment in the
entertainment/food and professional/administrative industries. This could be attributed to the high level of

10
     U.S. Census American Fact Finder

9
tourism and corresponding entertainment opportunities in the city of Orlando. Figure 8 on the following
page shows the breakdown of employment by industry.
Figure 8. Employment by Industry11
25%
20% Orlando-
Kissimmee-
15% Sanford, FL
Metro Area
10%
Florida
5%
0%
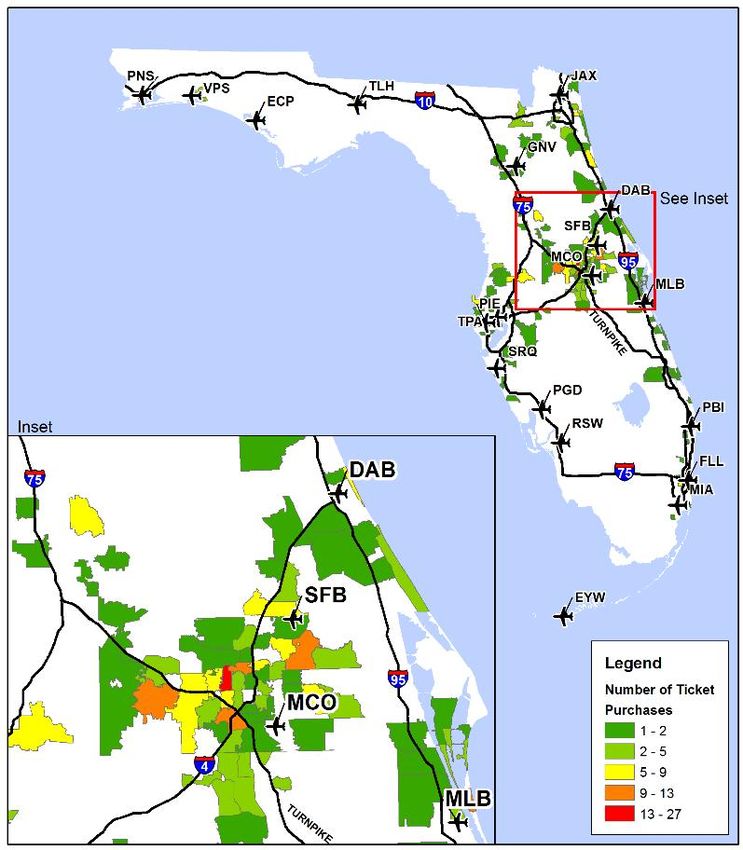
Market Leakage Figure 9. In-state Ticket Purchases 12
Figure 9 displays the zip codes in Florida
where tickets for flights departing from SFB
were purchased. This graphic shows the
purchases of tickets primarily in the area
surrounding SFB. However, tickets have been
purchased for SFB flights from all over the
state of Florida. Some areas with noticeable
aggregations of ticket purchases include
Jacksonville and Tampa. The majority of
tickets purchased for SFB flights were
purchased from in-state locations. Only ten
percent of ticket purchases were made from
out-of-state locations. Other states where SFB
ticket purchases were made include:
· Georgia – 2%
· Texas – 1%
· North Carolina – 1%
· Tennessee – 1%
Based on the market leakage analysis, the
Orlando-Sanford International Airport market
leaks a large number of passengers to Orlando
11
U.S. Census American Fact Finder
12
Airline Repor ng Corpora on (ARC)
10International Airport.
Figure 10. In-state Ticket Purchases 13
Based on the analysis,
(Represented as a Percentage of the Departing Airports Total Enplanement
of all passengers
Volumes in 2015)
departing from
7.0%
Orlando International
Airport, 5.9 percent 5.9%
6.0%
were from Seminole
County. Due to the
5.0%
limited amount of data
reported for Orlando- 4.0%
Sanford International
Airport, it is not 3.0%
possible to determine
if Orlando-Sanford
25,951 108 141
2.0%
International Airport
receives passengers 1.0% 0.8%
from other counties in 0.1%
the surrounding area 0.0%
that have commercial Orlando Jacksonville Daytona Beach
air service. Figure 10
illustrates the three top airports that receive leaked passengers from Orlando-Sanford International
Airport. The values presented represent the number and percent of passengers who purchased their
ticket from a Seminole County zip code but flew out of an alternative airport. Data presented are from a
10 percent sample from all months of 2015. 13
13
Airline Repor ng Corpora on (ARC)
11You can also read