STRATEGY VISUALIZATION USING PAST ELECTION RESULTS
←
→
Page content transcription
If your browser does not render page correctly, please read the page content below
© 2021 JETIR April 2021, Volume 8, Issue 4 www.jetir.org (ISSN-2349-5162)
STRATEGY VISUALIZATION USING PAST
ELECTION RESULTS
1
K. MAHALAKSHMI, 2M. KARTHIKA
1
Assistant Professor, 2UG Research Scholar,
1
Department of B. Com (Business Analytics),
1
PSGR Krishnammal College for Women Coimbatore, Tamilnadu, India.
Abstract:
The Election Voting Systems Assessment is an unprecedented project premised on a collaborative approach that ensures
greater citizen input through partnerships within the academic community, public interest organizations, and with policy makers.
The total voting between different Regions in India with their strategies are taken to analyze the best strategy to win the current
trend election. The strategies are taken into the account for the accurate result. This analysis helps the party to win the current
election.
Keywords: Strategy visualization, winning parties, python.
I. INTRODUCTION
Data visualization is that to observe data by placing it during a visual context in order that patterns, trends and
correlations are often exposed by detection them. Python allows us to create extraordinary visualizations easily and
quickly using Matplotlib and Seaborn. Regular visualization helps to mainly concentrate on one’s dream. The main
problem with people is the easily get distracted and incorporate with their goal. W hen you visualization on a regular basis,
especially when you segregate a constant time every day, you might focus very well. A good visualization should establish
two aspects of the data being presented: picturise the relation between the data that are co mplicated to explain. Should
made convenient for the audiences to recognize the data content and consider the outcomes from the data.
The benefits of data visualization
Better analysis.
Quick action.
Identifying patterns.
Finding errors.
Understanding the story.
Exploring business insights.
Grasping the Latest Trends.
Data visualizations make big and small data easier for the human brain to understand, and visualization also makes it easier
to detect patterns, trends, and outliers in groups of data.
II. RELATED WORK
The authors trace the tradition of measuring voting behavior in India from a historical perspective, starting with the
Poona Lok Sabha electoral district study in 1967. They move on to discuss in great detail the method of surveying the voting
behavior that has been widely used in the 1990s and beyond.[2] The election system isn't only seen in India, it are often seen
altogether countries of the planet. The successful administration of the government is also decided by the electoral system. Even
though it is a standard system in India, many changes have still been made to it itself, and it is now India's most advanced
progressive system. The election system in India has many features, such as adult franchises, electoral district reservations,
appointments, etc. In India, our electoral system is an extremely strong administrative machinery that conducts elections on a
regular basis. [3] Voting is one of the most frequently used words in democratic politics. Voting is that the life and soul of
democracy because it's through elections the people elect their representatives, forms their government. Citizen uses voting as a
means for communicating his endorsement or objection to governmental decisions, policies and programmers of various political
parties.. An empirical study of the determinants which inspire and influence the voters to exercise his right to choose favour or
against a specific candidate is influenced by various factors like gender, race and pressure groups in invoking religious and
communal factors, the influence of cash or charismatic personality of a pacesetter . The main purpose of the present study is to
focus interest on voting behaviour in India and to emphasize the factors that determine the voting behaviour in India. [9] Election
studies are a distinct sub-genre of democratic studies which, so to speak, focus more on the 'mechanics' than on the 'substance' of
representative democracy. This sub-genre, which is relatively more visible than other studies of representative democracy, has
specific implications, both academic and political, which have been the focus of this critical review of the literature on Indian
elections since the 1980s. [6] Using this, we will find interesting patterns that are extracted and represented using Visual Data
Processing to reorder the awareness program. The approach is split into 5 phases: I) Data Preprocessing: II) Data Warehouse
Creation: III) Task-Relevant Data Extraction; IV) data processing and V) Visualization. In Data Warehouse Creation phase,
warehouse with vote as measure actually and voter Gender, voter age, voter education, candidate, Religion, time, session, word as
dimension. Word dimension has a four-level concept hierarchy of country, state, city, area/word id. The results of the data mining
phase are represented in the last phase using Visual Data mining techniques. [10] The Constitution of India has provided the
JETIRER06033 Journal of Emerging Technologies and Innovative Research (JETIR) www.jetir.org 135
© 2021 JETIR April 2021, Volume 8, Issue 4 www.jetir.org (ISSN-2349-5162)
Indian Election Commission with the authority, direction and control of the entire process for the conduct of elections to the
Parliament and the legislature of each State and the offices of the President and Vice-President of India. [8] Measuring Voting
Behaviour in India captures the dynamics of multiple methodologies used for measuring voting behavior in India within the past
and present. The authors expand on the various approaches used to assess the views, behaviors and beliefs of the electorate. They
address the benefits and disadvantages of each form of gathering the multiplicity of electoral experience of multiple voters
through various settings in India. This they accomplish utilizing their long experience of conducting national- and state-level
election surveys in India and by simultaneous studies using different methodologies. [5] Data visualization involves presenting
data in graphical which makes the knowledge easy to understand. It helps to elucidate facts and determine courses of action.
It will benefit any field of study that needs innovative ways of presenting large, complex information. The advent of
computer graphics has shaped modern visualization. [7] The start of any data visualization depends on the data set and what
we want to know. Broadly speaking, there are five main questions we will ask.
• How does that one thing correspond to another?
• How is that data linked to other data?
• How is that data scattered?
• How is this data composed of,
• How does the data appear on a map? [1]
Interactive visualizations and knowledge graphics are getting an inseparable a part of modern medium also as digital
media like newspapers, magazines, online news websites, blogs, discussion forums and social media. [4]
III. METHODOLOGY
In this paper Strategy Visualization is using Python programming language.
VISUALIZATION:
Data visualization is the act of obtaining information and visually representing it using graphical elements such as graph
or table. Data visualizations, irrespective of size of the data, they can be made in a such a way that they are easily understandable
and visualization also make it easier to detect patterns, trends, and outliers in group of knowledge . To make sure you've got a
clean and complete set of knowledge to figure with. If there are some irrelevant elements added they will directly reflected in the
output. Data visualization is basically needed for any career; from teachers trying to form sense of student test results to computer
scientists trying to develop subsequent big thing in artificial intelligence, ultimately the data visualization makes data easily
accessible and understandable to everyone irrespective of their knowledge in computer.
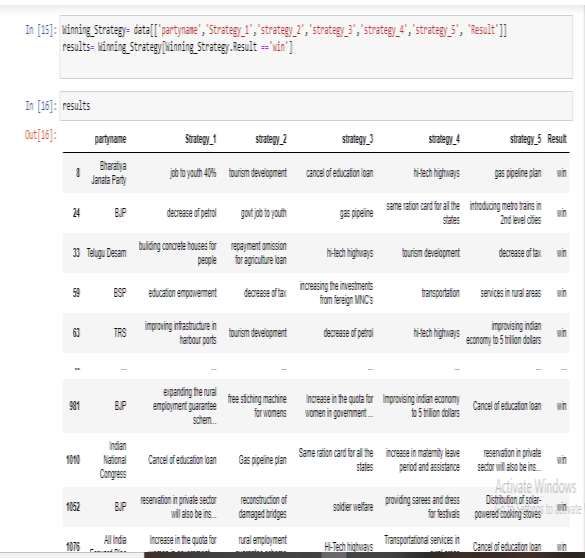
FIG 1.1
JETIRER06033 Journal of Emerging Technologies and Innovative Research (JETIR) www.jetir.org 136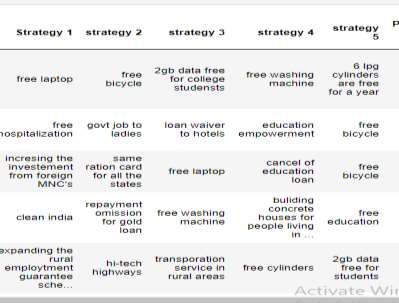
© 2021 JETIR April 2021, Volume 8, Issue 4                                                   www.jetir.org (ISSN-2349-5162)

WINNING STRATEGIES:
        There are some strategies used by the several parties. In the past elections results the parties used some good strategies
which help them to win the election

                                 WINNING STRATEGIES

                                HIGH-TECH HIGHWAYS

                                  TRANSPORTATIONAL
                                  SERVICES IN RURAL
                                  AREA

                                      INCREASING THE
                                      INVESTMENT FROM
                                      FOREIGN MNC’s

                                      INTRODUCING METRO
                                      TRAINS IN 2nd LEVEL
                                      CITIES.

                                      IMPROVISING INDIAN
                                      ECONOMY IN TO 5
                                      TRILLION DOLLAR

JETIRER06033        Journal of Emerging Technologies and Innovative Research (JETIR) www.jetir.org                         137
© 2021 JETIR April 2021, Volume 8, Issue 4 www.jetir.org (ISSN-2349-5162)
IV. RESULT AND DISCUSSION
In the above image are visualizing the strategies used by the winning parties. Taking the past two elections (2009-2014)
results into account; analyzing their winning/losing ways and visualizing the Comparison through a table therefore, predicting the
strategy used by winners and it is useful for present candidates who participate in current elections.
FIG 1.2
V. CONCLUSION
In this paper Strategy Visualization is done using the Python programming language. In the analysis we found that
winning strategies may help in the current election situation. Before suggesting the usage of winning strategies we must need
the people’s opinion about those strategies to check whether the strategies are useful in real life or not. So by this project we
suggest that using the winning strategies of the past election may be very helpful for the current election system and the
people.
REFERENCES:
[1]GayatriSunkad, Department of Political Science, Shri Kalidas Degree College, Badami, Bagalkot, Karnataka,
India.gayatri.sunkad@gmail.com
[2] Hardeep Kaur Assistant Professor, Department of political science B.L.M Girls College, Nawanshahr Punjab,India.
[3] https://www.researchgate.net/publication/332101051
[4] India 2014 A Reference Annual, Publications Division, Ministry of Information and Broadcasting, Government of India; P.67
[5] Kuhu Gupta, Shailaja Sampat, Manas Sharma, Venkatesh Rajamanickam* *Corresponding author: Venkatesh Rajamanickam,
IIT Bombay, IDC, IIT Bombay, Powai, Mumbai-400 076, India, venkatra@iitb.ac.in, +91 750 636 5826
[6] Matthew N. O. Sadiku1 , Adebowale E. Shadare 2 , Sarhan M. Musa 3 and Cajetan M. Akujuobi 4 1, 2, 3 Roy G. Perry
College of Engineering, Prairie View A&M University Prairie View, TX 77446 USA 4 Office of the Vice President for Research
and Dean of Graduate School, Prairie View A&M University Prairie View, TX 77446 USA
[7] Prof. T. M. Kodinariya Asst. Professor, Department of Computer Engineering, Atmiya Institute of Technology & Science,
Rajkot Gujarat, India trupti.kodinariya@gmail.com
[8] Sage, IndiaCentre for the Study of Developing Societies, Delhi Measuring Voting Behaviour in India April 2013
[9] Sanjay Kumar - Director, Centre for the Study of Developing Societies (CSDS), New Delhi Praveen Rai - Academic
Secretary, Centre for the Study of Developing Societies, Delhi
[10] Stéphanie Tawa Lama-Rewal https://doi.org/10.4000/samaj.2784
JETIRER06033 Journal of Emerging Technologies and Innovative Research (JETIR) www.jetir.org 138You can also read