Chile Formal Presentation R-PP March 2013, Washington D.C. United States - Forest Carbon Partnership Facility
←
→
Page content transcription
If your browser does not render page correctly, please read the page content below
Chile
Formal Presentation R-PP
March 2013, Washington D.C. United States
Chile Formal Presentation R-PP March 2013, Washington D.C. United States
Contents

           1. Chile and its forests
           2. Institutional arrangements on climate change
           3. Institutional arrangements on REDD+
           4. Dissemination plan
           5. REDD + strategy
           6. Reference levels
           7. Monitoring systems
           8. Budget
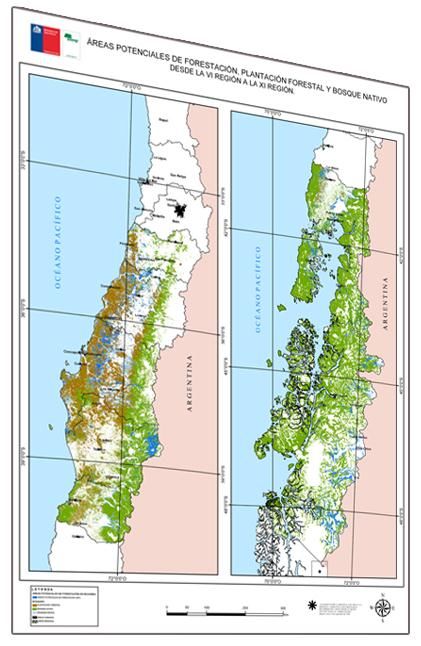
1. Chile and its forests

                                                                              Population / Población
    16.572.475
people / habitantes        48,6% hombres (men)                     51,4% mujeres (women)

                       13,5 million    22% of surface covered by
                       Native forest   forests
                                                                                        75.625.200 ha.
         2,6 million                                               National surface /Superficie nacional
              Exotic
         plantations

                                                       Chilean surface/Superficie Chile

          3,1%
Forestry sector                        Gross Domestic Product (GDP)

          7,8%
Forestry sector                        Exportations
1. Chile and its forest

      Forests surface by type and comparison from 1997 to 2011

                                       Forests type                    1997               2011

                                    Native forests                        13.430.602       13.599.610
                                    Adult Forest                              5.977.839     5.912.235
                                    Young Forest                              3.585.746     3.808.769
                                    Mix Forest                           861.925            892.822
                                    Shrubs Forest                             3.005.092     2.985.784
                                    Forest Plantations                        2.119.005     2.620.486
                                    Forest Plantations and native         87.626            123.756
                                    Protection                                               81.502
                                    Total                                 15.637.233       16.343.852

     Source: Land Cover Register of Chilean Forest Resources (2011).
1. Chile and its forests

National Inventory of Greenhouse Gas (GHG) Sources and Sinks (Second National Communication 2011)

2. Institutional arrangements on climate change

                      National Advisory Committee on Global Change

  Chairman                                       Ministry of Environment

Vice Chairman                  Director of Special Policy of the Ministry of Foreign Affairs

                                Ministry of Agriculture

                                Naval Hydrographic and Oceanographic Service

                                National Committee on Energy
A representative of
                                National Office of Maritime Territory and Merchant Navy

                                Chilean Meteorology Service

                                National Committee on Scientific and Technological
                                Research
                                Chilean Academy of Sciences
2. Institutional arrangements on climate change

                     Law Decree
                    N°701 of 1974
                    (forestation)                        MDL

  Law N°20.283                               REDD+                    NAMAs
  of 2008 (native
       forest
  management)

                                                                               Platform for the
                                                      New peak of              Generation and
                      Forest                           forests for            Trading of Forest                  Plan
 Private                             Challenge and
                                                     carbon capture                Carbon         Contribution
Industry              Sector         opportunity
                                                      and storage             Credits (PBCCh)
                                                                                                                 2020

        Other
      agents…
        other
      inputs…
                    GEI Mitigation
                     Not as the
                    main objective
3. Institutional arrangements on REDD+

     SAG        ODEPA             INFOR      CIREN              INDAP               CONADI

   Academic                                                                       Group
                                                                                 National
    Sector                                                                      Technical
                                                                                 Group of
                                                                               National de
                                                                                 Experts
                                                                                 Experts

Native People
Organizations

 Small-size       Big-size Land
Land owners          Owners                ADVISORY COUNCIL ON NATIVE FOREST
Organizations     Organizations
                                            REGIONAL GOVERNMENTS

                                                TOWN COUNCILS
3. Institutional arrangements on REDD+

                            National Group of Experts (GTNE)

                                              PWC CHILE       Department of Climate Change of
                                                              the Environmental Ministry
             TEMPORAL                        1
            CONSULTANS   11                               2
              MEMBERS                                                            THE NATURE
                                                                                 CONSERVANCY (TNC)
                                                                             3

    POCH
AMBIENTAL   10

                                                                                        4   CLIMATE EXCHANGE
                                                                                            MARKET OF SANTIAGO
                                                                                            (SCX)
        ODEPA
                9
                                                                                  5
                                                                                      PATAGONIA SUR

                                 8
            VERIFIED CARBON                                   6
                   STANDARD                   7                FUNDACIÓN
                   (VCS)-Chile                                 CHILE
                                     LESSCARBON
4. Dissemination plan
Forests and Climate Change Group of CONAF Target Group
REGION NAME
XV Guillermo Cisternas
Forests Owners
I Sergio Barraza
II Nancy Cortés Rural Communities (others than native
III Felix Avaria people)
IV Rafael Medina
Indigenous Peoples
V Juan Carlos Ramos
VI Hugo Barrueto
Information Spread, Territorial Organizations
Feedback,
VII Norma Retamal
Participation Academic Sector
VIII Alejandro Canales
IX Héctor Muñoz
Organizations related to Climate Change
XIV Ernesto Weil NGOs
X Jaime Garrido
Private Sector
XI Marco Narváez
XII Pamela Duhalde Governmental Institutions
RM Carlos Ravanal Others
Workshops, meetings, training,
brochures, newspapers and Web
advertisement, field trips, others4. Dissemination plan
At this moment
Planned meetings to provide information on strategies of forest management, climate change,
Meetings
PBCCh and REDD+, according to each target group
Regions Rural
Rural Organizations of Organizations Public Sector Number of
Private
indigenous (others than Institutions and NGOs Total meetings
Sector
communities indigenous Universities Nov-Dec 2012
communities)
Arica y Parinacota 11 0 1 1 0 13 2
Tarapacá 10 2 0 10 0 22 2
Antofagasta 7 3 5 10 0 25 Report in progress
Atacama 4 3 1 2 0 10 Report In progress
Coquimbo 0 14 0 2 0 16 3
Metropolitana 0 2 2 6 5 15 9
Valparaíso 0 18 3 10 1 32 Report in progress
O'Higgins 0 0 2 1 0 3 Report in progress
Maule 0 0 5 2 0 7 2
Bíobío 17 11 0 0 0 28 Report in progress
La Araucanía 20 13 0 1 2 36 14
Los Ríos 4 7 1 5 1 18 Report in progress
Los Lagos 2 4 1 1 0 8 5
Aysén 0 1 0 2 0 3 Report in progress
Magallanes 1 4 7 13 1 26 Report in progress
Total 76 82 28 66 10 262 374. Dissemination plan
2011 2012 2012 2012
May 10th April 10th May 4th October 30th
Chilean Swiss International Presentation R-PP
delegation delegation Conference on in Congo
visits the USFS visits Chile Climate Change
strengthening planning of organized by
of the MRV NAMA CONAF
system
Visit to http://www.conaf.cl/destacado-
USDA http://www.elurbanorural.cl/ chile_muestra_a_nivel_internacio
Washington index.php?subaction=show nal_sus_avances_en_carbono_fo
D.C. full&id=1334094614&archi restal-1735.html
ve=&start_from=&ucat=10 http://issuu.com/technopre
sss.a./docs/lignum_135?m
ode=window&background
Color=%23222222
http://www.chileagricola.us/
Estatica/Actividades.html4. Dissemination plan
2012 2012 2012 2012
September 24th November 5th November 7th November 16th
Workshop at Workshop for Presentation of Lectures for
CONAF small size forest Forest NAMA children at
analysis of owners and in Panama schools in
capacities experts from Santiago
the Agriculture
Ministry at
Aysen – 11th
Region
http://www.conaf.cl/destacado-
http://www.rln.cl/noticias/37 conaf_dijo_presente_en_encuent
57-se-realizo-taller-sobre- ro_con_estudiantes_por_cambio
el-mercado-y-los-bonos- _climatico-1764.html
de-carbono-a- http://www.conaf.cl/destacado-
productoresas-forestales chile_sirve_de_ejemplo_a_pais
es_de_latinoamerica_y_el_cari
be-1745.html
http://www.iciforestal.com. http://www.vientopatagon.c
uy/la-region/615--cmpc-to- l/2012/11/se-realizo-taller-
increase-brazilian-bek- sobre-el-mercado-y.html
capacity4. Dissemination plan
2012 2012 2013
November 20th November 26th January 4th
Official Presentation of CONAF works
registration of the Strategy of with Universities
Forest NAMA at Forests and to generate
the Secretariat Climate Change in allometric
of CMNUCC Chile to countries functions
of Central America
and El Salvador
http://www.ladiscusion.cl/index.php/notic
ias/noticias964883477/nuble113675123
7/21268-estudian-capacidad-de-
http://www.conaf.cl/destacado- captura-de-carbono-en-especies-
chile_comparte_estrategia_de locales
_bosques_y_cambio_climatico
_con_paises_de_centroameric http://www.lignum.cl/noticias/?id=26225
a-1769.html
http://www.conaf.cl/destacado-
conaf_fia_y_la_universidad_mayor_for
http://www.lignum.cl/noticias/?id man_alianza_para_el_desarrollo_de_es
http://unfccc.int/cooperatio tudios_sobre_captura_de_carbono_de_
n_support/nama/items/698 =25925
bosques_mediterraneos_de_chile-
2.php 1821.html
http://www.fia.cl/ListadoNoticias/Noticias
/tabid/139/ArticleID/546/Estudio-
determinar%C3%A1-la-captura-de-
carbono-de-los-bosques-
mediterr%C3%A1neos-de-Chile.aspx4. Dissemination plan
2013 2013 2013
January 15th January 28th January 29th
Signing of Note on the strategy of Workshop CONAF-VCS
Cooperation forests and climate and Universities
Agreement between change in Chile in
CONAF and VCS Ecosystemmarketplace
international
http://www.pointcarbon.com/news/1.2108043
http://www.ecosystemmarketplac http://www.conaf.cl/destacado-
http://www.tecnologiambiental.es/index.php/actu e.com/pages/dynamic/article.pag conaf_avanza_en_el_desarroll
alidad/2983-conaf-y-vcs-anuncian-un-convenio- e.php?page_id=9571§ion=n o_de_tipologias_forestales_de
jnr-con-un-gobierno-nacional-por-primera-vez- ews_articles&eod=1 _proyectos_de_captura_de_ca
en-el-mundo.html rbono-1859.html
http://www.conaf.cl/destacado-
chile_avanza_para_contar_con_bonos_de_carb
ono_para_transar_a_nivel_mundial-1808.html
http://www.litoralpress.cl/design3/lpi/pdf3/litoralpr
esspdf.aspx?id=24854566&idT=9901&org=CON
AF&carp=conaf&ve=0
http://www.ecoticias.com/eco-
america/74355/Chile-avanza-ingresar-mercado-
bonos-carbono-/5. REDD + strategy
Macro diagnosis (positive view):
1 The deforestation process is not 2 There is a legal system, 3. There is a historic system of
the main problem. The focus is regulations and procedures information and monitoring of the
forest degradation. defined for the forest sector… forest resource… however, it
evidently, requires regular needs to be standardized and
improvements enhanced
Description of
the degraded Improved management “(+)”
of the forest resource
National forests
definition of
degradation Causes of degradation at
local level
Options to stop the causes
of degradation
Description of
owners of
degraded
forests5. REDD + strategy
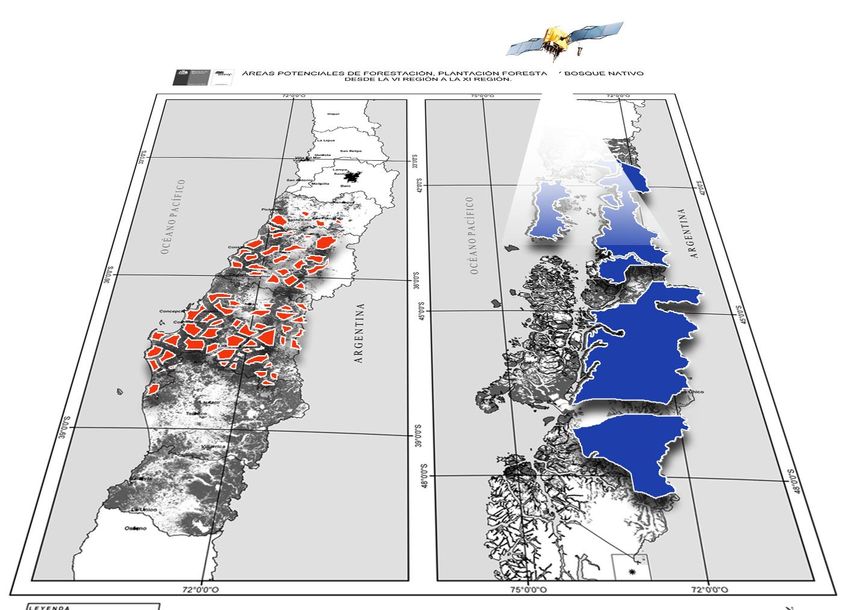
Forest plantation of QUESTIONS TO BE CONSIDERED IN DEFINING TYPOLOGIES FOR
Prosopis FOREST CARBON PROJECTS
(I –II Region)
Forestation of Atriplex (IV Which are the expected CO2 levels of capture for each type of project?
Region)
How is the capture going to be estimated and monitored after the
implementation of the project?
Enhancement of
Mediterranean Forest
(IV a VI Region) Which are the edafoclimatic and forest (in terms of type) conditions for the
project?
Exotic Forest
Plantations (V-IX Which are the possible forest activities or technical dispositions to carry out?
Region)
Are each one of the project types really additional?
Enhancement of disturbed
native forest How is the permanence of the stock of carbon going to be solved?
(VIII-X Region)
Which are the social and environmental impacts that (intentional or
Management of young trees unintentional) each type of project can cause?
forests
RO-RA-CO / Canelo
(VIII-X Region)
Alerce conservation
(X Region)
Forestation at Patagonia
region
(XI-XII Region)5. REDD + strategy
100
hectares
Present situation for any Projected situation under
person interested on the typologies:
project:
• Prove additionality • Reference levels ok
• Levels of reference. • Monitoring ok
• Monitoring • Decisions on forest
management ok
• Decisions on forest
management • Management Plan ok
• Regular Management • Diffusion, ok
Plan
• Diffusion
= Low trading costs,
decisions based on
previous
= High trading costs,
experiences, less
complex decisions, 100.000 hectares
time
time (sub-national level)5. REDD + strategy
1. Analysis of the current national initiatives on forestry promotion (regulation
on forestation and native forests recovery) under the context of REDD+.
2. A larger number of professionals working directly with owners.
3. Enhance the enforcement of forest rules and regulations, avoiding illegal
logging.
4. Land tenure regularization.
................................. and more.6. Reference levels
Land Cover Register of Chilean Forest
Resources administered by CONAF
from 1997
Sectorial statistics
administered by CONAF,
INFOR, CORMA, among Dendro energy and Carbon
other relevant institutions Monitoring System,
operating from the 4th to the
12th Regions
Inputs
Demographic, economic
and social statistics.
National Institute of National Extensive Forest
Statistics Inventory – 1996-1997
Universidad Austral
Project MAPS Chile Emission Factors
(Allometric Functions)7. Monitoring system
Socio- economic Impacts Dynamic / Growing
12 1
Volume
Risks / Vulnerability
11 2
Water Forest fires
Regulation 10 3
Biodiversity 9
4 Pests
8 5
Degradation Biomass
7 6
Deforestation Carbon
Forest Monitoring8. Budget
Costs estimated in thousands of US$ TOTAL BY
Components Sub-components Sub Total
2012 2013 2014 2015 COMPONENT
1a. Institutional 115 195 255 255 820
Component 1 1b. Dialogue 235 295 295 295 1.120 3.010
1.c Diffusion 215 285 285 285 1.070
2a. Evaluation 310 495 510 520 1.835
2b. Strategy 185 840 810 790 2.625
Component 2 2c. Execution Framework 180 455 430 345 1.410 6.960
2d. Environmental and social
impacts 130 320 320 320 1.090
Component 3 3. Reference Levels 40 375 665 335 1.415 1.415
4a. Monitoring System - 680 670 600 1.950
Component 4 2.030
4b. Multiple Benefits - 80 - - 80
Component 6 6.- Monitoring and Evaluation
265
::::::::::::::::::::::::::::::::::::::::::::::::::::::::::::Framework - 195 35 35 265
TOTAL BY YEAR 1.410 4.215 4.275 3.780 13.680 13.680
Costs estimated in thousands of US$
Contributors Total
2012 2013 2014 2015
National Government 434 1.824 1.475 1.186 4.919
FCPF 394 836 1.145 1.226 3.600
Private Industry 253 699 832 607 2.391
Others to be determined
329 857 824 762 2.770
(NAMA)
TOTAL 1.409 4.215 4.276 3.781 13.680Thank you
Thank you
You can also read