SECURING ECONOMIC RECOVERY BEYOND COVID 19 - National ...

Page created by Edgar Fitzgerald
 
CONTINUE READING
SECURING ECONOMIC RECOVERY BEYOND COVID 19 - National ...
SECURING ECONOMIC RECOVERY BEYOND COVID‐19
SECURING ECONOMIC RECOVERY BEYOND COVID 19 - National ...
Overview

  Government’s medium‐term policy priorities are economic recovery and fiscal
   consolidation.
  The social compact agreed to between government, business, labour and civil
   society prioritises short‐term measures to support the economy, alongside
   crucial structural economic reforms.
  The economy is expected to contract by 7.8 per cent in 2020, recovering to
   real GDP growth of 3.3 per cent in 2021. Economic growth is expected to
   average 2.1 per cent over the three‐year forecast period.
  Fiscal measures – primarily reductions to the wage bill – will narrow the
   budget deficit and stabilise debt over the next five years to return the public
   finances to a sustainable position.
  The consolidated deficit narrows from 15.7 per cent of GDP in 2020/21 to
   7.3 per cent by 2023/24. Gross national debt is projected to stabilise at
   95.3 per cent of GDP by 2025/26.

                                        1
SECURING ECONOMIC RECOVERY BEYOND COVID 19 - National ...
Global economic recovery is expected to be long
and uneven
Table 2.1 Economic growth in selected countries
 Region/country                     2018       2019    2020            2021         2020          2021
                                                         Projections          Difference from June 2020
 Percentage                                Actual                                     Projections
 World                               3.5       2.8     ‐4.4            5.2             0.8         ‐0.2
 Advanced economies                  2.2       1.7     ‐5.8            3.9             2.3         ‐0.9
  United States                      3.0       2.2     ‐4.3            3.1             3.7         ‐1.4
  Euro area                          1.8       1.3     ‐8.3            5.2             1.9         ‐0.8
  United Kingdom                     1.3       1.5     ‐9.8            5.9             0.4         ‐0.4
  Japan                              0.3       0.7     ‐5.3            2.3             0.5         ‐0.1
 Emerging and                        4.5       3.7     ‐3.3            6.0            ‐0.2          0.2
 developing countries
   China                              6.7       6.1     1.9            8.2            0.9           –
   India                              6.1       4.2   ‐10.3            8.8           ‐5.8          2.8
   Brazil                             1.3       1.1    ‐5.8            2.8            3.3         ‐0.8
   Russia                             2.5       1.3    ‐4.1            2.8            2.5         ‐1.3
  Sub‐Saharan Africa                  3.3       3.2    ‐3.0            3.1            0.2         ‐0.3
  Nigeria                             1.9       2.2    ‐4.3            1.7            1.1         ‐0.9
               1
  South Africa                        0.8       0.2    ‐7.8            3.3           ‐0.6          0.4
  World trade volumes                 3.9       1.0   ‐10.4            8.3            1.5          0.3
1
  National Treasury forecasts
Source: IMF World Economic Outlook, October 2020
 Containment of COVID‐19 is expected to support an improving growth outlook in advanced
  economies in 2021.
 Developing countries are set to grow faster than their developed counterparts next year.
                                                                2
SECURING ECONOMIC RECOVERY BEYOND COVID 19 - National ...
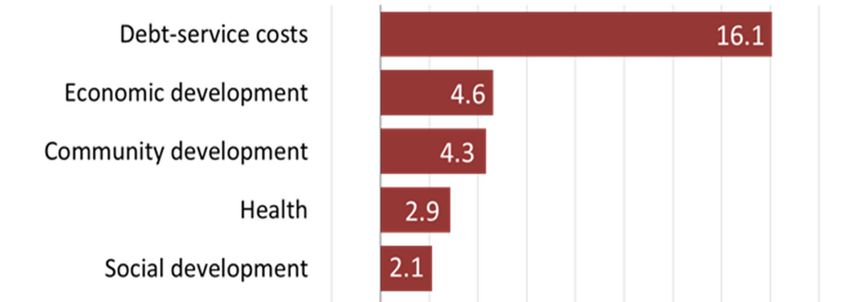
Domestic economic outlook

Table 1.1 Macroeconomic projections
                                                 2019      2020      2021      2022      2023
 Calendar year                                  Actual   Estimate            Forecast
 Percentage change unless otherwise indicated
 Household consumption                             1.0     ‐7.9        4.7      2.2        1.9
 Gross fixed‐capital formation                    ‐0.9   ‐19.6        ‐1.4      3.9        3.9
 Real GDP growth                                   0.2     ‐7.8        3.3      1.7        1.5
 GDP at current prices (R billion)              5 078    4 885      5 240    5 553      5 877
 CPI inflation                                     4.1      3.2        4.1      4.4        4.5
 Current account balance (% of GDP)               ‐3.0     ‐0.8       ‐1.6     ‐2.0       ‐2.7
Source: Reserve Bank and National Treasury

 Following a sharp, synchronised 2020 COVID‐19 recession, SA real GDP growth will
  average 2.1 per cent over the medium term, with output only returning to pre‐
  pandemic levels in 2024.
 The main risks to the economic outlook are weaker‐than‐expected growth, continued
  deterioration in the public finances and a failure to implement structural reforms.
 A second wave of COVID‐19 infections, accompanied by new restrictions on economic
  activity, would have significant implications for the outlook.
                                                          3
The COVID‐19 fiscal relief package

 Main budget non‐interest spending increased by R36 billion in the current year
  compared with 2020 Budget estimates, including COVID‐19 fiscal relief package
  allocations to critical frontline services.
 The state’s contingent liabilities increased through a R200 billion credit
  guarantee scheme for firms. In addition, the June 2020 special adjustments
  budget made provision for additional tax relief of R70 billion and temporary
  unemployment relief of R40 billion.
 By the end of September, R47.4 billion had been paid to 10.6 million
  beneficiaries from over 931 000 employers through the temporary
  employer/employee relief scheme.
 The Reserve Bank has also provided support to households and firms by
  lowering the main interest rate (the repurchase rate) by 2.75 percentage points
  since March 2020.
 Details on the take‐up and effects of tax relief measures will be provided in the
  2021 Budget Review.
                                         4
The economic recovery plan

 Working with its social partners in business, labour and civil society, government
  has begun implementing an economic recovery plan, with immediate measures
  to boost confidence and investment, and longer‐term reforms to promote
  sustained higher economic growth.
 In the short term, the economic recovery plan will focus on building
  infrastructure, expanding electricity generation, allocating digital spectrum, and
  supporting rapid industrialisation and employment.
 At the same time, government will roll out structural reforms such as
  modernising network industries, reducing barriers to entry, and increasing
  regional integration and trade. The National Treasury estimates that, in
  combination, these reforms can raise growth to over 3 per cent over the next
  10 years and create more than 1 million jobs.
 The Infrastructure Fund will complement the plan’s focus on capital investments.
 Operation Vulindlela implementation unit will be staffed by a full‐time technical
  team that draws on additional expertise and capacity in the public and private
  sectors.
                                          5
Revenue outlook

 Table 3.4 Revised revenue projections
  R billion                                      2020/21    2021/22    2022/23    2023/24
  2020 Budget                                     1 425.4    1 512.2    1 609.7
    Buoyancy                                         0.93       1.00       1.01
  2020 special adjustments budget                 1 121.3    1 291.4    1 394.0   1 508.9
    Buoyancy                                         3.23       1.58       1.46      1.33
  Revised estimates                               1 112.6    1 279.5    1 392.2   1 503.2
    Buoyancy                                         3.18       1.59       1.50      1.35
  Change since 2020 Budget                         ‐312.8     ‐232.7     ‐217.5
  Change since 2020 special adjustments budget       ‐8.7      ‐11.9       ‐1.8      ‐5.7
 Source: National Treasury

 The extraordinary shock to economic output in 2020/21 translates into large revenue
  shortfalls that will persist over the medium term.
 Although overall buoyancies appear relatively large up until the end of the MTEF
  period, this reflects a slow improvement in the tax‐to‐GDP ratio after the large once‐off
  decrease in 2020/21.
 The tax‐to‐GDP ratio is only expected to recover to the 2019/20 level by 2027/28.

                                                      6
South Africa in global context

Average primary balance, 2009 – 2019                                              Projected three‐year increase in debt
                  2                                                                         Pakistan
                                                                                            Uruguay
                                                                                                Egypt
Per cent of GDP

                  1                                                                           Belarus
                                                                                            Hungary
                                                                                            Malaysia
                  0                                                                           Croatia
                                                                                            Morocco
                                                                                            Sri Lanka
                  ‐1                                                                         Ukraine
                                                                                                  Peru
                  ‐2                                                              Dominican Republic
                                                                                               Poland
                                                                                                 Chile
                  ‐3                                                                            Brazil
                                                                                               Turkey
                                                                                            Thailand
                  ‐4                                                                       Colombia
                                                                                                 India
                                 Brazil
                                  India

                                  Chile

                        Dominican Rep.
                              Pakistan
                             Malaysia

                                   Peru
                              Hungary

                           Philippines
                               Belarus
                             Sri Lanka
                          South Africa

                               Ukraine

                                Turkey
                                 Egypt

                             Morocco

                               Croatia

                              Thailand
                                 China

                                Poland

                             Colombia

                              Uruguay
                                                                                          Philippines
                                                                                                China
                                                                                        South Africa

                                                                                                         ‐5   0   5      10         15   20   25
                                                                                                                  Per cent of GDP
                       Source: IMF Fiscal Monitor, October 2020

                      In comparison with a wide range of other developing countries, South Africa’s average primary balance over the
                       last 10 years falls in the middle of the distribution.
                      But South Africa’s three‐year increase in debt to GDP is the among the largest.
                      Fiscal distress is mounting in developing countries amid historically high indebtedness. In this environment of
                       rising fiscal pressures, South Africa is losing ground to its peers.
                                                                              7
Fiscal metrics are deteriorating

 Over the past five years, the fiscal environment has been characterised by:
  Interest payments absorbing a growing share of limited public resources,
   which increasingly crowds out spending on social and economic investment.
   Debt‐service costs are now 4.8 per cent of GDP, up from 3.3 per cent in
   2016/17.
  A sharp drop in public infrastructure investment, mostly driven by declines in
   spending by state‐owned companies. Between 2016/17 and 2019/20, total
   public infrastructure spending fell from R250 billion to R183 billion, or from
   5.7 to 4 per cent of GDP.
  A deteriorating government balance sheet, including state‐owned companies
   and municipalities struggling to pay salaries and other operational costs.
 Options to stabilise the fiscus are becoming increasingly limited. Growth reforms
 are only expected to begin yielding results over the next several years, implying
 continued weakness in revenue collection over the period ahead.

                                         8
Proposed steps to reduce the fiscal deficit and
stabilise the debt‐to‐GDP ratio over a five‐year
period
 Relative to the 2020 Budget, main budget non‐interest spending (excluding
  technical adjustments) is reduced by R60 billion in 2021/22, R90 billion in
  2022/23 and R150 billion in 2023/24, with constrained spending growth in the
  following two years.
 The largest share of reductions falls on compensation. Other non‐interest
  spending items are also reduced, while funding for buildings and other fixed
  structures, provincial and local capital grants, and the Infrastructure Fund is
  protected.
 To assist with the consolidation, government has projected tax increases of
  R5 billion in 2021/22, R10 billion in 2022/23, R10 billion in 2023/24 and
  R15 billion in 2024/25.
 The aim is to reach a main budget primary surplus by 2025/26. This target is
  expected to result in debt stabilising at 95.3 per cent of GDP in the same year.

                                         9
The main budget and primary balances will narrow
   over the medium term
Main budget primary balance*                                         Main budget deficit
                  31                                                                   16
                       Main budget revenue                                                            Interest payments                                  Primary deficit
                  30                                                                   14
                       Main budget non‐interest expenditure                                                                                                                                                 9.8
                  29                                                                   12

                                                                     Per cent of GDP
                  28
Per cent of GDP

                                                                                       10
                  27                                                                                                                                                                                                  5.0
                                                                                        8                                                                                                                                       3.0
                  26                                                                                                                                                                                                                      1.4
                  25                                                                    6                                                                                                         2.7
                                                                                            4.1
                                                                                                                        0.5 1.0 1.0
                  24                                                                    4       2.4 2.2 2.3 1.6 1.3 1.0
                                                                                                                                                    5.9
                  23                                                                    2                                           4.0 4.8 5.1 5.6
                                                                                                                            3.5 3.7
                                                                                            2.2 2.3 2.5 2.7 2.8 3.0 3.1 3.3
                  22                                                                    0
                       2006/07
                       2007/08
                       2008/09
                       2009/10
                       2010/11
                       2011/12
                       2012/13
                       2013/14
                       2014/15
                       2015/16
                       2016/17
                       2017/18
                       2018/19
                       2019/20
                       2020/21
                       2021/22
                       2022/23
                       2023/24

                                                                                            2009/10
                                                                                                       2010/11
                                                                                                                 2011/12
                                                                                                                           2012/13
                                                                                                                                     2013/14
                                                                                                                                               2014/15
                                                                                                                                                          2015/16
                                                                                                                                                                    2016/17
                                                                                                                                                                              2017/18
                                                                                                                                                                                        2018/19
                                                                                                                                                                                                  2019/20
                                                                                                                                                                                                            2020/21
                                                                                                                                                                                                                      2021/22
                                                                                                                                                                                                                                2022/23
                                                                                                                                                                                                                                          2023/24
   *Excludes Eskom financial support and transactions in financial
   assets and liabilities

                                                              10
Per cent of GDP

               100

                50
                55
                60
                65
                70
                75
                80
                85
                90
                95

               50.5
     2016/17

                  53.0
     2017/18

                         56.6
     2018/19

                                63.3
     2019/20
                                             81.8

     2020/21
                                                                                Gross loan debt outlook

                                                    85.6

     2021/22
                                                           90.1

     2022/23

11
                                                                  92.9

     2023/24
                                                                     94.6

     2024/25
                                                                         95.3

     2025/26
                                                                         95.1

     2026/27
     2027/28
                                                                    94.5
                                                                  93.3

     2028/29
Fiscal framework

Table 1.2 Consolidated government fiscal framework
                               2019/20    2020/21    2021/22        2022/23        2023/24
 R billion/percentage of GDP   Outcome    Revised            Medium‐term estimates
 Revenue                        1 518.1    1 276.7   1 457.6         1 595.8        1 705.7
                                  29.5%      26.3%     27.4%           28.3%          28.6%
 Expenditure                    1 848.7    2 037.8   1 993.5         2 079.6        2 139.2
                                  35.9%      41.9%     37.5%           36.9%          35.9%
 Budget balance                  ‐330.6     ‐761.1    ‐535.9          ‐483.9         ‐433.4
                                  ‐6.4%     ‐15.7%    ‐10.1%           ‐8.6%          ‐7.3%
 Total gross loan debt          3 261.3    3 974.1   4 551.8         5 071.3        5 536.2
                                  63.3%      81.8%     85.6%           90.1%          92.9%
Source: National Treasury

 The consolidated deficit includes national and provincial government, social
  security funds and public entities.
 The consolidated deficit will narrow from 15.7 per cent of GDP in 2020/21 to
  10.1 per cent in 2021/22 and 7.3 per cent by the outer year.

                                               12
The proposed spending reductions will improve
the composition of spending from consumption
towards investment
        Average nominal consolidated spending growth, 2020/21 – 2023/24*

               Payments for capital assets                                      7.8

             Provinces and municipalities                       3.0

                      Goods and services                    2.5

                              Households                   2.3

             Compensation of employees                    0.8

      Departmental agencies and accounts      ‐0.7

                                             ‐2      0          2     4     6         8
                                                                 Per cent
       *Excludes COVID‐19 fiscal relief measures in 2020/21

                                                     13
Achieving wage bill reductions

  Government proposes growth in the public‐service wage bill of 1.8 per cent in
   the current year and average annual growth of 0.8 per cent over the 2021
   MTEF period.
  Government has not implemented the third year of the 2018 wage
   agreement. Notwithstanding that the matter is before the labour court,
   government is actively engaging with labour unions to find a solution to a
   more sustainable cost of employment.
  Furthermore, the Budget Guidelines propose a wage freeze for the next three
   years.
  Additional options to be explored include harmonising the allowances and
   benefits available to public servants, reconsidering pay progression rules and
   reviewing occupation‐specific dispensations.
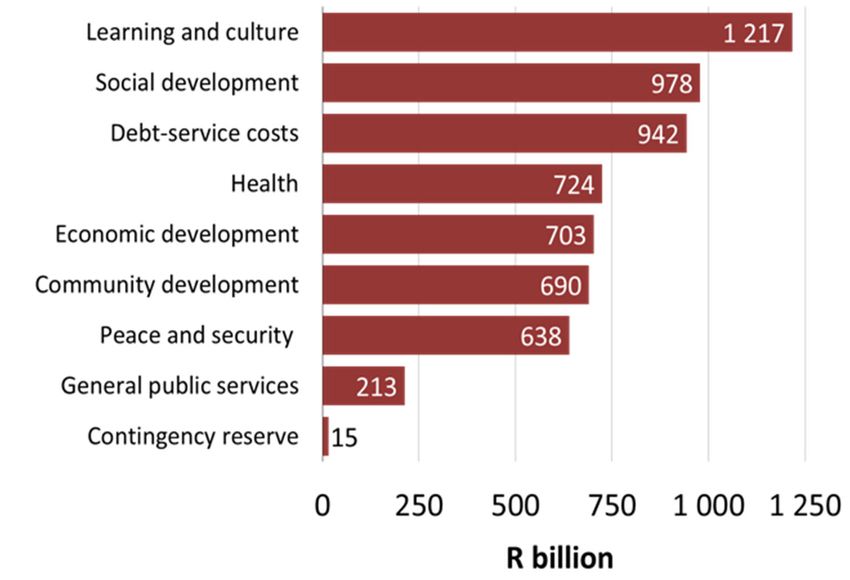
                                        14
Expenditure priorities

Average nominal growth in consolidated spending, 2020/21 – 2023/24
                                                                      Consolidated government
                                                                       spending is expected to
                                                                       total R6.21 trillion over the
                                                                       MTEF period, increasing
                                                                       from R2.04 trillion in
                                                                       2020/21 to R2.14 trillion in
                                                                       2023/24, at an average
                                                                       annual growth rate of
                                                                       1.6 per cent.
                                                                      Over the medium term,
                                                                       the learning and culture
                                                                       function continues to
                                                                       receive the largest
                                                                       allocation of funds, mainly
                                                                       for basic and post‐school
                                                                       education and training.

                                                15
Fastest‐growing functions

Consolidated government expenditure by function, 2021/22 – 2023/24

                                                                      Economic development
                                                                       and community
                                                                       development are the
                                                                       fastest‐growing functions
                                                                       mainly due to above‐
                                                                       inflation growth in road
                                                                       infrastructure and
                                                                       expanded access to basic
                                                                       services in line with
                                                                       economic recovery plan

                                                16
Division of revenue framework

                                    2017/18    2018/19 2019/20     2020/21   2021/22 2022/23 2023/24
 R billion                                     Outcome             Revised     Medium‐term estimates
 Division of available funds
   National departments               592.6     634.3     749.7     806.7     718.7     732.7     736.9
   Provinces                          538.6     572.0     613.1     628.3     629.4     641.8     645.6
     Equitable share                  441.3     470.3     505.6     520.7     514.0     522.0     523.1
     Conditional grants                97.2     101.7     107.6     107.6     115.4     119.8     122.5
   Local government                   111.1     118.5     123.3     139.9     138.7     146.5     149.1
     Equitable share                   55.6      60.8      65.6      85.7      78.0      83.1      83.7
     General fuel levy sharing         11.8      12.5      13.2      14.0      14.6      15.3      15.4
     with metropolitan
     municipalities
     Conditional grants                43.7      45.3      44.5      40.2      46.1      48.0      50.0
   Provisional allocations not            –         –         –         –      37.6      31.3      34.9
   assigned to votes
   Projected underspending                 –         –         –      ‐2.1         –         –         –
 Total                               1 242.3   1 324.8   1 486.2   1 572.7   1 524.3   1 552.2   1 566.5
 Percentage shares
   National departments               47.7%     47.9%     50.4%     51.2%     48.3%     48.2%     48.1%
   Provinces                          43.4%     43.2%     41.3%     39.9%     42.3%     42.2%     42.1%
   Local government                    8.9%      8.9%      8.3%      8.9%      9.3%      9.6%      9.7%
Source: National Treasury
    Over the medium term, government proposes to allocate 48.2 per cent of available non‐interest expenditure to
     national departments, 42.2 per cent to provinces and 9.6 per cent to local government.
    Over this period, national government resources decline at an annual average of 3 per cent, provincial resources
     increase by 0.9 per cent and local government resources increase by 2.1 per cent.
                                                            17
Financing and Debt Management Strategy

Table 3.8 National government gross borrowing requirement and financing
                                      2019/20     2020/21         2021/22            2022/23         2023/24
 R billion                           Outcome      Revised                    Medium‐term estimates
 Gross borrowing
 Main budget balance                    ‐345,1      ‐707,8          ‐537,4             ‐486,6         ‐437,5
 Redemptions                             ‐70,7       ‐66,9           ‐65,5             ‐150,6         ‐155,7
  Domestic long‐term loans               ‐19,4       ‐52,5           ‐60,9             ‐134,2         ‐112,9
  Foreign loans                          ‐51,2       ‐14,4            ‐4,6              ‐16,4          ‐42,8
 Total                                  ‐415,8      ‐774,7          ‐602,9             ‐637,2         ‐593,2
 Financing
 Domestic short‐term loans (net)         36,1        143,0            67,0               71,0           62,0
 Domestic long‐term loans               305,4        462,5           472,2              500,8          436,8
 Foreign loans                           76,1        121,4            49,4               49,3           66,6
 Change in cash and other balances        ‐1,8        47,8            14,3               16,1           27,8
 Total                                  415,8        774,7           602,9              637,2          593,2
Source: National Treasury

• The debt portfolio remains within all its strategic benchmarks
• Active debt management strategy has served to mitigate risks from elevated market volatility.
  Gross borrowing requirements are marginally lower than the estimate in the June SAB
• NT does not anticipate increasing auction levels in the current year
                                                             18
Risks to the fiscal outlook

The major short‐ to medium‐term risks to the fiscal framework include:
 Uncertainty around the speed of the economic recovery – including the medium‐
  term effects of the lockdown, both domestically and internationally. Globally, several
  developed economies have returned to strict lockdowns.
 Implementation risks for expenditure reductions, particularly on the wage bill. Both
  the upcoming decision on the final year of the current wage agreement and the
  upcoming wage talks pose significant risks to the expenditure ceiling.
 Additional spending pressures from state‐owned companies. Several companies,
  including South African Airways, are insolvent and have insufficient funds to cover
  operational expenses.

                                            19
Conclusion

 Government is committed to closing the budget deficit and stabilising the national debt‐
  to‐GDP ratio.
 A combination of expenditure and revenue measures will narrow the main budget deficit
  from 14.6 per cent of GDP in 2020/21 to 7.3 per cent by 2023/24. Gross national debt is
  projected to stabilise at 95.3 per cent of GDP by 2025/26.
 Achieving these targets will require large reductions in non‐interest spending over the
  next three years. The majority of these reductions will be applied to the wage bill.
  Government will aim to protect funding for infrastructure investment.
 Fiscal consolidation will thus be growth‐supporting, especially in the context of the
  President’s Economic recovery plan
 To assist with the consolidation, government has projected tax increases of R5 billion in
  2021/22, R10 billion in 2022/23, R10 billion in 2023/24 and R15 billion in 2024/25.
 Learning and culture receives the largest funding allocation, while economic development
  and community development are the fastest‐growing functions.

                                            20
You can also read