Mid-Year Economic & Capital Markets Update July 20, 2021
←
→
Page content transcription
If your browser does not render page correctly, please read the page content below

Mid-Year Economic & Capital Markets Update
              July 20, 2021

                                             1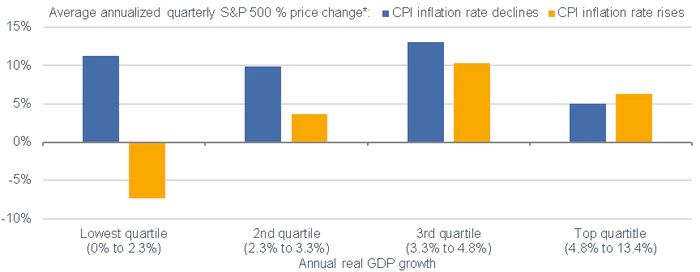
MARKET UPDATE
MARKET THEMES
24
22.0
22 21.1
▐ Year-To-Date
20
QTD
18 17.5
16 15.0
14
Total Returns (%)
13.3
12 12.0
10.4
10 8.8
8.5 7.4
8
6.1 6.8
6
5.0 4.4
4 3.6 4.3
3.9 3.9
3.2
0.2 2.7 2.4
2 1.8
1.7 1.4
0.5 0.9
0
-2 -1.6 -1.8
-4 -3.0
TIPS Municipals 5- U.S. Core High Yield High Yield Foreign EM Debt U.S Large U.S. Small International Emerging U.S. Equity S&P Real Commodities Hedge
Year Bond Municipals Bond (Unhedged) Cap Cap Developed Markets REITs Assets Funds
*Hedge fund returns are lagged 1 month. Sources: FactSet, J.P. Morgan, Russell, MSCI, FTSE Russell, Alerian. Hedge Funds returns as of 5/31/21/21. All other returns as of 6/30/21.
Fixed Income Equity Real Asset / Alternatives
+ Interest rates moved lower at the longer end of the curve and + Optimism continued into the 2nd
quarter as vaccinations + REITs continued to benefit from increasing demand and low
were slightly higher inside of 5-years. continue to progress and many restrictions were lifted across the interest rates.
country.
+ Investment grade and high yield spreads compressed during - Emerging market equities lagged their developed market + Commodities benefitted most from large increases in energy,
the quarter. counterparts as many developing countries struggled to control namely oil, although strong performance was broad based
Covid-19 outbreaks. across sectors.
See disclosures for list of indices representing each asset class. Past performance does not indicate future performance and there is a possibility of a loss.
3FIXED INCOME MARKET UPDATE
U.S. Treasury Yields Curve Index Performance Attribution (2Q 2021)
U.S. Treasuries moved lower at the longer end of the curve with the 10-year and 30- In the U.S., both lower rates and spread compression drove fixed income performance.
year rates declining 29bps and 36bps, respectively. Dollar weakness provided a nice tailwind for foreign bonds.
Source: FactSet Source: FactSet
Credit Market Spreads – Trailing 5 Years
Credit spreads compressed during the quarter with investment grade and high yield spreads decreasing 11bps and 42bps, respectively.
Source: FactSet
Past performance does not indicate future performance and there is a possibility of a loss.
4EQUITY MARKET UPDATE
Equity Valuations (Trailing 15 Years) U.S. Equities – Contribution to Return by Sector (2Q 2021)
Valuations remain elevated when compared to historical ranges. Valuations were lower relative to U.S. equity performance was strong across sectors with technology contributing most to index
the first quarter despite strong equity performance, driven by strong underlying earnings growth. performance, although the real estate sector performed best on an absolute basis.
30 IT (27%) 2.9%
Range (+/- 1 Std Dev.)
Communications (10%) 1.1%
Sector (Avg Index Weight %)
Median
Current (6/30/2021) Health Care (14%) 1.1%
25
Trailing PE Ratio
3/31/2021 Financials (12%) 0.9%
Consumer Disc. (12%) 0.8%
20 Industrials (9%) 0.4%
Real Estate (3%) 0.4%
Energy (3%) 0.3%
15
Consumer Staples (5%) 0.2%
Materials (2%) 0.1%
10 Utilities (2%) 0.0%
U.S. International Dev. Emerging Markets
-0.5% 1.0% 2.5%
Source: FactSet Source: FactSet. Russell 1000.
Country Total Returns (%) – Top 10 Largest Economies
Strong equity performance was broad based across countries with China the noticeable laggard as Chinese technology and consumer companies continue to face regulatory pressures.
20 18.1 17.6
18
16 14.9
QTD ▐ Year-To-Date
14.5 14.1
Total Returns (%)
14 13.2
12 11.4 10.7
10 9.1
8.9 8.8 8.6 8.6
8
6 5.8
1.9
4 4.2 4.4
3.0
2 2.1
0 0.2
-2
US China Japan Germany United India France Italy Canada Korea
Source: FactSet Kingdom
Past performance does not indicate future performance and there is a possibility of a loss.
5REAL ASSET MARKET UPDATE
Real Assets Performance REIT Sector Performance
Energy drove real assets higher as May’s ransomware attack on the Colonial Most REIT sectors generated positive returns and continued to benefit from re-
Pipeline caused supply disruptions within the space. opening measures and low interest rates.
50
44.6 Residential 14.1%
YTD QTD 27.6%
40 Industrial 12.0%
19.1%
Retail 12.5%
32.8%
30
Data Centers 14.1%
11.4%
QTD
Total Return (%)
23.2 20.4 6.3% YTD
Health Care 13.3%
20 17.6
Office 9.5%
15.1%
12.8
10 9.4 Self Storage 23.6%
36.4%
3.9 Diversified 9.6%
18.9%
0
Specialty 12.0%
28.0%
-10
-5.7 Lodging/Resorts -0.6% 17.3%
Energy Industrial Precious Agriculture
Metals Metals -5% 5% 15% 25% 35%
Source: FactSet Source: FactSet
Total Return (%)
Past performance does not indicate future performance and there is a possibility of a loss.
6ECONOMIC EXPANSION
U.S. GDP PATH DURING PANDEMIC

 • 2020 RECESSION AND REAL GDP GROWTH OFF PANDEMIC ECONOMIC ACTIVITY LOWS

                                                                      +1.4%

                                                   -11.5%                        +14.6%

Source: https://fred.stlouisfed.org/series/GDP
                                                                                          8
STRONG SECOND QUARTER 2021 REAL GDP GROWTH EXPECTATIONS
7.5% GDP GROWTH FORECAST FOR THE SECOND QUARTER OF 2021 (7/16/21 ESTIMATE).
7.5%
Source: https://www.atlantafed.org/cqer/research/gdpnow
9STRONG GLOBAL ECONOMIC GROWTH EXPECTATIONS
• 5.6% EXPECTED GROWTH FOR 2021*
• 4.3% EXPECTED GROWTH FOR 2022*
• IF ACHIEVED WOULD BE MOST RAPID RECOVERY FROM A CRISIS IN 80 YEARS
• FEDERAL RESERVE FORECASTS U.S. GDP GROWTH OF 7.0% FOR 2021 AND 3.3% FOR 2022**.
Historical Global GDP Growth and 2021/2022 Expectations*
8.0 100
90
5.6
6.0 World
4.5 80
4.3
4.0 3.4
2.8 3 3.1 2.8
3.3 3.2 70
2.6 2.5
60
2.0
50 Advanced economies
0.0 40
30
-2.0
20
-4.0 EMDEs
-3.5 10
-6.0 0
2010
2011
2012
2013
2014
2015
2016
2017
2018
2019
2020
2021
2022
*World Bank. Note: EMDEs = emerging market and developing economies. Aggregate growth rates are calculated using GDP weights at average 2010-19 prices and market exchange rates. Data for 2020 are
estimates. Shaded area indicates forecasts.
** June 16, 2021 Fed release
10MONETARY POLICY
• FED FUNDS UPPER LIMIT TARGET RATE REMAINS AT 0.25% (SINCE MARCH 15, 2020)
• THE FED’S $120B ($80B TREASURIES & $20B MORTGAGES) MONTHLY BOND BUYING CONTINUES
• GLOBALLY, ON BALANCE, MONETARY POLICY REMAINS HIGHLY ACCOMMODATIVE AND STIMULATIVE
• 60% OF ECONOMISTS POLLED* EXPECT A TAPERING ANNOUNCEMENT IN THE THIRD QUARTER WITH TAPERING TO BEGIN IN EARLY 2022
3/15/20
20
*June 4-10, 2021 Reuters poll of over 100 economists.
Source of Fed Funds Target Range – Upper Limit Graph: https://fred.stlouisfed.org/series/DFEDTARU
11MONETARY POLICY
PROBABILITY OF FUTURE FED FUNDS RATES BASED ON FUTURES MARKET (7/13/21 ESTIMATE)*
100%
100%
93%
93%
100-125
Probability of Future Fed Funds Rate
82%
75% 79%
75-100
66%
62%
50% 21% chance of 50-75
rate hike by July
27, 2022 46%
54% chance of rate
hike by December 25-50
25% 14, 2022
0-25
0%
7/1/21 8/1/21 9/1/21 10/1/21 11/1/21 12/1/21 1/1/22 2/1/22 3/1/22 4/1/22 5/1/22 6/1/22 7/1/22 8/1/22 9/1/22 10/1/22 11/1/22 12/1/22
*Fed Funds Future Projections Source (Based on Futures contracts): https://www.cmegroup.com/trading/interest-rates/countdown-to-fomc.html
*Note: The above Estimate was post announcement of the (0.9%) June 2021 CPI estimate announced on July 13.
12INFLATION FORCES
HISTORICAL ROLLING 12-MONTH INFLATION

                                       Rolling 12-Month CPI vs. Average Annualized Inflation (1947 – June 30, 2021)
                               16.0%
                                                                                        March-80,
                                                                                         14.59%
                               14.0%
                                                                November-74,
                                                                   12.20%
                               12.0%
                                        April-51,
  Consumer Price Index (CPI)

                                         9.60%
                               10.0%
                                                              February-70,                          October-90,                              July-08,   June-21,
                                                                 6.42%                                6.38%                                   5.50%      5.32%
                               8.0%

                               6.0%

                               4.0%

                               2.0%

                               0.0%

                               -2.0%

                               -4.0%
                                       1948
                                       1949
                                       1950
                                       1951
                                       1952
                                       1953
                                       1954
                                       1955
                                       1956
                                       1957
                                       1958
                                       1959
                                       1961
                                       1962
                                       1963
                                       1964
                                       1965
                                       1966
                                       1967
                                       1968
                                       1969
                                       1970
                                       1971
                                       1972
                                       1974
                                       1975
                                       1976
                                       1977
                                       1978
                                       1979
                                       1980
                                       1981
                                       1982
                                       1983
                                       1984
                                       1985
                                       1987
                                       1988
                                       1989
                                       1990
                                       1991
                                       1992
                                       1993
                                       1994
                                       1995
                                       1996
                                       1997
                                       1998
                                       2000
                                       2001
                                       2002
                                       2003
                                       2004
                                       2005
                                       2006
                                       2007
                                       2008
                                       2009
                                       2010
                                       2011
                                       2013
                                       2014
                                       2015
                                       2016
                                       2017
                                       2018
                                       2019
                                       2020
                                                        Average Annualized CPI (3.5%)                             Rolling 1-Year Inflation

Data Source: https://fred.stlouisfed.org
                                                                                                                                                               14
INFLATION FORCES: 10-YEAR BREAKEVEN INFLATION
• 10-YEAR BREAKEVEN INFLATION WAS 1.8% IN FIDUCIENT ADVISOR’S 2021 TO 2030 TEN-YEAR OUTLOOK (JANUARY 2021).
• BREAKEVEN INFLATION HAS RISEN BY 0.5% TO 2.32% AS OF JUNE 30, 2021 (SINCE THE JANUARY OUTLOOK).
• BREAKEVEN INFLATION PEAKED AT 2.54% IN ON MAY 10 DURING THE SECOND QUARTER AND HAS TRENDED DOWN SINCE.
Source: https://fred.stlouisfed.org/series/T10YIE
15CLASSICAL INFLATION THEORY
INFLATION DEPENDS ON MONEY SUPPLY GROWTH AND THE VELOCITY OF
MONEY.
• MONEY SUPPLY (M2) IS A MEASURE OF THE MONEY SUPPLY THAT INCLUDES CASH,
CHECKING DEPOSITS, SAVINGS, MONEY MARKETS, MUTUAL FUNDS AND CDS.
• VELOCITY OF MONEY IS AVERAGE NUMBER OF TIMES ONE DOLLAR IS USED TO
PURCHASE FINAL GOODS AND SERVICES PER YEAR.
16CLASSICAL INFLATION THEORY
While the M2 money supply expanded significantly, the velocity of money, or the rate at which money is
spent, slowed to its lowest level in 50 years.
U.S. Money Supply and Velocity
30 2.4
M2 Money Supply
25 2.2
2.0
20
Velocity
1.8
15
1.6
10
1.4
5 1.2
0 1.0
Jan-71 May-74 Sep-77 Jan-81 May-84 Sep-87 Jan-91 May-94 Sep-97 Jan-01 May-04 Sep-07 Jan-11 May-14 Sep-17 Jan-21
M2 Money Supply (YoY, left axis) Velocity (right axis)
Unemployment Rate Personal Saving Rate
16 40
14 35
Personal Savings Rate (%)
Unemployment Rate (%)
12 30
10 25
8 20
5.8
6 15
14.9
4 10
2 5
0 0
Sep-16
Jan-17
Jan-18
Jan-19
Jan-20
Jan-21
Sep-17
Sep-18
Sep-19
Sep-20
May-16
May-17
May-18
May-19
May-20
May-21
Nov-19
Dec-19
Nov-20
Dec-20
Apr-19
Oct-19
Oct-20
Jul-19
Apr-20
Jul-20
Apr-21
Jan-19
Jun-19
Jan-20
Jun-20
Jan-21
Aug-19
Sep-19
Aug-20
Sep-20
Feb-19
Mar-19
Feb-20
Mar-20
Feb-21
Mar-21
May-19
May-20
17ADDITIONAL INFLATION CONSIDERATIONS
• THE 2021 DEFICIT WILL LIKELY REACH ~$3.0T (ABOUT 13% OF GDP). OTHER THAN 2020 ($3.1T & 15% OF GDP), THIS IS THE LARGEST FISCAL DEFICIT AS A
PERCENTAGE OF GDP SINCE WORLD WAR II. BY COMPARISON, THE DEFICIT REACHED ~10% OF GDP DURING THE GREAT RECESSION (2008-2009).
• AMBITIOUS SPENDING PROPOSALS EARLY IN THE BIDEN ADMINISTRATION (UPWARDS OF $6 TRILLION) SEEM UNLIKELY TO PASS CONGRESS WITHOUT MEANINGFUL
MODERATION, TEMPERING FUTURE INFLATION SHOCK RISKS.
• THE UNIQUE NATURE OF THIS PANDEMIC-LED RECESSION AND RECOVERY HAVE CREATED SOME UNUSUAL DISTORTIONS WE BELIEVE ARE LARGELY TEMPORARY IN
NATURE AS THE DISCONNECT BETWEEN A POST-PANDEMIC PRODUCTION RAMP-UP AND THE PENT-UP CONSUMER DEMAND WILL NORMALIZE OVER THE
INTERMEDIATE TERM.
18INFLATION: DIVERSIFICATION AND REAL ASSETS
• Real Assets have historically provided an effective hedge against rising inflation.
• Equities have generated positive real returns over the long-term, while fixed income provides good diversification in
periods of economic stress and recessions.
• During periods of rising inflation, while traditional asset classes may see challenging short-term performance, real
assets have produced strong returns.
• Inflation inflection points are difficult to project and time. We advocate for maintaining a strategic allocation to both
traditional and real assets.
Returns on Investments (%) During Various Inflation Environments
Falling Inflation Frequency 18% Stable Inflation Frequency 65% Rising Inflation Frequency 17%
23.2
25
20
14.5
15 10.6 11.8
9.6 8.4 7.9
10 5.5 6.8 6.2 5.4
3.1 3.0 4.5
5 2.3 1.3 1.7 2.7 2.0 1.1
0
-5
-3.5 -3.2 -3.7
-10
-15
-13.4
Stocks US Bonds US TIPS REITS Energy Stocks Metals Stocks Prec Metals Commodities
Period analyzed is January 1973 through December 2020. Real Estate: MSCI World Real Estate Index since January 1993 | Energy: MSCI World Energy Index since January 1995; DataStream World Energy Index from January 1973 to December 1994 |
Metals & Mining: MSCI World Metals & Mining Index since January 1995; DataStream World Metals & Mining Index from January 1973 to December 1994 | Commodities: Equal Sector Weighted S&P Goldman Sachs Commodities Index | Precious Metals:
70% MSCI World Gold Mining Equity Index/30% S&P GSCI Precious Metals Commodities Total Return Index since January 2005; 70% DataStream World Gold Mining Index/30% S&P GSCI Precious Metals from January 1973 to December 2004 | Rising
inflation: any month when Y/Y US CPI rose by +0.3% or more relative to the previous month; Stable inflation period is defined as any month when Y/Y US CPI was between -0.3% and +0.3% relative to the previous month; Falling inflation: any month when
Y/Y US CPI fell by -0.3% or more relative to the previous month.
Past performance does not indicate future performance and there is a possibility of a loss
19CAPITAL MARKET ASSUMPTIONS AND PORTFOLIO POSITIONING
PORTFOLIO POSITIONING

“REAL ASSETS REMAIN AN IMPORTANT DIVERSIFIER AS THE EVENTS OF 2020
   HAVE LIKELY PLANTED SOME SEEDS FOR RISING FUTURE INFLATION.”

                - FIDUCIENT ADVISORS’ JANUARY 2021 OUTLOOK
                        6/30/21 YTD (2 QTR 2021) Returns:

   Financial Assets
   • Global Stocks: MSCI ACWI: +12.3 (+7.4)
   • Investment Grade U.S. Bonds: Barclays US Aggregate Bond Index: -1.6 (+1.8)

   Real Asset Categories
   • Real Estate: FTSE NAREIT Index: + 22.0 (+12.0)
   • Commodities: Bloomberg Commodity Index: +21.2 (+13.3)
   • Natural Resources: S&P Natural Resources Index: +19.9 (+7.3)

                                                                                  21
INFLATION FORCES WITH STRONG ECONOMIC GROWTH (1950 – MARCH OF 2021)
• WHEN INFLATION ROSE, BUT ECONOMIC GROWTH WAS IN ITS HIGHEST QUARTILE, STOCKS NOT ONLY ROSE; THEY ROSE AT A FASTER
CLIP THAN WHEN INFLATION WAS FALLING IN THAT SAME GROWTH ZONE.
• ABOVE TREND INFLATION IS NOT NECESSARILY DETRIMENTAL TO STOCK MARKET RETURNS IF ALSO ACCOMPANIED BY STRONG ECONOMIC
GROWTH
Low Growth High Growth
AND Higher AND Higher
Inflation. Inflation
Source: Charles Schwab, The Leuthold Group, 1950-3/31/2021. *Based only on economic expansions (all quarters when trailing y/y real GDP growth rate was positive). Past performance is no guarantee of future results.
22EVOLVING TEN-YEAR CAPITAL MARKET ASSUMPTIONS (AS OF JULY 1, 2021)
• THE FOLLOWING IS A HIGH-LEVEL SUMMARY OF OUR 10-YEAR CAPITAL MARKET (NOMINAL) FORECASTS IF THEY WERE TO BE
REVISED FOR JULY 1, 2021 (SINCE OUR JANUARY 1, 2021 OUTLOOK).
➢ US INVESTMENT GRADE BONDS: 1.5% (+0.35% SINCE JANUARY).
➢ GLOBAL BONDS: 1.26% (+0.47% SINCE JANUARY).
➢ US EQUITY (5.7%), INTL DEV EQUITY (7.0%) & EM EQUITY (8.3), WHICH ARE GENERALLY WITHIN +/-0.16% OF JANUARY 2021 FORECASTS.
➢ INFLATION EXPECTATIONS: 2.3% (+0.5% SINCE JANUARY)
• FORWARD-LOOKING INVESTMENT GRADE BOND MARKET (NOMINAL) RETURN EXPECTATIONS GENERALLY ROSE WITH RISING
INTEREST RATES AND INFLATION EXPECTATIONS.
• EQUITY RETURN EXPECTATIONS, WHILE GENERALLY UNCHANGED NOMINALLY, HAVE DECLINED ON A REAL BASIS DUE TO RISING
VALUATIONS AND HIGHER INFLATION ASSUMPTIONS.
• DESPITE OUR VIEW THAT ACCELERATING INFLATION IS LIKELY TRANSITORY, INFLATION TAIL RISKS REMAIN. REAL ASSETS REMAIN
AN IMPORTANT STRATEGIC DIVERSIFIER.
• BROAD FINANCIAL ASSET CLASS VALUATIONS ARE ELEVATED CONSTRAINING LONGER-TERM RETURN EXPECTATIONS, BUT THE
CURRENT ROBUST ECONOMIC RECOVERY COUPLED WITH ACCOMMODATIVE FISCAL POLICY AND MONETARY POLICY MAY
PROVIDE A MEANINGFUL INTERMEDIATE-TERM TAILWIND FOR RISK ASSETS.
• OUTLOOK AND GENERAL PORTFOLIO POSITIONING REMAINS CONSISTENT WITH JANUARY 2021.
23Apollon Wealth Management, LLC (Apollon) is a registered investment advisor This document is
intended for the exclusive use of clients or prospective clients of Apollon. Any dissemination or
distribution is strictly prohibited. Information provided in this document is for informational
and/or educational purposes only and is not, in any way, to be considered investment advice
nor a recommendation of any investment product or service. Advice may only be provided after
entering into an engagement agreement and providing Apollon with all requested background
and account information. Please visit our website for other important disclosures.
http://apollonwealthmanagement.comYou can also read