Measuring and Understanding Powder Behaviour - Rajeev Dattani Applications Specialist Analytica 2018
←
→
Page content transcription
If your browser does not render page correctly, please read the page content below

Rajeev Dattani
                                              Applications Specialist
                                              Analytica 2018

                  Measuring and Understanding Powder
                              Behaviour

© Freeman Technology Ltd, 2018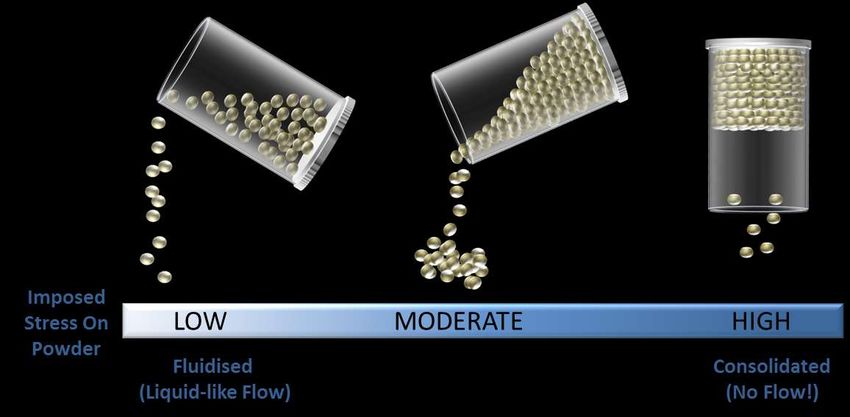
Introduction

    •   Powders are used extensively throughout a range of industries.
    •   Thousands of formulations, hundreds of processes.
    •   Powder characteristics will influence manufacturing performance and the
        properties of final product.
    •   Powder behaviour is still poorly understood which results in stoppages,
        downtime, out of spec product or scrapped material.
    •   Expensive and inefficient use of resources.
    •   Comprehensive understanding of powder properties is essential for efficient
        processing.
    •   What parameters describe flowability in a process?

© Freeman Technology Ltd, 2018
The Nature of Powders

      Particles are complex, and variable
      Each particle defined by a set of physical and chemical properties

              •     Particle Size & Distribution      •   Elasticity
              •     Shape                             •   Plasticity
              •     Surface Texture                   •   Porosity
              •     Surface Area                      •   Potential for electrostatic charge
              •     Density                           •   Hygroscopicity
              •     Cohesion                          •   Hardness / Friability
              •     Adhesion                          •   Amorphous content

                           Each will contribute to how the powder behaves!

© Freeman Technology Ltd, 2018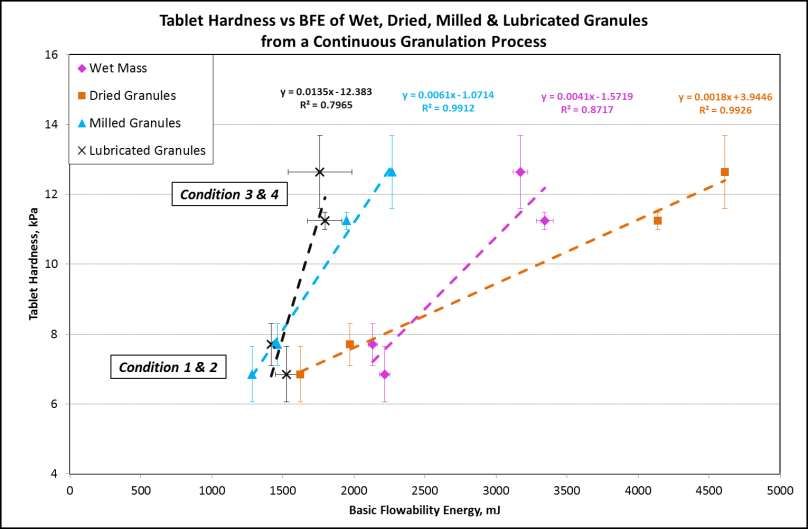
Multiple Phases

    Powders are bulk materials, made from: -
    •    Solids (the particles)
    •    Liquid (water on the surface of the particle, in the particle or in the air between particles)
    •    Gas (normally air, between particles)

           Bulk powder “behaviour” is complex and will depend on how these three
                                       phases interact

© Freeman Technology Ltd, 2018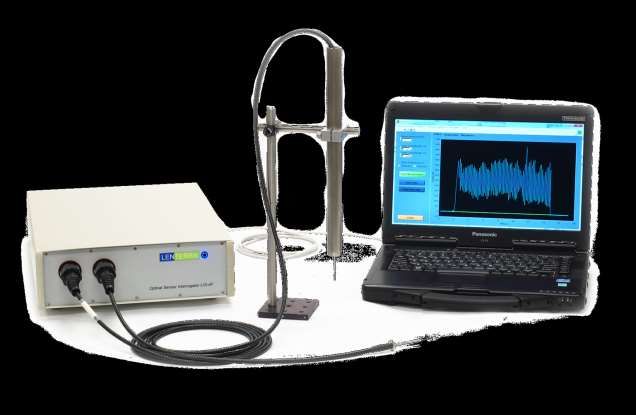
What Influences Powder “Behaviour”?

      Powder behaviour = fn (size) + fn (shape) + fn (stiffness)

                                 + fn (porosity) + fn (surface texture) + fn (density)

                                 + fn (cohesion) + fn (adhesion) + …….

      … but also the environmental conditions the powder is exposed to: -
                                   •   Consolidation
                                   •   Aeration
                                   •   Humidity level
                                   •   Extent of Shear / Strain
                                   •   Equipment surface material……

       •     No mathematical way of predicting behaviour from primary properties.
       •     If there are 12 variables, each with just 4 permutations, this gives over 16
             million combinations!

© Freeman Technology Ltd, 2018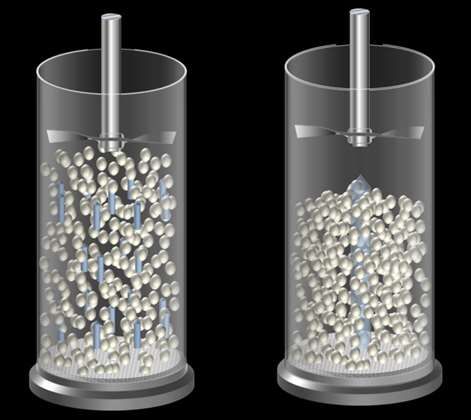
© Freeman Technology Ltd, 2018
The Influence of Packing State (Aeration and Consolidation)

     •    Same powder can be fluid like at low stress, or a single solid entity if
          consolidated (or anything in between)
     •    Particles have same physical properties (size, distribution, shape, etc) but the
          powder can behave very differently

© Freeman Technology Ltd, 2018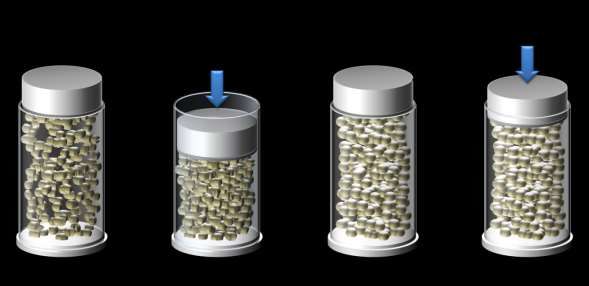
Understanding the Processing
                                         Environment

© Freeman Technology Ltd, 2018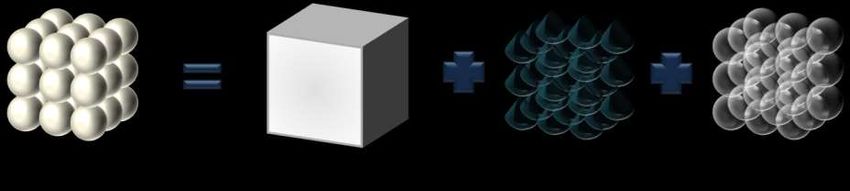
Process Flow for continuous tablet manufacture (wet and dry granulation)

© Freeman Technology Ltd, 2018
Understanding Powder Properties and Process Conditions

       In both batch and continuous process, a detailed understanding of the
       powder properties and processes employed is important.
       The relationship between material properties and process conditions
       determines the quality of the finished product.
       For example, in a tableting process: -

                            DISPENSE          MIX      DRY    MIX (Mg.St)   COATING

                   RAW MATERIAL        FEED     GRANULATE    MILL   COMPRESSION

© Freeman Technology Ltd, 2018
Powder Rheology © Freeman Technology Ltd, 2018
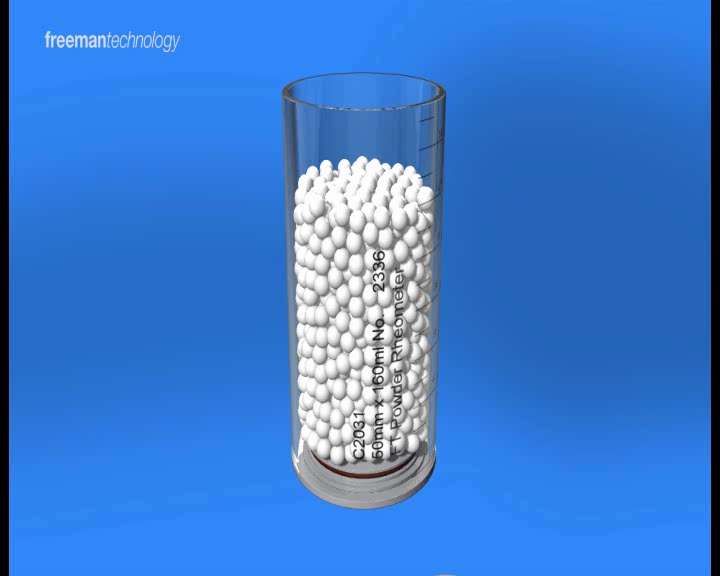
Dynamic Testing
   A powder rheometer measures the resistance that the powder exerts on the
   blade, as the blade forces its way through the sample.
   This resistance is expressed as “Flow Energy”, which is calculated from the direct
   measurements of Torque and Force.

© Freeman Technology Ltd, 2018
Aeration

     Non-Cohesive                 Cohesive
       Powder                      Powder

                         AIR IN
© Freeman Technology Ltd, 2018
Compressibility
Changes in volume due to: -
• Transportation
• Storage
• Hoppers
• Kegs
• Processing
• Direct compression
• Roller compaction
• Screw feeding
© Freeman Technology Ltd, 2018Permeability
Powder behaviour during: -
Low Air Pressure Drop
• Aerosolisation / DPI means air can escape easily
• Hopper Flow
• Direct compression
• Pneumatic transfer
© Freeman Technology Ltd, 2018Shear Cell
Shear in consolidated powder occurs during
flow in a hopper or IBC, or during force
feeding through augers or transfer chutes.
• Shear Cells measure the
onset of flow, the transition
from static to dynamic.
• Good for understanding
behaviour in hoppers.
• Flow largely dependant on
mechanical properties like
size, distribution,
morphology, surface texture,
adhesion due to binders.
© Freeman Technology Ltd, 2018Case Study
Wet Granulation & Tablet Production
© Freeman Technology Ltd, 2018Purpose of this study
To investigate the change in material properties of both wet and dry
granules as a function of a variation in formulation and process
configuration…..
……and to relate these material properties to tablet characteristics
© Freeman Technology Ltd, 2018Wet Granulation
• Converts fine powders into larger • Granulation via high shear can be a
granules. Benefits include: - batch or a continuous process
• Improved flow • In both cases, water is introduced
whilst the powder is sheared
• Reduced segregation
• Process variables: -
• Better content uniformity
• Amount of water added
• Improved compression
properties • Screw speed (continuous)
• Reduced dusting • Powder feed rate (cont.)
• Impeller and chopper speed
(batch)
• Granulation time (batch)
• Water addition rate (batch)
© Freeman Technology Ltd, 2018Process Variables (granulator)
• Water content
• Screw Speed
• Powder Feed Rate
• Barrel Temperature
Process Variables (dryer)
• Time
• Air Velocity
• Air Temperature
(photo courtesy of GEA Pharma Systems)
GEA ConsiGmaTM 1 Continuous High
Shear Wet Granulator and Drying
System
© Freeman Technology Ltd, 2018Formulation
Two types of formulation were considered in this study: -
1) APAP – 90% API
2) DCP – 90% API
Process Variables
• Water content varied to produce granules from under-granulated to over-
granulated, (determined visually).
• Screw speed varied to investigate the influence on granule properties.
• Dry powder feed rate also varied for some samples. Settings reduced from
25 kg/hr (equivalent to ConsiGma 25) to 20 and 15 kg/hr.
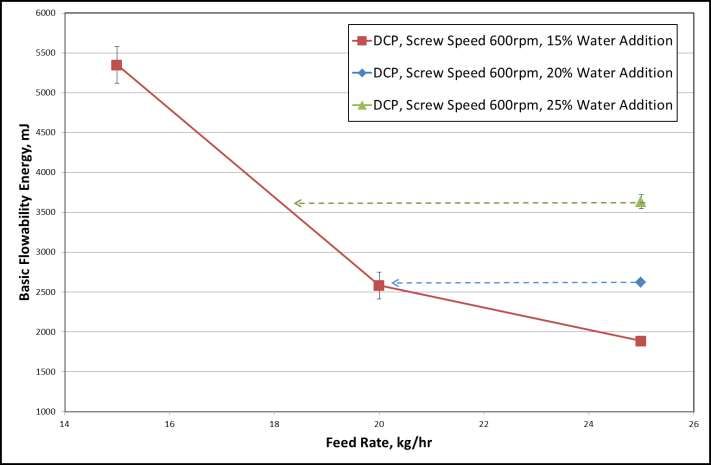
© Freeman Technology Ltd, 2018Changes in Bulk Material Flow Properties of Wet Granules as a
function of Water Content & Screw Speed
© Freeman Technology Ltd, 2018Data for wet granules of DCP formulation showing how granules of similar
properties can be manufactured using different process settings
© Freeman Technology Ltd, 2018Data showing how the flow properties of granules from each “Condition”
change through the process (wet, dry, milled, lubricated)
© Freeman Technology Ltd, 2018GEA Modul™ S Tablet Press
Tooling 7mm Round
Pre-Compression
2.15mm
Upper Position
Pre-Compression
4.82mm
Lower Position
Compression
2.29mm
Upper Position
Compression
4.29mm
Lower Position
(photo courtesy of GEA Pharma Systems)
Tablet Hardness Tester
© Freeman Technology Ltd, 2018Data showing the relationship between granule properties and tablet hardness
for each granule stage (wet, dry, milled, lubricated)
© Freeman Technology Ltd, 2018Summary
• Powders are complex materials.
• The multiple process steps in a continuous tableting line subject raw
materials and intermediates to a range of different environments.
• Each process operation provides the opportunity to adjust settings in order
to improve process efficiency and / or to alter the properties of the material
leaving that stage of the process.
• With sufficient understanding of the relevant material properties and critical
process parameters, it is possible to employ a QbD approach to continuous
tablet manufacture.
• Powders have many characteristics, so single number characterization, or
even a single technique is not going to thoroughly describe powder
behaviour in every process – a multivariate analysis is required.
• Each stage of the process, from initial feeding to final compression needs to
function efficiently in order that product of the desired properties can be can
be manufactured. Problems at any stage have the potential to translate
downstream, ultimately affecting tablet properties.
© Freeman Technology Ltd, 2018Drag Force Flow
(In-line Measurement)
© Freeman Technology Ltd, 2018Drag Force Flow Measurement System
• Probe (DFF - immersion, RealShear mounted flush with the wall)
• Optical detection principle
• Temperature compensation
• Directional measurement
• Measurement system – Interrogator
© Freeman Technology Ltd, 2018Advantages
• Direct, real-time measurement
• In-line operation with no disruption of process
• Small footprint (~3 mm diameter)
• Stainless steel construction - sterilizable and chemically resistant
• Sensitivity from 0.4 Pa to 100MPa
• Can measure viscosity (using known flow parameters)
• Free from electromagnetic interference
• No ignition hazard
• Self-calibrated for temperature variations
• Fast measurement rate (more than 1 kHz) for detailed analysis of dynamic
flows
• Turn-key operation when coupled with a Lenterra optical interrogator and
software
© Freeman Technology Ltd, 2018The principle - Fiber Bragg Grating (FBG)
FBGs are periodic structures of varying refractive index embedded in optical fibers.
• FBG is attached to the cantilever.
Force When the cantilever bends in
response to shear stress, the FBG is
λ1 λ2 strained which shifts its optical
spectrum
P
Δλ ~ Force • By interrogating FBG with a light
source, this strain can be measured
by tracking the shift in the resonant
wavelength
Δλ
© Freeman Technology Ltd, 2018Lenterra Drag Force Flow (DFF) Sensor
• Mounted on a stationary base, the thin Drag
Force Flow (DFF) “needle” contains two fiber-
optic gauges which are connected to a
controller via a fiber-optic cable.
• When immersed in a liquid, powder or granules,
the DFF bends under the force of the flow,
measuring the drag force.
• The amount of bending is measured in-line in
real-time.
• Allows the user to determine immediately
whether or not any adjustments are necessary,
eliminating the need to stop the operation for
offline measurement.
© Freeman Technology Ltd, 2018© Freeman Technology Ltd, 2018
Case Study

                                 High Shear Wet Granulation

© Freeman Technology Ltd, 2018
Three mixtures of MCC, anhydrous lactose, sodium
croscarmellose and different amounts of HPC were
wet granulated with 40% wt/wt water in a GEA
PharmaConnect™ high shear wet granulator.
For each formulation, changes in Force Pulse
Magnitude (FPM) during the granulation step, were
monitored in-line using the Lenterra DFF Sensor
Flow
© Freeman Technology Ltd, 2018• Force Pulse Magnitude (FPM) as a
function of time was relatively consistent
for the three formulations until the point
of water addition.
• An increase was observed as the granules
developed and began to increase in size.
• A maximum FPM value occurred soon
after the end of the water addition period.
• This is consistent with conventional
understanding that wet granulation end
point is achieved shortly after the end of
water addition.
Change in FPM (from DFF Sensor) • The peak position suggests that whilst a
as a function of time higher HPC binder content increases the
time taken to achieve granulation end
point it also potentially results in stronger
granules.
© Freeman Technology Ltd, 2018Similarities are observed between the
Basic Flowability Energy (BFE) and the
results from the DFF sensor:
• There is an increase and
subsequent decrease in BFE as a
function of time after the start of
water addition.
• Higher levels of binder result in
higher BFE values, indicating
Change in BFE (from FT4 Powder Rheometer®) stronger, denser, larger granules.
as a function of time
© Freeman Technology Ltd, 2018Summary
• Highly sensitive, capable of measuring small differences in the powder / granulate
properties.
• Suitable for a range of applications / unit operations:
• Mixing
• Granulation
• Conveying
• Provides real-time and continuous monitoring of powder processing operations:
• End-point determination / blend uniformity
• Irregular or problematic flow
• Measures powder / granule properties in conditions relevant to the unit operation.
• Results correlate with off-line measurements.
© Freeman Technology Ltd, 2018Thank you for your attention!
Please visit us in Hall A2 Stand 423.
www.freemantech.co.uk
© Freeman Technology Ltd, 2018You can also read