An Evaluation of Connectivity Tables in Waterloo Region
←
→
Page content transcription
If your browser does not render page correctly, please read the page content below

An Evaluation of Connectivity Tables
        in Waterloo Region

                                                                                                 Evidence   Insight   Action

What is the Connectivity Table?
Connectivity is based on a Community Mobilization Hub Model originating in Prince Albert, Saskatchewan.
The model is a multi-disciplinary, interagency approach to addressing situations of acutely elevated risk on a
case-by-case basis. Locally, each table brings health, social, and justice services together at a weekly meeting to
collaboratively and proactively address situations of elevated risk.

How Does the Connectivity Table Work?
Connectivity Tables work through an intentional 4 filter model using de-identifying information at their weekly
meetings to assess and respond to acutely elevated risk. The following diagram illustrates the process.

                                           UP TO 30 AGENCIES
                                            IN ATTENDANCE

            WEEKLY MEETING

                                                                                          PRESENTING OF
                                                                                          SITUATIONS OF
                                                                                          ELEVATED RISK

            IDENTIFY AGENCIES
             TO COLLABORATE

    SHARE
 INFORMATION
AND RESOURCES                                                                        CONNECT INDIVIDUALS
                                                                                        WITH SERVICES
                                                      INITIATE A RESPONSE
                                                      WITHIN 24-48 HOURS

                                                                                                                               1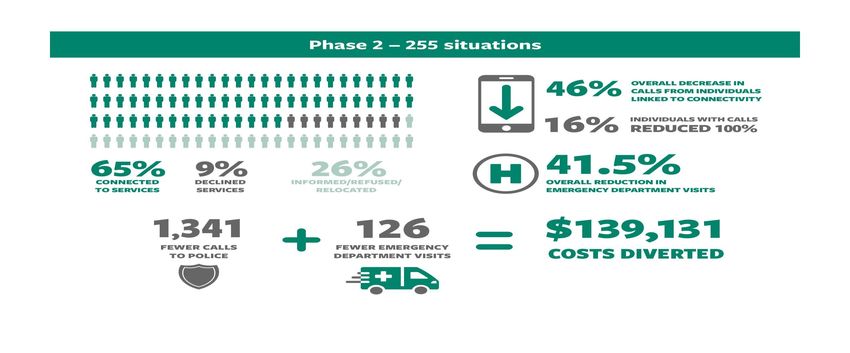
An Evaluation of Connectivity Tables in Waterloo Region                                                                          2017

How Did the Waterloo Region Connectivity Tables                                                                  One of the things that I think that
Get Started?                                                                                                     makes the Table work is people
In January, 2014, the Waterloo Regional Police Service (WRPS), in partnership                                    come from their organizations, but
with Langs, adapted and implemented Connectivity, a “Situation Table” in Cam-                                    when that case gets put forward,
bridge-North Dumfries (CND). In partnership with Carizon Family and Commu-                                       that’s who we look at first. We look
nity Services, a second Situation Table became operational covering Kitchener,                                   at those risk factors and we’re not
Waterloo, Wellesley, Wilmot, and Woolwich (KW4) in October 2014. Together,                                       looking at do they fit my criteria,
these two tables are known as Connectivity Waterloo Region.                                                      would they fit into our agency–you
                                                                                                                 know? …We decide who can be of

Why Evaluate Connectivity Tables?                                                                                best help, not whether or not it’s my
                                                                                                                 job… Those silos drop, and it’s like
The expected outcome of the Connectivity Table is that individuals are connect-                                  we work for one agency, but we’re
ed to services. However, we know through experience that Connectivity Tables                                     bringing our expertise and our re-
have a greater impact on individuals, families, organizations and the system. With                               sources… And that’s the way it really
the number of tables established in Ontario, it was timely to look at their impact                               should be, because if one agency
and develop an evaluation framework that could be replicated for other situa-                                    could handle them, they wouldn’t be
tion tables. Two evaluations were undertaken in Waterloo Region completed by                                     coming here. We need to step up. We
Taylor Newberry Consulting. A Steering Committee helped guide the evaluation                                     can’t allow the clients to fall between
process and input was sought from table members about the evaluation.                                            the cracks. – Connectivity Table
                                                                                                                 Member, Phase 1 Evaluation
What was the Methodology Undertaken to
Evaluate Waterloo Region Connectivity Tables?

                            Project Design and Evaluation Methodology
  Phase 1 Evaluation                                                       Phase 2 Evaluation
  An analysis of police calls for service data pre and                     An analysis of hospital service usage data, including
  post Connectivity Table interventions                                    emergency department use, in-patient admissions,
                                                                           and length of stay. Analysis examined trends
                                                                           and changes pre and post Connectivity Table
                                                                           interventions

  Key informant interviews with table members and                          Interviews with service users/clients connected to
  external stakeholders                                                    services to gather first-hand experiences regarding
                                                                           the impact of the Connectivity Tables.

  Focus groups with table members                                          An analysis of police calls for service data pre and
                                                                           post Connectivity Table interventions

                                                                           Key informant interviews with table members and
                                                                           external stakeholders

There has been absolutely no more contact with police, no more issues in the community, complete stability, housed, healthy, still on medica-
tion, and still followed by a lot of the supports that were put into place as a result of coming to Connectivity. – Connectivity Table Member,
Phase 2 Evaluation

                                                                                                                                                           2
An Evaluation of Connectivity Tables in Waterloo Region                                            2017

Connectivity Table Process and Expected Outcomes

  Connectivity Team Forms                                  • Analysis of presenting needs and risk
                                                           • Establish service roles and contact plan

  Initial Intervention                                     • Service consent and engagement
                                                           • Emergency Department diversion
                                                           • Hospitalization
                                                           • Service plan created

  Outreach and Risk Reduction                              • Eviction prevention            • Connections to services
                                                           • Income security                  made:

                                                           • Medication compliance          		 - Psychiatry

      ‘I just wasn’t taking my medication when I lived     • Removal to safety              		 - Primary Care
      with my mom. I was skipping some meds I proba-       • Clarity of needs and           		 - Support Coordination
      bly shouldn’t have skipped, which I realized after     appropriate services           		 - Counselling
      I moved out how much they actually help and how
                                                                                            		 - Peer Support
      much they don’t actually hurt me” – Connectivity
      Table Client, Phase 2 Evaluation

Evaluation Questions
The Phase 2 evaluation focused more heavily on outcomes. The following key evaluation questions guided Phase 2:
    • To what extent do individuals engage with the supports and services developed and implemented by Connectivity?
    • What new services and supports do individuals access to meet their needs?
    • What are individuals’ experiences with new supports and services? Are they experienced as beneficial and
      helpful? In what ways? How can services be improved?
    • What changes are observed in people’s lives? To what extent are stability and wellness promoted? How is risk
      mitigated or removed?
    • To what extent have interventions by Connectivity influenced the frequency and duration of emergency
      department visits and hospital admissions among Connectivity users?
    • To what extent have interventions by Connectivity influenced the frequency of police service calls among
      Connectivity users?

    “We do have a lot of people in our community who won’t actually be helped if you don’t have
     somebody going to the door … the point of Connectivity isn’t just to give them a business card and
     say, call me if you want some help. It’s to grab a hold of their arm and look at them in the eye and tell
     them, “you need help and here it is”. There aren’t too many agencies out there who do that sort of
     work, so for us to round up in groups and go do that, I think is very unique.” – Community Partner

                                                                                                                          3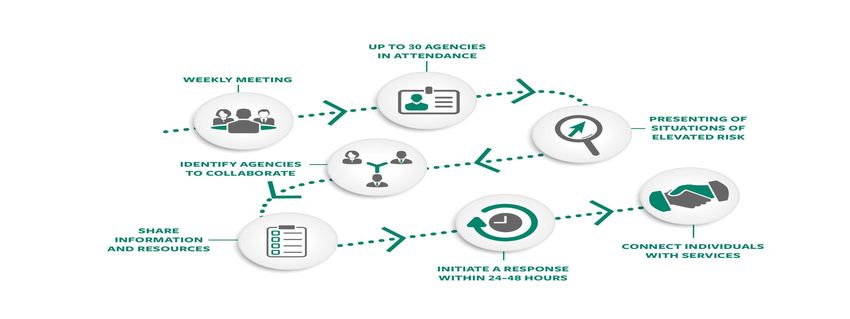
An Evaluation of Connectivity Tables in Waterloo Region 2017
Connectivity Table Outcomes… By the Numbers
Phase 1 – 89 situations
74%
74%
74%
74%
OVERALL
74%
OVERDECREASE
CALLS
CALLS
LINKED
ALL DECREASE
FROM
LINKED
OVERALL
FROM
OVERALL
IN IN
INDIVIDUALS
INDIVIDUALS
TO CONNECTIVITY
TO CONNECTIVITY
DECREASE
DECREASE
IN IN
21%
21%
CALLS
CALLS
FROM
OVERALLFROM
INDIVIDUALS
INDIVIDUALS
DECREASE IN
LINKED
LINKED
TOFROM
CALLS CONNECTIVITY
TO CONNECTIVITY
INDIVIDUALS
76%
76%1313%
% 1111%
%
LINKED TO CONNECTIVITY
CONNE
76%
76%
CONNECTED
CTED
13%
76% 13%
13% 11%
TO SERVICES
11%
TO SERVICES
11%
DECLINED
DECLINED
SERVICES
SERVICES
INFORMED
INFORMED/REFUSED/
/ REFUSED/
RELOCATED
RELOCATED 21%
21%
21%
INDIVIDUALS
INDIVIDUWITH
REDUCED
REDUCED
100%
INDIVIDUALS
ALS WITH
100%
INDIVIDUALS
WITH
CALLS
WITH
CALLS
CALLS
CALLS
REDUCED
REDUCED 100%100%
CONNECTED
CONNECTED DECLINED
DECLINED INFORMED/REFUSED/
INFORMED/REFUSED/ INDIVIDUALS WITH CALLS
REDUCED 100%
CONNECTEDSERVICES
TO SERVICES
TO SERVICES DECLINED
SERVICES INFORMED/REFUSED/
RELOCATED
RELOCATED
Phase 2 – 255 situations
TO SERVICES SERVICES RELOCATED
46%
46% OVERALL
OVERALL
CALLS
DECREASE
CALLS
LINKED
FROM
LINKED
DECREASE
FROM
IN IN
INDIVIDUALS
INDIVIDUALS
TO CONNECTIVITY
TO CONNECTIVITY
46%
46%REDUCED
46%
16%
16% REDUCED
OVERALL
OVERALL
DECREASE
INDIVIDUALS
100%
100%
DECREASE
INDIVIDUALS
LINKED
LINKED
TO TO
LINKED
WITH
IN IN
OVERALL DECREASE IN
CALLS
CALLS
FROMFROM
INDIVIDUALS
INDIVIDUALS
WITH
CALLS
CONNECTIVITY
TO
CALLS
CALLS FROM INDIVIDUALS
CONNECTIVITY
CONNECTIVITY
16%
16%REDUCED
16%
INDIVIDUALS WITH
INDIVIDUALS CALLS
WITH CALLS
41.5%
41.5%
INDIVIDUALS WITH CALLS
REDUCED
100%
REDUCED 100%
100%
65%
65% 9%
9% 26%
26%
41.5%
41.5%
41.5%
CONNECTED
CONNECTED DECLINED
DECLINED INFORMED/REFUSED/
INFORMED/REFUSED/ OVERALL
OVERALL
REDUCTION
REDUCTION
IN IN
6565%
%
65%9%
CONNE
9%
9% 26
TO SERVICES
26%
%
26%
TO SERVICES
CONNECTED
CONNECTED
CTED
SERVICES
SERVICES
DECLINED
DECLINED
RELOCATED
DECLINED INFORMED
RELOCATED
INFORMED/REFUSED/
INFORMED/REFUSED/
/REFUSED/
EMERGENCY
EMERGENCY
OVERALL
OVERALL
DEPARTMENT
DEPARTMENT
ALLREDUCTION
OVERREDUCTION
VISITS
IN ININ
REDUCTION
VISITS
1,1341
,341 126
126 $139,131
$139,131
TO SERVICES
TO SERVICES
TO SERVICES SERVICES
SERVICES
SERVICES RELOCATED
RELOCATED
RELOCATED EMERGENCY
EMERGENCY
EMERGENCY DEPARTMENT
DEPARTMENT
DEPARTMENT VISITS
VISITS
VISITS
1,341
1,1341
FEWER
,341
FEWER
CALLS
TO POLICE
CALLS
TO POLICE
FEWER CALLS
126
126
126
FEWER
FEWER
EMERGENCY
EMERGENCY
DEPARTMENT
DEPARTMENT
VISITS
VISITS
FEWER EMERGENCY
$139,131
$139,131
$139,131
COSTS
COSTS
DIVERTED
DIVERTED
FEWER
FEWER
CALLS
TOCALLS
TO POLICE
POLICE
TO POLICE
FEWER
FEWER
EMERGENCY
EMERGENCY
DEPARTMENT
DEPARTMENT
DEPARTMENT
VISITS
VISITS
VISITS
COSTS
COSTS
COSTS DIVERTED
DIVERTED
DIVERTED
Thanks to our supporters who made this evaluation possible:
Cambridge and North Dumfries
A copy of the executive summary and full report may be accessed at taylornewberry.ca 4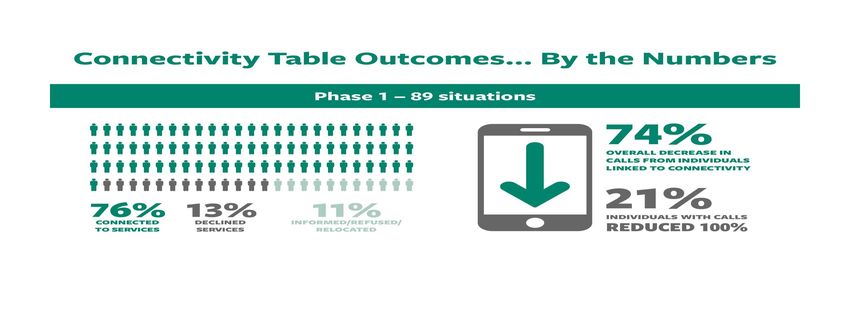
Connectivity Waterloo Region

   WWLHIN Presentation
    November 14, 2018
What is Connectivity?
•   Multi-sectoral model
•   Collaboratively and proactively address situations of elevated risk
•   Immediately responsive (e.g. same day or next day).
•   Long term vision - reduce crime, emergency room admissions,
    police calls for service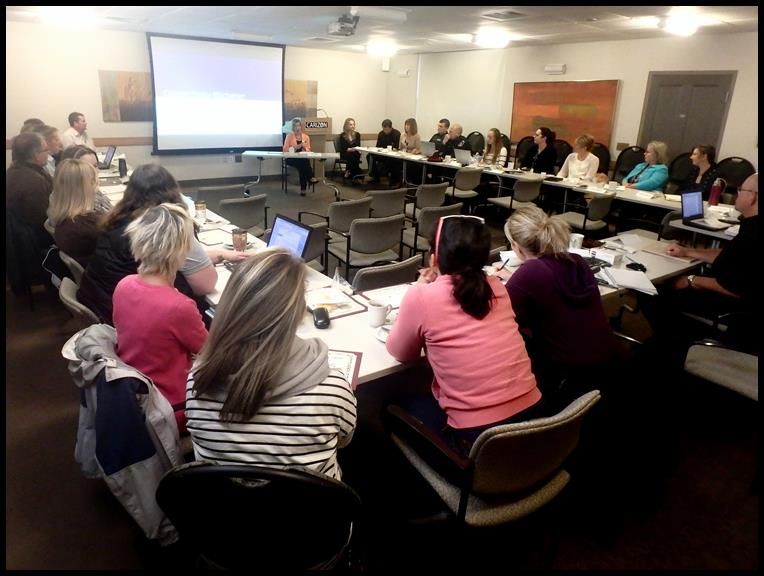
Background

 Model
 introduced to
 Waterloo Region
 by WRPS,
 WWLHIN, and       Cambridge Table begins   KW4 Table begins
 WCPC              – chaired by Langs       – chaired by Carizon

Jan 2013               Jan 2014               Oct 2014
Why Connectivity was Needed in Waterloo Region High rates of alcohol use Serious mental health issues High risk of homelessness Growing income disparity Higher youth crime rate 80% of WRPS calls not crime-related
THE CONNECTIVITY TABLE PROCESS
Connectivity Table Members
Health                                                  Ministry of Children and Youth Services;
Canadian Mental Health Association;                     Sexual Assault Domestic Violence Treatment Centre;
Ray of Hope (Youth Addiction Services);                 Sexual Assault Support Centre;
LHIN Home & Community Care/Elder Abuse Response Team;   St. John’s Kitchen/The Working Centre;
Grand River Hospital;                                   Supportive Housing of Waterloo;
Cambridge Memorial Hospital                             Victim Services Waterloo Region;
House of Friendship – Addictions                        White Owl Native Ancestry Association;
Community Ward/Health Link;                             Wilmot Family Resource Centre;
Langs CHC                                               YWCA Kitchener-Waterloo.
Stonehenge;
                                                        Justice Services:
Social Services                                         Waterloo Regional Police Service;
Cambridge Self Help Food Bank;                          Youth Justice Services
Cambridge Shelter Corporation;                          Ministry of Community Safety and Correctional Services;
Carizon Family and Community Services;
Developmental Services Resource Centre;                 School Boards
Family and Children Services;                           Waterloo Catholic District School Board;
Region of Waterloo Social Services,                     Waterloo Region District School Board
Interfaith Community Counselling Centre;
oneRoof;
Lutherwood
Commitment to Working Differently Together
Number of Situations Addressed

  2016              2017            Jan to Sept 2018

  112 situations   140 situations       97 situations
    addressed        addressed           addressed

  78 situations     73 situations       56 situations
 mitigated away    mitigated away      mitigated away
 from the table    from the table      from the table
Top Issues Addressed (2017) Mental Health Physical Health Criminal Involvement Physical Violence Drugs/Addictions Emotional Violence Alcohol Suicide Antisocial Behaviour
Protective Factors Identified (2017)
                       160
Number of Protective
 Factors Identified

                       140
                       120
                       100
                        80
                        60
                        40
                        20
                         0
                             Total Number      Stable   Both parents   Financial   Positive     Linked to
                              of Situations   Housing   helping with   Support      Family    primary care
                                                         childcare                 Support      provider
Some Key Milestones to Date 2 External Evaluations 1 International Award 100 Staff and senior leaders oriented about privacy and agreement 69 Guests and visitors from across the province
Connectivity Table Evaluation – Phase 1
Connectivity Table Evaluation – Phase 2
Strategic Links to the LHIN Business Plan Population health approach Addresses health equity Brings together system leaders Improves access to quality, coordinated mental health and addictions services in each sub-region Residents experience impactful change due to the collective impact of community- based initiatives Improved health and wellbeing of the most vulnerable residents across Waterloo Wellington
“I’m doing things way
differently because I see real
 possibility to effect change,
  whereas before I was just
  shuffling the same people
 around. I check into things,
   knowing we can actually
 make a difference, whereas
before it was…okay, I’ve been
  to this house 30 times this
month, I guess we’ll be there
 30 times again next month.”

  Community Resource Officer,
 Waterloo Regional Police Service
You can also read