Lower 31.3 Acres, including riverfront parcels, remain open space and will be donated to the Town at no cost - Town of Tyngsborough
←
→
Page content transcription
If your browser does not render page correctly, please read the page content below
___
    ___
         ___
             Lower 31.3 Acres,
             including riverfront parcels,
             remain open space and will
             be donated to the Town at

         _ __no cost.
   _ ___
__
MEMORANDUM
TO: Matt Hanson, Town Administrator, Town of Tyngsborough, MA
FROM: Hannah Mazzaccaro, AICP
CC: David Bauer & Shawn Nuckolls, Toll Brothers, Inc.
DATE: January 23, 2020
RE: Tyngsboro Country Club Development Proposal FISCAL IMPACT ANALYSIS
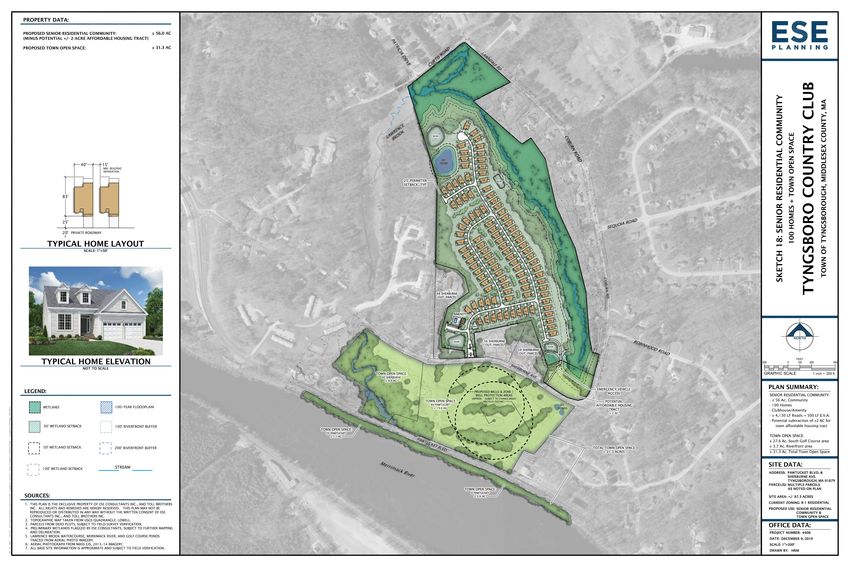
ESE Consultants was retained by Toll Brothers to analyze the tax revenue implications of a proposed Active
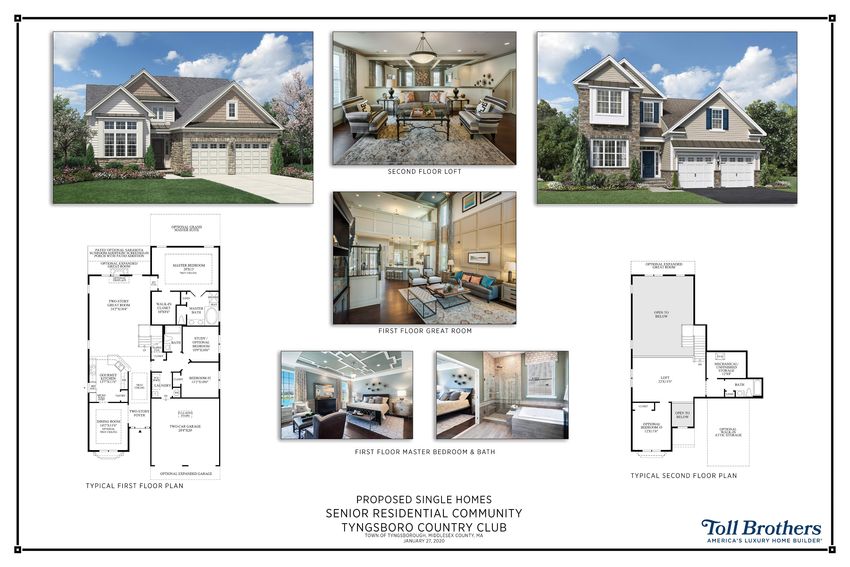
Adult Community on the Town of Tyngsborough. Toll Brothers is proposing a 100-unit age-restricted
development on the Tyngsboro Country Club, comprised of detached single condominium homes
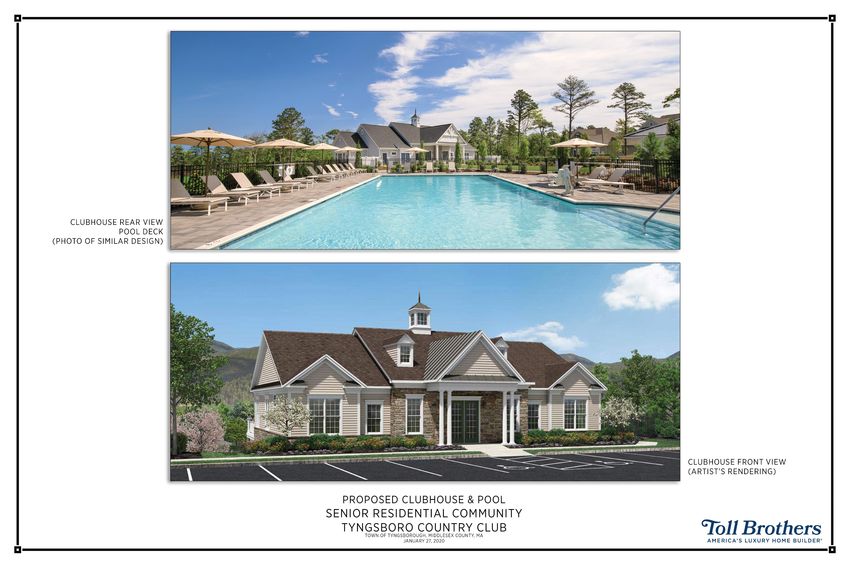
surrounded by open space land, served by private roads and a private clubhouse and pool, as depicted on
the site plan prepared by ESE Consultants titled “Sketch 18: Senior Residential Community,” dated
December 9, 2019.
The subject property is a total of ± 88.7 acres, of which ± 56.7 acres are proposed for development and
the remaining ± 32 acres will be donated to the town as open space and a potential site for affordable
housing units. Access to the property is from Sherburne Avenue, just west of the existing house at 56
Sherburne Avenue. The site is currently zoned R-1 Low Density Residential; Toll Brothers plans to apply
for a re-zoning of the property to allow a Senior Residential Community.
As an alternative, if a senior community is not approved for this site, Toll Brothers will develop a
conventional subdivision of thirty-seven (37) ± 65,000 square foot lots on the full ± 88.7-acre site.
ESE Consultants used the “Per-Capita Multiplier Method” of fiscal impact analysis to project the annual
cost that the town will incur to provide services on a per-person basis to residents of the new homes
(using the 2019 town budget) and projected the tax revenue each home will pay, to determine the net
fiscal impact of the homes on the town budget. ESE projected the fiscal impacts of both the Senior
Residential Community scenario (100 age-restricted homes) and the conventional subdivision scenario
(37 single-family home lots).
This analysis determined that the proposed Active Adult Overlay will provide a large surplus of annual tax
revenue to the town. The proposed development will be age-restricted to adults 55 and older, therefore
the new homes will not add any education costs. Education costs are the biggest budget item funded by
Tyngsborough taxpayers. ESE’s projection shows that each new senior home in Tyngsborough will provide
almost $7,350 in surplus property tax revenue, paying more into the tax base than they will consume in
local services. This estimate is consistent with the results seen in towns with existing age-restricted
residential communities
ESE Consultants, Inc.
250 Gibraltar Road · Suite 2E · Horsham, PA 19044
(215) 914-2050The alternative scenario of a “by right” conventional subdivision, conforming to existing R-1 zoning,
creates a net tax deficit for Tyngsborough, with the new homes consuming more in services – primarily
educational services – than they will pay in property taxes. Based on a per capita analysis, the 37 new
homes will house 128 residents, 30 of whom will be school-aged children attending local public schools.
Due to the high cost of education, ESE projects that each new home will create a fiscal deficit of
approximately $9,220 per home, per year.
Option A: Senior Residential Community Development Summary:
• (100) age-restricted single homes in Tyngsborough, average delivered price $590,000
• Private community amenities including a clubhouse and pool
• ± 30 acres of private condominium open space in the community
• ± 32 acres of public open space donated to the town
• Net fiscal SURPLUS of ± 7,350 per home, per year
Annual Property Tax Annual NET SURPLUS
Taxing Entity Annual Cost of Services
Revenue From New Homes
Town of Tyngsborough
(Including Schools)
$ 910,813 ($ 176,130) $ 734,683
(Average $9,108 / Home) (Average $1,761 / Home) (Average $7,347 / Home)
Option B: Conventional Subdivision Development Summary:
• (37) 65,000 SF minimum lots in Tyngsborough
• All ± 88.7 acres allotted to individual property owners
• Public street layouts proposed to serve residential lots
• Net fiscal DEFICIT of ± 9,220 per home, per year
Annual Property Tax Annual NET DEFICIT
Taxing Entity Annual Cost of Services
Revenue From New Homes
Town of Tyngsborough
(Including Schools)
$ 268,304 ($ 572,558) ($ 304,254)
(Average $8,134 / Home) (Average $15,475 / Home) (Average $9,220 / Home)
See attached spreadsheets for detailed calculations and source data.
ESE Consultants, Inc.
250 Gibraltar Road · Suite 2E · Horsham, PA 19044
(215) 914-2050Toll Brothers Senior Residential Community Proposal: Fiscal Impact Analysis - January, 2020
Tyngsboro C.C. - Town of Tyngsborough, MA
Option A: Senior Residential Community
The following calculations model the impact of the proposed development on the FY 2019/2020
Budget, as though the homes were already built, using 2020 tax rate and 2019 budget numbers.
A. Estimated Number of New Residents
Average Number of
Unit Type Quantity New Homes Residents Per Unit* New Residents
Age-Restricted Single Homes 100 1.9 = 190
Total Homes 100 Total New Residents = 190
*Source: Average residents per age-restricted home from "Who Lives in New Jersey Housing," published by Rutgers
University Center for Urban Policy Research in 2006, "Part Two, Section F: Specialized Housing Residential Multipliers - Age-
restricted Housing." This publication is widely used for community impact analysis demographic projections in the
Northeastern U.S., and uses actual census data from age-restricted communities constructed between 1980 and 2000. This
analysis uses the multiplier for single-family detached age-restricted homes (1.57) and rounds up to 1.9, based on
household statistics from Toll Brothers' Regency at Methuen community.
B. Estimated Number of New Public School Children
Average Number School New School Age
Unit Type Quantity New Homes Age Residents Per Unit* Residents
Age Restricted Homes,
100 0 = 0
Limited to Residents 55+
Total Homes 100 Total New Pupils = 0
*Proposed community to be age-restricted to residents 55 and over, with no residents permitted under age 18, per the
Federal Housing for Older Persons Act (HOPA).
Page 1 of 7Toll Brothers Senior Residential Community Proposal: Fiscal Impact Analysis - January, 2020
C. Estimated Taxable Value of New Homes
Average Market Value Per Total Market
Number of New Homes Home* Value
Age-Restricted Single Homes 100 $ 590,000 = $ 59,000,000
TOTAL MARKET VALUE: $ 59,000,000
x EQUALIZATION RATIO**: 0.95
TOTAL ASSESSED TAXABLE VALUE OF PROPOSED HOMES: $ 56,050,000
*Average delivered market-rate home prices provided by Toll Brothers, based on own-company sales in the region for
similar home models, and based on local area comparable sales for new homes (all builders), using data from MLS reports
and proprietary market research data.
**According to the Massachusetts Department of Revenue, Division of Local Services, residential and commercial parcels in
Tyngsborough are assessed at 95% of their market value. Qualified Open Space parcels are assessed at 0% of their market
value. Personal Property (tangible goods) is assessed at 100% of market value.
D. Estimated Tax Revenue Generated by New Homes in Tyngsborough
Tax Rate per $1000 of
Assessed Value Total 2019 Tax
Receiving Entity (2020 Rate) Revenues
Town of Tyngsborough & Tyngsborough Public Schools $ 16.25 = $ 910,813
TOTAL ANNUAL PROPERTY TAX REVENUE: = $ 910,813
AVERAGE Property Tax Per New Home: = $ 9,108
Page 2 of 7Toll Brothers Senior Residential Community Proposal: Fiscal Impact Analysis - January, 2020
E. Estimated Annual Cost of Services for New Residents
Average Cost Per Resident Number of New Residents
or Pupil* or Pupils Total Annual Cost
Town of Tyngsborough: Per
Capita Tax-Supported Cost
of Municipal Services $ 927 190 = $ 176,130
Tyngsborough and Regional
Schools $ 14,930 0 = $ -
TOTAL ANNUAL COST OF PUBLIC SERVICES*: = $ 176,130
AVERAGE Service Cost Per New Home: = $ 1,761
*Per capita cost of municipal services is calculated by dividing total Town of Tyngsborough General Fund Budget amount
by number of residents, adjusted to subtract education costs and funds contributed by non-residential taxes and other local
revenue sources. The most recent source available for this data is the FY 20 Expense Report and Revenue Report, which
lists budgeted amounts for FY 2019. Tyngsborough's Total FY 2019 General Fund Budget was $40,925,045. Subtract
$23,319,696 for total education costs; subtract $4,369,595 for local receipts revenues (not taxes); the resulting amount to
be raised by taxes for municpal services is approximately $13,235,754. This amount divided by 12,418 residents (2019 US
Census population estimate), equals $1,066 cost per capita for municipal services. Approximately 13% of the annual tax
levy is paid by commercial and industrial property taxes and personal property taxes. The resulting per capita share of
municipal service costs paid by residential real property taxes, for residents of the Town of Tyngsborough, is approximately
$1,066*.87= $927 per capita, per year.
** Per Pupil Cost for Tyngsborough School District reported by Massachusetts Department of Elementary & Secondary
Education for Fiscal Year 2018. Tyngsborough pays into the regional school district budget as well.
F. Projected Net Annual Fiscal Impact on Town of Tyngsborough
Annual Property Tax Annual Net
Revenue Annual Public Cost SURPLUS
Town of Tyngsborough
(Including Schools) $ 910,813 $ (176,130) = $ 734,683
AVERAGE Net Surplus Per New Home: = $ 7,347
Page 3 of 7Toll Brothers Senior Residential Community Proposal: Fiscal Impact Analysis - January, 2020
Tyngsboro C.C. - Town of Tyngsborough, MA
Option B: Conventional R-1 Subdivision - 37 - 65,000 SF Lots
The following calculations model the impact of the proposed development on the FY 2019/2020
Budget, as though the homes were already built, using 2020 tax rate and 2019 budget numbers.
A. Estimated Number of New Residents
Average Number of
Unit Type Quantity New Homes Residents Per Unit* New Residents
4-Bdrm. Single Family
33 3.538 = 117
Market Rate Homes
3-Bdrm. Single Family
4 2.856 = 11
Affordable Homes
Total Homes 37 Total New Residents = 128
*Source: Average residents per home from "Who Moves Into Massachusetts Housing?" published by EConsult Solutions in
2017 (data from 2015). The publication analyzes actual census data from households that moved between 2008 and 2015.
This analysis uses the multiplier for single-family detached homes with 3 bedrooms (2.856) and 4 bedrooms (3.538).
B. Estimated Number of New Public School Children
Average Number School New School Age
Unit Type Quantity New Homes Age Residents Per Unit* Residents
4-Bdrm. Single Family
33 0.858 = 28
Market Rate Homes
3-Bdrm. Single Family
4 0.522 = 2
Affordable Homes
Total Homes 37 Total New Pupils = 30
*Source: Average residents per home from "Who Moves Into Massachusetts Housing?" published by EConsult Solutions in
2017 (data from 2015). This analysis uses the multiplier for School-Age Children in single-family detached homes with 3
bedrooms (.522) and 4 bedrooms (3.538).
Page 4 of 7Toll Brothers Senior Residential Community Proposal: Fiscal Impact Analysis - January, 2020
C. Estimated Taxable Value of New Homes
Average Market Value Per Total Market
Number of New Homes Home* Value
4-Bdrm. Single Family
33 $ 500,000 = $ 16,500,000
Market Rate Homes
3-Bdrm. Single Family
4 $ 220,000 = $ 880,000
Affordable Homes
TOTAL MARKET VALUE: $ 17,380,000
x EQUALIZATION RATIO**: 0.95
TOTAL ASSESSED TAXABLE VALUE OF PROPOSED HOMES: $ 16,511,000
*Average new market rate home price based on comparable sales for new 4-bedroom Toll Brothers homes. Average
affordable home price is afforable to a household making less than the median household income in Tyngsborough.
**According to the Massachusetts Department of Revenue, Division of Local Services, residential and commercial parcels in
Tyngsborough are assessed at 95% of their market value. Qualified Open Space parcels are assessed at 0% of their market
value. Personal Property (tangible goods) is assessed at 100% of market value.
D. Estimated Tax Revenue Generated by New Homes in Tyngsborough
Assessed Value Total 2019 Tax
Receiving Entity (2019 Rate) Revenues
Town of Tyngsborough & Tyngsborough Public Schools $ 16.25 = $ 268,304
TOTAL ANNUAL PROPERTY TAX REVENUE: = $ 268,304
AVERAGE Property Tax Per New Home: = $ 8,134
Page 5 of 7Toll Brothers Senior Residential Community Proposal: Fiscal Impact Analysis - January, 2020
E. Estimated Annual Cost of Services for New Residents
Average Cost Per Resident Number of New Residents
or Pupil* or Pupils Total Annual Cost
Capita Tax-Supported Cost
of Municipal Services $ 927 128 = $ 118,656
Tyngsborough and Regional
Schools $ 14,930 30 = $ 453,902
TOTAL ANNUAL COST OF PUBLIC SERVICES*: = $ 572,558
AVERAGE Service Cost Per New Home: = $ 15,475
*Per capita cost of municipal services is calculated by dividing total Town of Tyngsborough General Fund Budget amount
by number of residents, adjusted to subtract education costs and funds contributed by non-residential taxes and other local
revenue sources. The most recent source available for this data is the FY 20 Expense Report and Revenue Report, which
lists budgeted amounts for FY 2019. Tyngsborough's Total FY 2019 General Fund Budget was $40,925,045. Subtract
$23,319,696 for total education costs; subtract $4,369,595 for local receipts revenues (not taxes); the resulting amount to
be raised by taxes for municpal services is approximately $13,235,754. This amount divided by 12,418 residents (2019 US
Census population estimate), equals $1,066 cost per capita for municipal services. Approximately 13% of the annual tax
levy is paid by commercial and industrial property taxes and personal property taxes. The resulting per capita share of
municipal service costs paid by residential real property taxes, for residents of the Town of Tyngsborough, is approximately
$1,066*.87= $927 per capita, per year.
** Per Pupil Cost for Tyngsborough School District reported by Massachusetts Department of Elementary & Secondary
Education for Fiscal Year 2018. Tyngsborough pays into the regional school district budget as well.
F. Projected Net Annual Fiscal Impact on Town of Tyngsborough
Annual Property Tax Annual Net
Revenue Annual Public Cost DEFICIT
Town of Tyngsborough
(Including Schools) $ 268,304 $ (572,558) = $ (304,254)
AVERAGE Net Deficit Per New Home: = $ (9,220)
Page 6 of 7Toll Brothers Senior Residential Community Proposal: Fiscal Impact Analysis - January, 2020
Tyngsboro C.C. - Town of Tyngsborough, MA
2020 Tax Revenue - Parcels Proposed for Development:
ACRES 2020 ASSESSED
ADDRESS MAP-LOT (Assessor) OWNER VALUE
Parcel North of Sherburne Ave:
46 Sherburne Ave. 26-2 56.7 Tyngsboro Ltd. Partnership $ 460,000
Parcels South of Sherburne Ave: $ -
45 Sherburne Ave. 20-74 9.45 Tyngsboro Ltd. Partnership $ 187,100
80 Pawtucket Blvd. 27-73 18.81 Tyngsboro Ltd. Partnership $ 702,700
Riverfront Parcels:
0 Pawtucket Blvd. 27-74 2.6 Tyngsboro Ltd. Partnership $ 9,910
55 Pawtucket Blvd. 21-41 1.1 Tyngsboro Ltd. Partnership $ 15,100
TOTAL AREA: 88.66 Acres
FY 2020 TOTAL ASSESSED VALUE: $ 1,374,810
FY 2020 Tax Rate Per $1000: $ 16.25
Existing Tax Revenue - Parcels Proposed for Development & Open Space: $ 22,341
0
Page 7 of 7McMAHON ASSOCIATES
120 Water Street, 4 th Floor
Boston, MA 02109
p 617-556-0020 | f 617-556-0025
PRINCIPALS
Joseph J. DeSantis, P.E., PTOE
John S. DePalma
Casey A. Moore, P.E.
Gary R. McNaughton, P.E., PTOE
January 22, 2020 Christopher J. Williams, P.E.
ASSOCIATES
John J. Mitchell, P.E.
Scott P. Miccile, P.E. R. Trent Ebersole, P.E.
Matthew M. Kozsuch, P.E.
Sr. Land Development Manager
Maureen Chlebek, P.E., PTOE
Toll Brothers, Inc., New England Division Dean A. Carr, P.E.
Jason T. Adams, P.E., PTOE
134 Flanders Road, Suite 275 Christopher K. Bauer, P.E., PTOE
Westborough, MA 01581 FOUNDER
Joseph W. McMahon, P.E.
RE: Preliminary Traffic Assessment
Proposed Senior Residential Community
Tyngsboro, MA
Dear Mr. Miccile,
McMahon Associates has prepared a preliminary traffic assessment for the proposed redevelopment of
the existing Tyngsboro Country Club located along Sherburne Avenue in Tyngsboro, Massachusetts
(Figure 1). The assessment is based on a Concept Sketch prepared by ESE Consultants dated December
9, 2019. The site currently houses a nine-hole golf course with associated amenities and the proposed
project would convert the existing use into a senior residential community with 100 detached
residences and associated amenities. The following memorandum outlines the adjacent roadway
conditions, summarizes existing roadway volumes, compares trip generation between existing and
proposed land uses, and includes a sight distance summary at the proposed site access location.
Existing Transportation Infrastructure
Sherburne Avenue generally extends in a northwest-southeast direction, north of Pawtucket Boulevard
(Route 113). The roadway is classified as an urban minor arterial and is under Town of Tyngsboro
jurisdiction. Sherburne Avenue is a two-lane, two-way roadway with 11-foot travel lanes and one-foot
wide shoulders, mainly providing access to residential land uses. The posted speed limit on Sherburne
Avenue is 30 miles per hour.
Automated Traffic Recorder Counts
To assess daily traffic volumes along Sherburne Avenue, an ATR count was conducted on Sherburne
Avenue west of Cardinal Lane, for a 48-hour day period from Tuesday April 24, 2018 to Wednesday
April 25, 2018.
Engineering | Planning | Design | Technology mcmahonassociates.comScott P. Miccile, P.E.
January 22, 2020
Page 2 of 4
Table 1: Automated Traffic Recorder Data
Street Direction ADT AM Peak PM Peak 85th Percentile Speed Heavy Vehicle %
Sherburne Eastbound 3,270 160 410 38 mph 4.8%
Avenue Westbound 2,430 180 200 38 mph 4.4%
Overall 5,700 340 610 38 mph 4.6%
Along Sherburne Avenue, the overall average daily traffic (ADT) volume recorded was approximately
5,700 vehicles, with approximately 3,270 vehicles travelling eastbound, and approximately 2,430
vehicles travelling westbound. The weekday morning peak hour along Sherburne Avenue occurs
between 7:00 AM and 8:00 AM with a total peak hour volume of approximately 340 vehicles. The
weekday afternoon peak hour along Sherburne Avenue occurs between 4:45 PM and 5:45 PM with a
total peak hour volume of approximately 610 vehicles.
As discussed, the posted speed limit in the vicinity of the project site is 30 miles per hour on Sherburne
Avenue. The 85th percentile speed was shown to be 38 miles per hour in both the eastbound and
westbound direction of travel on Sherburne Avenue. Approximately 4.6% of traffic on Sherburne
Avenue can be attributed to heavy vehicles, such as buses, single unit trucks, and tractor trailers.
Site-Generated Traffic
In order to estimate the number of vehicle trips associated with the proposed senior residential
community, the Institute of Transportation Engineers’ (ITE) publication, Trip Generation Manual, 10th
Edition, was referenced. ITE is a national research organization of transportation professionals, and Trip
Generation Manual, 10th Edition provides traffic generation information for various land uses compiled
from studies conducted by members nationwide. Vehicle trip estimates for the existing golf course and
for the proposed senior residential community were based on data for Land Use Code 430 (Golf
Course) and 251 (Senior Adult Housing - Detached), respectively. The ITE data establishes vehicle trip
rates based on actual traffic counts conducted at similar existing land uses.
Table 2 presents a comparison of the estimated project site trips generated during the weekday
morning and afternoon peak hours, and for a typical weekday.
Table 2: Proposed Project Trips
Weekday AM Weekday PM Weekday Daily
Description Size In Out Total In Out Total In Out Total
(1)
Proposed Project Trips 100 units 13 27 40 29 19 48 281 281 562
(2)
- Existing Project Site Trips 9 holes 13 3 16 14 12 26 106 106 212
Total "New" Project Trips 0 24 24 15 7 22 175 175 350
(1) ITE Land Use Code 251 (Senior Adult Housing - Detached), based on 100 dwelling units.
(2) ITE Land Use Code 430 (Golf Course), based on 9 holes.Scott P. Miccile, P.E. January 22, 2020 Page 3 of 4 As shown in Table 2, the proposed project is estimated to generate approximately 350 additional vehicle trips (175 entering and 175 exiting vehicles) compared to the estimated trips of the existing Tyngsboro County Club during a typical weekday. During the weekday morning peak hour, the proposed project is estimated to generate approximately 24 additional vehicle trips (0 entering vehicles and 24 exiting vehicles). During the weekday afternoon peak hour, the proposed project is estimated to result in approximately 22 additional vehicle trips (15 entering vehicles and 7 exiting vehicles). The number of total project trips would result in one entering or exiting vehicle every one to two minutes during the weekday morning and weekday afternoon peak hours. Sight Distance Access to the project site is proposed to be maintained by one full-access driveway for visitors and residents and one emergency vehicle access driveway, each located on Sherburne Avenue. McMahon Associates completed a review of the available sight distance at the proposed full-access site driveway location. Based on ATR data summarized above, the 85th percentile vehicle speed along Sherburne Avenue is 38 miles per hour in both directions, which was utilized for this review. The American Association of State Highway and Transportation Officials (AASHTO) publication, A Policy on Geometric Design, 2018 Edition, defines acceptable sight distances at intersections. The minimum sight distance is based on the stopping sight distance (SSD) for vehicles traveling along the main road. The sight distance that allows vehicles to enter the main street traffic flow without requiring the mainline traffic to slow to less than 70% of their speed and is referred to as intersection sight distance (ISD). According to AASHTO, “If the available sight distance for an entering or crossing vehicle is at least equal to the appropriate stopping sight distance for the major road, then drivers have sufficient time to anticipate and avoid collisions.” Sight distances at the proposed full-access driveway are currently limited by horizontal and vertical curvatures in the roadway. Due to existing physical characteristics of the Sherburne Avenue, sight distance measurements were limited to being taken from five feet back from the travel lane. Based on these conditions, the measured sight distance looking left (east) and looking right (west) is approximately 400 feet and 375 feet, respectively. For vehicle speeds of 38 miles per hour, the required stopping sight distance 280 feet, which is exceeded for a driver’s sight line at 5 feet back from the roadway. Based on the anticipated conditions under the proposed project, the minimum sight distance requirements are expected to be met for 85th percentile vehicle speeds along Sherburne Avenue from further back from the roadway, providing safe access to and from the project site. Conclusion Based on the review of the information presented in this assessment, the following summary is provided regarding the existing conditions and the potential traffic impacts of the proposed redevelopment of the Tyngsboro Country Club into a senior residential community.
Scott P. Miccile, P.E.
January 22, 2020
Page 4 of 4

    •    Sherburne Avenue has an ADT of approximately 5,700 total vehicles per day (340 total during
         weekday morning peak hour and 610 total during weekday afternoon peak hour) with an 85th
         percentile speed of 38 miles per hour and approximately 4.6% heavy vehicles.

    •    The proposed senior residential community is estimated to result in approximately 24
         additional vehicle trips during the weekday morning peak hour and approximately 22
         additional vehicle trips during the weekday afternoon peak hour, over the existing golf course
         use.

    •    Sight distance for the proposed full-access site driveway looking both directions is expected to
         satisfy AASHTO minimum sight distance for the existing 85th percentile speed.

Please do not hesitate to contact me should you require any further information.

Sincerely,

Erin Fredette, P.E.
Project Manager
³
Cobur
n Road
SITE
Sherbu
rn e Avenu
e
Paw
tu cke
t Bou
l eva
rd
0 285 570 1,140
Feet
Figure 1
Site Location Map
Senior Residential Community
Tyngsboro, MassachusettsYou can also read