Company Results Asian Pay Television Trust China Everbright Water CNMC Goldmine Holdings - POEMS
←
→
Page content transcription
If your browser does not render page correctly, please read the page content below
20 Nov 17, 8.15am/11.15am Morning Call/Webinar

                                                                                                                                                                    Company Results
                                                                                                                                                                           Asian Pay Television Trust
                                                                                                                                                                                   China Everbright Water
                                                                                                                                                                          CNMC Goldmine Holdings
                                                                                                                                                     Health Management International
                                                                                                                                                                                             Old Chang Kee

                                                                                                                                                                                               IPO Brief
                                                                                                                                                                                             RE&S Holdings

Phillip Securities Research Pte Ltd (A member of PhillipCapital) Co. Reg. No. 198803136N © PhillipCapital 2017. All Rights Reserved. For internal circulation only.
Disclaimer: The information contained in this document is intended only for use during the presentation and should not be disseminated or distributed to parties outside the presentation.
Phillip Securities accepts no liability whatsoever with respect to the use of this document or its contents.
Asian Pay Television Trust
                                                                                                                                              Guiding for 11% yield for 2018

                                                                                                                                                                                                                     Paul Chew
                                                                                                                                                                                             Phillip Securities Research Pte Ltd
                                                                                                                                                                                                            20 November 2017

Phillip Securities Research Pte Ltd (A member of PhillipCapital) Co. Reg. No. 198803136N © PhillipCapital 2017. All Rights Reserved. For internal circulation only.
Disclaimer: The information contained in this document is intended only for use during the presentation and should not be disseminated or distributed to parties outside the presentation.
Phillip Securities accepts no liability whatsoever with respect to the use of this document or its contents.
Asian Pay Television (D/grade to ACCUMULATE, TP:S$0.64 (unchanged))
• Positives
Management has guided 6.5 cents DPU for FY18 (10.9% yield @ S$0.595 closing price).
Cable subscribers were stable and churn remains low; CapEx will decline in FY18e.
• Negatives
ARPU remains sluggish across all 3 business segments – pay-TV, broadband and premium TV
Still reliant on incremental debt to sustain dividends.
• Outlook
Our downgrade to ACCUMULATE is due solely to the price appreciation of APTV.
Outlook basically stable and cash-flows will improve as one-off premium digital capex ends.
Phillip Securities Research Pte Ltd (A member of PhillipCapital) Co. Reg. No. 198803136N © PhillipCapital 2017. All Rights Reserved. For internal circulation only.
Disclaimer: The information contained in this document is intended only for use during the presentation and should not be disseminated or distributed to parties outside the presentation.
Phillip Securities accepts no liability whatsoever with respect to the use of this document or its contents.
China Everbright Water Limited
                                                                                                                                                                              Executed as planned

                                                                                                                                                                                                                Chen Guangzhi
                                                                                                                                                                                             Phillip Securities Research Pte Ltd
                                                                                                                                                                                                            20 November 2017

Phillip Securities Research Pte Ltd (A member of PhillipCapital) Co. Reg. No. 198803136N © PhillipCapital 2017. All Rights Reserved. For internal circulation only.
Disclaimer: The information contained in this document is intended only for use during the presentation and should not be disseminated or distributed to parties outside the presentation.
Phillip Securities accepts no liability whatsoever with respect to the use of this document or its contents.
China Everbright Water Limited
(Buy (maintained), TP: S$0.59, FY17e DPU: 0.5 SG cents)
Results at a glance
(HK$ mn) 3Q17 3Q16 YoY (%) Comments
Revenue 746.1 553.5 34.8 Construction of the sponge city construction project and the river-basin
ecological restoration project in addition to the expansion and upgrading of
several waste water treatment plants which were under construction
Gross profit 297.2 222.8 33.4 Increase in construction services where margin is lower than the operation
services
EBIT 279.5 197.0 41.9 In line with the above
PATMI 122.8 91.1 34.8 Higher borrowing costs and tax expenses
Source: Company , PSR
Accelerating project acquisitions and construction
6 new projects secured in 3Q17 (total investment: Rmb1.8bn+, designed daily water treatment
capacity: 130k tonnes)
9M17 ramp-up of daily designed capacity: 500k+ tonnes
Total daily designed capacity: 5mn+ tonnes
As of Sep-17, 93 projects secured (under operation: 77,under construction:10, preparatory stage:
5, completed to be operational soon: 1)
Outlook
Public private partnership (PPP) risks in China:
Quite a few projects sealed have yet to be implemented
Some local governments’ weaker ability to meet their obligations
The 19th National Congress of the Communist Party reinforced the establishment of ecological
civilisation and environmental protection
Phillip Securities Research Pte Ltd (A member of PhillipCapital) Co. Reg. No. 198803136N © PhillipCapital 2017. All Rights Reserved. For internal circulation only.
Disclaimer: The information contained in this document is intended only for use during the presentation and should not be disseminated or distributed to parties outside the presentation.
Phillip Securities accepts no liability whatsoever with respect to the use of this document or its contents.
5
CNMC Goldmine Holdings Limited
                                                                                                  Carbon-in-leach plant enters into a trial run

                                                                                                                                                                                                                Chen Guangzhi
                                                                                                                                                                                             Phillip Securities Research Pte Ltd
                                                                                                                                                                                                            20 November 2017

Phillip Securities Research Pte Ltd (A member of PhillipCapital) Co. Reg. No. 198803136N © PhillipCapital 2017. All Rights Reserved. For internal circulation only.
Disclaimer: The information contained in this document is intended only for use during the presentation and should not be disseminated or distributed to parties outside the presentation.
Phillip Securities accepts no liability whatsoever with respect to the use of this document or its contents.
CNMC Goldmine Holdings Limited
(Neutral (maintained), TP: S$0.30)
Results at a glance
(USD mn) 3Q17 3Q16 YoY (%) Comments
Revenue 4.71 8.46 (44.3) 41.3% YoY decrease in sales volume and 5.2% YoY
decrease in average realised gold price
Operating profit (0.02) 2.24 N.M. In line with the above
PBT 0.17 0.31 (44.4) In line with the above
PATMI 0.96 1.76 (45.8) In line with the above
N.M.: not meaningful
Source: Company , PSR
Carbon-in-leach (CIL) plant has been completed
Total capex for the plant: < RM25mn (c.US$6mn) (substantially lower than market rate)
18,000 tonnes of higher grade ore explicitly stockpiled for the ramp-up in operation
Operational costs of CIL plant are estimated to be comparable to those of heap leach plants
Sokor, Pulai and KelGold project are progressing
Low ore grade issue protracted while the gold price was flattish
3Q sales volume: 3,691oz (Down 41.3% YoY)
9M17 sales volume:11,197oz (48% of the total volume in 9M16)
3Q17 ASP: US$1,275/oz in 3Q17 (3Q16: US$1,345/oz).
9M17 ASP: US$1276/oz (Up 1.1% YoY)
Phillip Securities Research Pte Ltd (A member of PhillipCapital) Co. Reg. No. 198803136N © PhillipCapital 2017. All Rights Reserved. For internal circulation only.
Disclaimer: The information contained in this document is intended only for use during the presentation and should not be disseminated or distributed to parties outside the presentation.
Phillip Securities accepts no liability whatsoever with respect to the use of this document or its contents.
7Health Management International
Surge in foreign patients
Soh Lin Sin
Phillip Securities Research Pte Ltd
20 November 2017
Phillip Securities Research Pte Ltd (A member of PhillipCapital) Co. Reg. No. 198803136N © PhillipCapital 2017. All Rights Reserved. For internal circulation only.
Disclaimer: The information contained in this document is intended only for use during the presentation and should not be disseminated or distributed to parties outside the presentation.
Phillip Securities accepts no liability whatsoever with respect to the use of this document or its contents.Health Management International
(Buy, TP: $0.83, Last: $0.69)
Results at a glance
(MYR mn) 1Q18 1Q17 YoY (%) Comments Update:
Healthcare 112.2 105.6 6.3% Higher patient load (+5.4% YoY) and revenue intensity
Education 4.9 3.9 25.6% Higher student headcount Heliconia Capital Management
Revenue 117.1 109.5 6.9% As above invested c.S$11.0mn or 2.0%
Gross profit 40.6 37.8 7.4% Gross Margin +20bps to 34.7%
stake in HMI
EBITDA 28.7 25.8 11.0% Lower share-based payment offsets increased marketing
expenses
EBITDA Margin +90bps to 24.5%
NPAT 13.8 14.5 -5.0% Higher finance costs and FX losses (due to weaker MYR)
Exclude non-operational and one-off items, Core NPAT +1.4% YoY
PATMI 13.8 6.2 123.4% Post-consolidation of NCI
Source: Company, PSR
Foreign patient load grew at its highest pace since FY2015, at +27.9% YoY in 1Q18; Local patient load +7.6% YoY
On track to pare down 50% of acquisition debt by Dec-17
Has already paid down c.35% with remaining RM25mn repayment in 2Q18; Generated OCF of RM31mn in 1Q18
Upgrading and expansion plans for Mahkota and Regency on track to meet the increasing medical demand
Both hospitals will add 34 operational beds each, total bed capacity to reach 500 by FY18
New hospital extension block at Regency: Double current’s capacity to 500-bed hospital eventually; Construction is to
commence in FY18 upon approvals and is slated to commission in FY21
Phillip Securities Research Pte Ltd (A member of PhillipCapital) Co. Reg. No. 198803136N © PhillipCapital 2017. All Rights Reserved. For internal circulation only.
Disclaimer: The information contained in this document is intended only for use during the presentation and should not be disseminated or distributed to parties outside the presentation.
Phillip Securities accepts no liability whatsoever with respect to the use of this document or its contents.
9Old Chang Kee
Transformation almost complete
Soh Lin Sin
Phillip Securities Research Pte Ltd
20 November 2017
Phillip Securities Research Pte Ltd (A member of PhillipCapital) Co. Reg. No. 198803136N © PhillipCapital 2017. All Rights Reserved. For internal circulation only.
Disclaimer: The information contained in this document is intended only for use during the presentation and should not be disseminated or distributed to parties outside the presentation.
Phillip Securities accepts no liability whatsoever with respect to the use of this document or its contents.Old Chang Kee
(Buy, TP: $0.98, Last: $0.76)
Results at a glance
S$ mn 1H18 1H17 YoY (%) Comments
Revenue 42.0 38.8 8.2% Contributions from new outlets and increased sales in
existing outlets
Zero net store opening YoY; no. of outlets in SG at 87
Gross profit 25.4 24.6 3.5% Higher raw material costs and one-time factory test-runs
Gross margin -2.7pps to 60.5%
EBITDA 5.0 6.1 -18.2% Lower government grant
EBITDA margin -3.8pp to 11.9%
Net profit 1.4 2.5 -42.9% -40.7% YoY if exclude S$0.53mn start-up losses in UK
Higher Effective Tax Rate at 24.2% vs 20.7% in 1H17
DPS (cents) 1.50 1.50 0.0% Dividend payout ratio at 128% of NPAT vs 73% in 1H17
Source: Company, PSR
Continue store network expansion
3 net new stores in 3Q18; We expect OCK’s store count would reach 92 by end-FY18
One-off disruptions during factory integration process in 2Q18
Slower puff innovations and integration cost
Coupled with higher raw material costs, do not expect FY18e gross margin to restore to the 63% level
Majority of the factory integration has been completed and is on track for full integration by 3Q18; Production
has now stabilized with a higher production capacity and efficiency
Phillip Securities Research Pte Ltd (A member of PhillipCapital) Co. Reg. No. 198803136N © PhillipCapital 2017. All Rights Reserved. For internal circulation only.
Disclaimer: The information contained in this document is intended only for use during the presentation and should not be disseminated or distributed to parties outside the presentation.
Phillip Securities accepts no liability whatsoever with respect to the use of this document or its contents.
11RE&S Holdings
Quick-Service Restaurants to drive growth
Soh Lin Sin
Phillip Securities Research Pte Ltd
20 November 2017
Phillip Securities Research Pte Ltd (A member of PhillipCapital) Co. Reg. No. 198803136N © PhillipCapital 2017. All Rights Reserved. For internal circulation only.
Disclaimer: The information contained in this document is intended only for use during the presentation and should not be disseminated or distributed to parties outside the presentation.
Phillip Securities accepts no liability whatsoever with respect to the use of this document or its contents.RE&S Holdings
(Subscribe, IPO Price: $0.22)
A concept owner and operator of F&B Outlets in SG and MY that provides
customers with authentic Japanese cuisine and dining experiences
39 Full-Service Restaurants (74.4% of FY2017 Revenue)
38 Quick-Service Restaurants, Food Kiosks, Japanese Bakery and Food Retail
Outlets (25.6% of FY2017 Revenue)
The Group also supply Japanese food products which it manufactures to third-
party businesses in Singapore
No fixed dividend policy, but intends to distribute dividends of at least 35.0% FY17 Revenue by Geography
of PATMI in each of FY2018 and FY2019
Others
Singapore
4%
96%
Phillip Securities Research Pte Ltd (A member of PhillipCapital) Co. Reg. No. 198803136N © PhillipCapital 2017. All Rights Reserved. For internal circulation only.
Disclaimer: The information contained in this document is intended only for use during the presentation and should not be disseminated or distributed to parties outside the presentation.
Phillip Securities accepts no liability whatsoever with respect to the use of this document or its contents.
13SWOT Analysis
Established track record and well-recognised brand in Competitive business landscape
Singapore Labour intensive
Strong and dedicated management team and employees
Diversified business portfolio:
(a) Advantage in bargaining for new or to renew leases
Weakness
Strength
(b) Different price points capturing different market
segments and to weather through economic cycle
(c) Diversify risk of fast-changing consumer preferences
Economies of scale:
(a) Ability to scale up fast; and
(b) Increase efficiency with consistent quality
Refurbish and improve production processes at its Regulatory changes
existing F&B Outlets Supply shock on raw materials and labour
Opportunities
Expand its stores network domestically or regionally Outbreaks of diseases or viruses in livestock or
Increase its sales channels under consignment food scares
Threats
arrangement or via online food delivery
Introduction of new dining concept or brands
Tap into the market for ready-to-eat (RTE) meals
Acquisitions, joint ventures and strategic partnerships
Phillip Securities Research Pte Ltd (A member of PhillipCapital) Co. Reg. No. 198803136N © PhillipCapital 2017. All Rights Reserved. For internal circulation only.
Disclaimer: The information contained in this document is intended only for use during the presentation and should not be disseminated or distributed to parties outside the presentation.
Phillip Securities accepts no liability whatsoever with respect to the use of this document or its contents.
14Financial Highlights
Revenue PATMI Do not expect a rosy 1H18 earnings
Quick-Service Restaurants PATMI
Full-Service Restaurants %YoY PATMI (RHS) Downtime costs and equipment write-offs from the
%YoY Total Revenue (RHS)
150 6% 8 120% reconstruction of Shokutsu Ten food street into a
S$ mn
S$ mn
Japanese food alley at Jurong Point in 1Q18
6
100 4% 60% IPO expenses in 2Q18
4 Earnings should normalize in 2H18
50 2% 0%
2
0 0% 0 -60%
FY15 FY16 FY17 FY15 FY16 FY17
Financial position to improve post-IPO
Net debt of S$2.65mn from S$13mn; Net gearing at
Operating Expenses Margins
-100 Gross EBITDA PATMI
0.17x from 0.63x
S$ mn
Employee benefits expense
-80 Operating lease expenses The debt is manageable with its healthy operating
80% 72.4% 71.5% 71.9%
Utilities expenses cash flow of over S$17mn p.a.
-60 Depreciation expense
60%
Other expenses
-40 40%
-20 20% 10.4% 8.6% 11.1%
0 4.5% 2.2% 4.0%
0%
FY15 FY16 FY17 FY15 FY16 FY17
Phillip Securities Research Pte Ltd (A member of PhillipCapital) Co. Reg. No. 198803136N © PhillipCapital 2017. All Rights Reserved. For internal circulation only.
Disclaimer: The information contained in this document is intended only for use during the presentation and should not be disseminated or distributed to parties outside the presentation.
Phillip Securities accepts no liability whatsoever with respect to the use of this document or its contents.
15Fast Growing QSR Segment
Store Count Revenue per Outlet
No. of Quick-Service Restrautants Full-Service Restaurants
100 No. of Full-Service Restrautants 4,000 Quick-Service Restaurants Tapping into the fast-growing and higher
80 9.0% 8.6%
margin Quick-Service Restaurants
3,000
60 32 35
segment and ready-to-eat meals
38
2,000
40 3.3%
5.3% Increasing demand for convenience and
20 43 41 39
1,000 food delivery services in Singapore
0 0 Leverage on the factory capacity to ramp
FY15 FY16 FY17 FY15 FY16 FY17
up production for its takeaway and ready-
to-eat meals
EBITDA EBITDA Margins
Others Full-Service Restaurants Quick-Service Restaurants has a faster
Quick-Service Restaurants Quick-Service Restaurants
40
Full-Service Restaurants
50% 20% 19.1% turnover and lesser operating costs, thus
%YoY EBITDA (RHS)
yielding higher margins
S$ mn
18% 16.9%
16.1%
20 25%
16% 17.1%
14% 15.6%
0 0%
14.0%
12%
-20 -25% 10%
FY15 FY16 FY17 FY15 FY16 FY17
Phillip Securities Research Pte Ltd (A member of PhillipCapital) Co. Reg. No. 198803136N © PhillipCapital 2017. All Rights Reserved. For internal circulation only.
Disclaimer: The information contained in this document is intended only for use during the presentation and should not be disseminated or distributed to parties outside the presentation.
Phillip Securities accepts no liability whatsoever with respect to the use of this document or its contents.
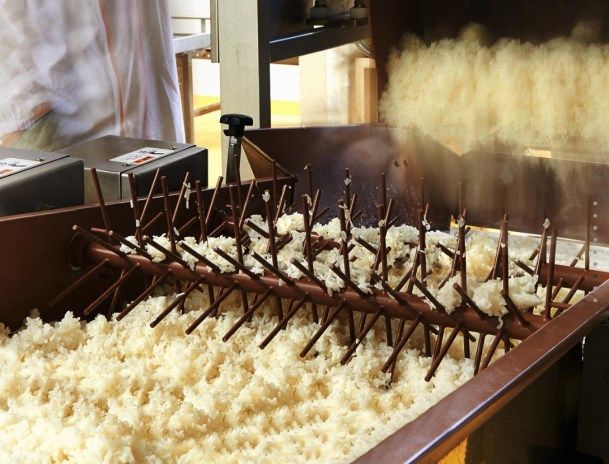
16Central Kitchen
Aggregate floor area of approximately 41,570 sqft; 12 food processing lines
Increase restaurant productivity with lower operating and labour costs
Enhance product consistency and safety
Conduct research and development of new concepts, dishes or to improve food preparation processes
Current utilization rate is at c.60%
Testing for Microb Rice Line Tamago Line Packaging Line
Source: Company Website
Phillip Securities Research Pte Ltd (A member of PhillipCapital) Co. Reg. No. 198803136N © PhillipCapital 2017. All Rights Reserved. For internal circulation only.
Disclaimer: The information contained in this document is intended only for use during the presentation and should not be disseminated or distributed to parties outside the presentation.
Phillip Securities accepts no liability whatsoever with respect to the use of this document or its contents.
17Peer Comparison
Revenue EBIT Profit
Mkt Cap Gorss Operating Net P/S P/E Div Yield Net D/E Growth Growth Growth
Company (SGD mn) Margin Margin Margin TTM TTM P/B (%) (%) ROE (%) (%) (%) (%)
RE&S Holdings Ltd 78 71.9 5.4 4.0 0.6 13.7 2.5 N/A 52.7 18.3 4.2 79.4 95.4
Market Cap Weighted Average 46.9 9.1 5.5 1.1 15.9 2.8 2.6 10.6 38.7 5.1 -59.8 16.7
Japan Foods Holding Ltd 75 84.9 7.7 7.1 1.2 17.4 2.4 4.6 Net Cash 13.7 4.2 24.8 23.3
ABR Holdings Ltd 151 44.4 5.8 5.2 1.4 30.4 1.6 3.2 Net Cash 5.1 3.5 -35.4 -29.2
Sakae Holdings Ltd 43 62.3 -10.4 -14.6 0.6 N/A 1.3 N/A 112.5 -20.5 -10.1 -2463.7 -172.9
Soup Restaurant Group Ltd 45 N/A 2.7 2.6 1.1 32.0 4.8 3.1 Net Cash 15.0 -6.4 -9.6 3.0
Jumbo Group Ltd 375 63.2 13.3 11.3 2.7 24.4 5.8 3.8 Net Cash 25.5 11.4 22.0 46.3
Katrina Group Ltd 47 14.8 6.0 4.2 0.8 18.3 3.3 3.0 Net Cash 15.6 8.4 -33.5 -44.4
Tung Lok Restaurants 2000 Ltd 63 71.9 -0.3 0.5 0.8 N/A 4.2 N/A Net Cash -4.9 -1.2 N/A -30.9
BreadTalk Group Ltd 439 54.9 5.7 1.9 0.7 20.7 3.3 3.2 29.1 16.4 -1.5 1.8 50.4
Kimly Ltd 423 21.6 14.9 7.1 N/A N/A N/A 0.8 Net Cash 107.7 10.4 8.6 5.3
Source: Bloomberg, Company
Operating Profit Margin (%) Net Profit Margin (%) T12M Growth (%)
RE&S Holdings Ltd RE&S Holdings Ltd RE&S Holdings Ltd
Japan Foods Holding Ltd Japan Foods Holding Ltd
Japan Foods Holding Ltd
15 Market Cap Weighted Average Market Cap Weighted Average
8 Market Cap Weighted Average
150
79.4 95.4
10 6 100
50 24.8 23.3 16.7
4 4.2 4.2 5.1
5 0
2
-50
0 0 -100 -59.8
Operating Margin Operating Margin Operating Margin Net Margin Net Margin Net Margin Revenue Growth EBIT Growth Profit Growth
-2fy -1fy -2fy -1fy (%) (%) (%)
Phillip Securities Research Pte Ltd (A member of PhillipCapital) Co. Reg. No. 198803136N © PhillipCapital 2017. All Rights Reserved. For internal circulation only.
Disclaimer: The information contained in this document is intended only for use during the presentation and should not be disseminated or distributed to parties outside the presentation.
Phillip Securities accepts no liability whatsoever with respect to the use of this document or its contents.
18Disclaimer
The information contained in this presentation has been obtained from public sources which Phillip Securities Research Pte Ltd (“PSR”) has no
reason to believe are unreliable and any analysis, forecasts, projections, expectations and opinions (collectively the “Research”) contained in this
presentation are based on such information and are expressions of belief only. PSR has not verified this information and no representation or
warranty, express or implied, is made that such information or Research is accurate, complete or verified or should be relied upon as such. Any
such information or Research contained in this presentation is subject to change, and PSR shall not have any responsibility to maintain the
information or Research made available or to supply any corrections, updates or releases in connection therewith. In no event will PSR be liable for
any special, indirect, incidental or consequential damages which may be incurred from the use of the information or Research made available, even
if it has been advised of the possibility of such damages.
This presentation is intended for general circulation only and does not take into account the specific investment objectives, financial situation or
particular needs of any particular person.
You should seek advice from a financial adviser regarding the suitability of the investment product, taking into account your specific investment
objectives, financial situation or particular needs, before making a commitment to invest in such products.
Phillip Securities Research Pte Ltd (A member of PhillipCapital) Co. Reg. No. 198803136N © PhillipCapital 2017. All Rights Reserved. For internal circulation only.
Disclaimer: The information contained in this document is intended only for use during the presentation and should not be disseminated or distributed to parties outside the presentation.
Phillip Securities accepts no liability whatsoever with respect to the use of this document or its contents.
19Ask Questions!
Archived Webinar videos can be accessed at:
Analysts
https://www.stocksbnb.com/webinars/
Paul Chew, Head of Research
Pei Sai Teng, Macro
Jeremy Ng, Technical Analysis
Jeremy Teong, Banking & Finance
Soh Lin Sin, Consumer | Healthcare
Richard Leow, Transport | REITs (Industrial)
Dehong Tan, REITs (Commercial, Retail, Healthcare) | Property
Ho Kang Wei, US Equity
Chen Guangzhi, Oil and Gas | Energy
By Phillip Securities Research
Mohamed Amiruddin, Operations Exec
Phillip Securities Research Pte Ltd (A member of PhillipCapital) Co. Reg. No. 198803136N © PhillipCapital 2017. All Rights Reserved. For internal circulation only.
Disclaimer: The information contained in this document is intended only for use during the presentation and should not be disseminated or distributed to parties outside the presentation.
Phillip Securities accepts no liability whatsoever with respect to the use of this document or its contents.
20You can also read