Seminar: Publication policies, Chalmers
←
→
Page content transcription
If your browser does not render page correctly, please read the page content below
TRANSPORT AREA OF ADVANCE

Seminar: Publication policies,
         strategies and ranking

Stina Johansson, Jakaria Rahman, Per-Eric Thörnström

 Research Support, Bibliometrics and Ranking (RBR) division
 Department of Communication and Learning in Science (CLS)

                       September 25, 2018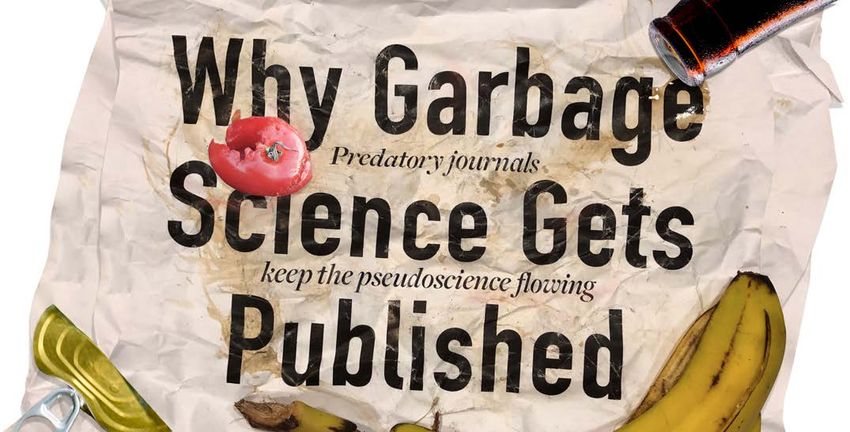
Publishing @ Chalmers

                Stina Johansson
                Bibliometric Analyst
   Dept. of Communication and Learning in Science
          Chalmers University of Technology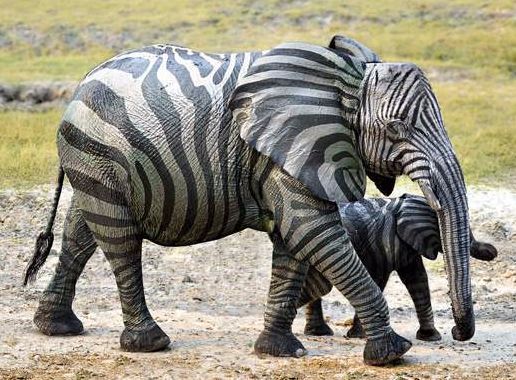
RBR – a division at CLS (Department of
    Communication and Learning in Science)
•   Research, Bibliometrics, Ranking

•   Research: research support/research.chalmers.se

•   Bibliometrics: statistical methods to analyze quality, impact, visibility
    (citations analysis) and collaboration patterns (co-authorship) through
    publications

•   (University) Ranking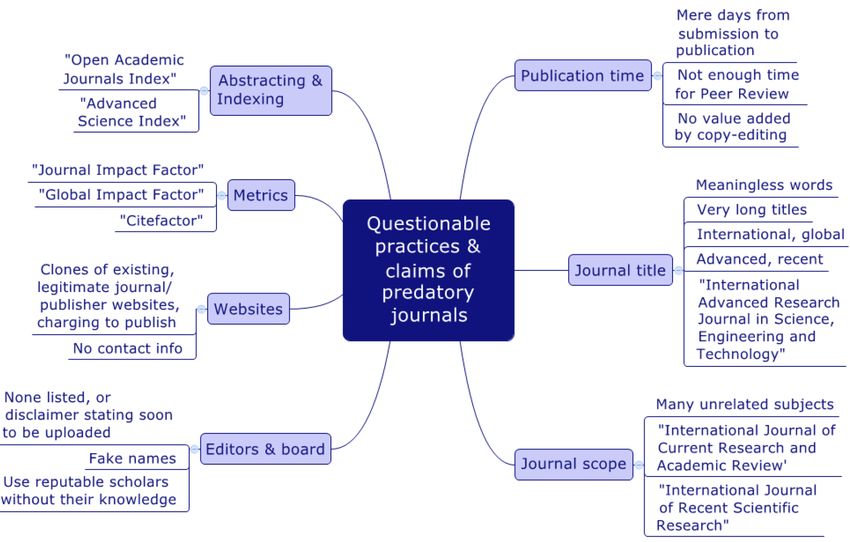
Why it is important to publish

•   Increase knowledge within your field of research

•   Describe your research, results, possibilities and consequences

•   Publishing = meriting

•   For society: to make practical’ use of your research

•   Make your data available for other to use, and test your results
Exponential growth

“The number of scientific publications published per year is over
2.5 million (Ware and Mabe, 2018) and the total global scientific
output doubles every nine years or so…” (van Noorden, 2014).

Reference
Ware, M and Mabe, M. (2018). The STM report: An overview of scientific and
scholarly publishing. International Association of Scientific, Technical and
Medical Publishers. Retrieved from https://www.stm-
assoc.org/2015_02_20_STM_Report_2015.pdf

van Noorden, R. (2014). Global scientific output doubles every nine years.
Nature news blog. Retrieved from http://blogs.nature.com/news/2014/05/global-
scientific-output-doubles-every-nine-years.html

                                                                                Price, Derek J. de Solla (1963).
                                                                                Little science, big science. New
                                                                                York: Columbia University Press
Measuring impact
Bibliometric indicators are calculated to follow up research activities,
evaluate groups and allocate research funds (national, Chalmers level)

Use of bibliometric indicators at Chalmers
   – Faculty model
   – Chalmers research evaluation
   – VP1 (Yearly follow-up of Chalmers departments, Qlikview)
   – PVU (Prioritized Operational Development)
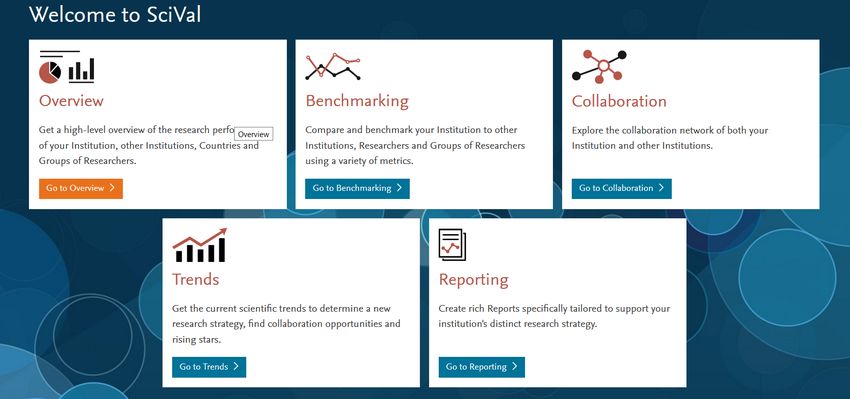
Scival (www.Scival.com)
Scopus data is the main source for Chalmers in terms of bibliometrics
PVU (Prioritized Operational Development)

•   PVU 2019-2021

•   Quality above quanitity

•   ”… Strive for publications with the highest quality and relevance and
    prioritizes to publish a larger share of articles in better seen journals
    rather than a large amount of publications”…. (Free translation from
    the PVU 2018-06-19)

•   KPI: Top 10 % (share of publications that are among the 10% most
    cited within their respective fields)
Chalmers OA policy
• Chalmers has the ambition to make all published research results freely
available to everyone, this is known as Open Access. To ensure that
Chalmers' scientific results are disseminated as widely as possible, the
President has decided to introduce an Open Access Policy, which
applies from January 1, 2010.
• This is in accordance with the Berlin Declaration on Open Access, to
which the Association of Swedish Higher Education is a signatory. It is
also in accordance with the requirements of an increasing number of
research funding bodies.
https://www.chalmers.se/en/about-chalmers/policies-and-
rules/Pages/open-access-policy.aspx 2018-09-11Research data
• To publish research data –
part of the “publishing
business”
• We need to relate to national
and international initiatives
• FAIR (findable, accessible,
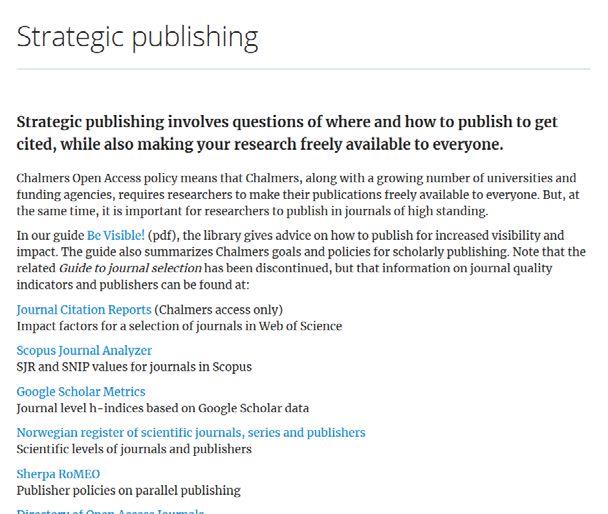
interoperable, reusable)”Strategic publishing involves questions of where
and how to publish to get cited, while also making
your research freely available to everyone”
• KI
• KTH
• LiU
• SLU
• SU
• Jönköping Uni
http://www.lib.chalmers.se/en/publishing/bibliometrics-and-ranking/strategic-publishing15
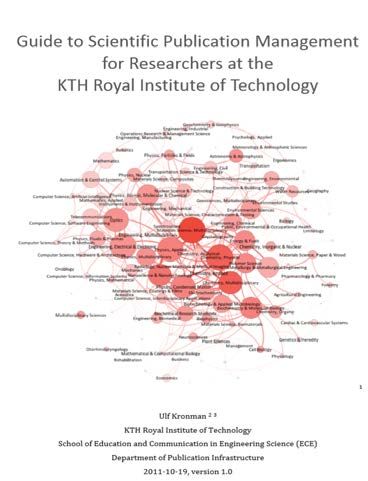
Publishing policies abroad – Universities explored
(and compared to KTH)
University Year Online link
Cardiff University 2017 https://tinyurl.com/ydb6a48n
University of Turku 2016 https://tinyurl.com/y74ytpx9
King’s College London no date https://tinyurl.com/yclf2erg
Brunel University London 2016 https://tinyurl.com/ybarxamr
Sheffield Hallam University 2017 https://tinyurl.com/ycxf4tye
Technical University of Denmark 2016 https://tinyurl.com/yden4fgm16
Similarity and dissimilarity
Point discussed Turku Sheffield King’s CL DTU Brunel Cardiff
Policy statement
Purpose
Aim
Scope
Guideline in compare to KTH
Gold Open Access
Green Open Access
Hybrid model
Copyright
CC BY license
YES NO17
Similarity and dissimilarity
Point discussed Turku Sheffield King’s CL DTU Brunel Cardiff
Internal Achieve
Thesis
ORCID
Institutional affiliation
Cost for open access
Additional policies
Principle of authorship
Policy review
Rational of the policy
Benefits of the policy
YES NOStrategic publishing – areas that
recommendations/policies typically cover
• To choose your publication channel (OA*, bibliometrics)
• Authorship: Who should be the author(s) of a publication?
• Author IDs
• How to write your affiliation
• Co-authorship (encourage international collaboration)
• CRIS systems (how and why to register)
• Research data*
*Open scienceWhy these recommendations? • To increase impact and visibility of your research • To increase impact and visibility of your university’s research • For sustainable publishing • To make publications retrievable, included in bibliometric analysis • To avoid predatory journals • Publish OA to improve visibility, impact, make you research available Open • Publish data to enable others to build on your work, test your results Science • Co-author ethically
Publishing @ Chalmers (a project at RBR)

Mission: write a clear set of recommendations to…

   – Increase impact and visibility of Chalmers research
   – Define Chalmers intentions
   – Support Chalmers departments’ and divisions’ in issues
    regarding strategic publishing, “action plans” etc.
Where are we now? • Gathering and updating existing information (Chalmers, RBR) • Studying other universities’ policies and recommendations • Workshops • Interviews (with researchers from different disciplines) • Writing
Publication strategies

               Jakaria Rahman, PhD
                 Bibliometric Analyst
    Dept. of Communication and Learning in Science
           Chalmers University of Technology
Why publication strategies? To reach the goals in the PVU (Prioritized Operational Development) and to meet the KPI’s (Key Performance Indicators) for research To improve the visibility and impact of Chalmers scholarly publications To move upwards in several international rankings To attract international collaboration To increase chances for funding opportunities
Enhance visibility and impact
1. Publish in peer-reviewed
    – journals that are indexed in Scopus or Web of Science.
    – open access journals that are indexed in Scopus or Web of Science.
    – conference proceedings that are indexed in Scopus or Web of Science.
2. Publish scholarly books, series and non-series books, edited books or volumes,
major reference works, graduate level text books with an aim to meet the Scope
and selection criteria of Scopus or Web of Science.

3. If you publish an article (as a works in progress) in a conference proceeding that
is NOT indexed in Scopus or Web of Science, please consider substantial rework
to publish as an article in a journal indexed in Scopus or Web of Science.
Factors that make research
more visible and influential
Publish in Gold or Green Open Access journals
Aim journals that have SNIP(source normalized impact per paper) > 1
SNIP corrects for differences in citation practices between scientific fields
CWTS Journal indicators http://www.journalindicators.com/indicators
Collaborate internationally
SJR Scimago Journal & Country Rank http://www.scimagojr.com/journalrank.php
Journals can be compared and analyzed, grouped by subject area (27 major thematic
areas), subject category (313 specific subject categories) or by country.Ensure publication traceability Scopus Author ID Automatically assigned to a group of documents matched to the same author Verify your author profile and publication list in Scopus (guide available at http://www.lib.chalmers.se/publicering/bibliometri-och-rankning/scival) Web of Science ResearcherID (http://www.researcherid.com/Home.action) ORCID (Open Researcher & Contributor) https://orcid.chalmers.se used in research profile maintenance manuscript submissions grant applications and patent applications
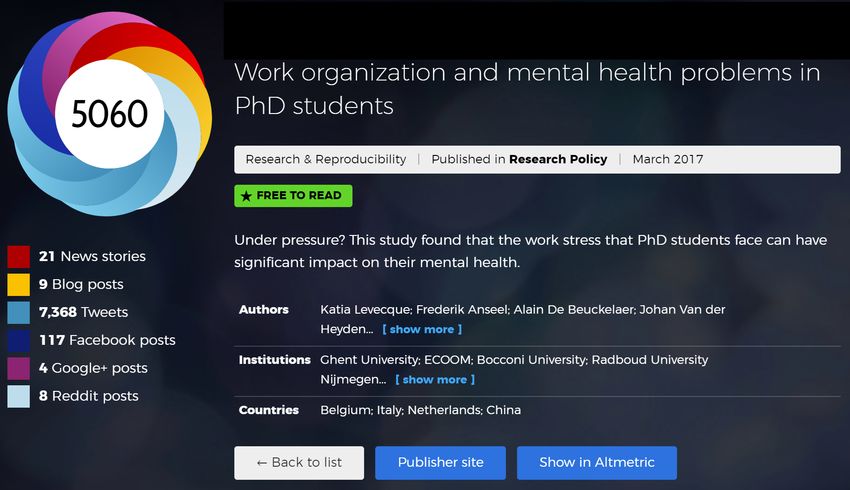
Times Cited: 14
(from Web of Science)
Increase visibility through social media
Predatory journals

                     Source: Enslin, M & Masinyana,
                     S.O. (2015). Predatory journals and
                     the impact on the scholarly
                     publishing community presentation
                     at the UNISA Research and
                     Innovation Week programmes
Who Publishes in ‘Predatory’ Journals?
Victims
Lack of author awareness
Co-conspirators
Knowingly wanting immediate
unethical resultsConsequence for researcher
Longer term reputation and career prospects sacrificed for immediate ‘‘gains’’ (!).
No academic gain, (false/no peer review, no value added)
Permanent stain on academic reputation
Even if your research is sound, it will likely be disregarded by the academic
community if published in a predatory journal
Waste of research funding – could be held accountable by funding agency
Difficult to find international collaborator or grant when predatory journals are listed in
the CV
Competitor use this mistake (!) as an opportunity and reportHow to avoid predatory journal?
Consider Open Access journals that are indexed in Scopus or Web of Science
https://thinkchecksubmit.org
Does the open access journal listed in the Directory of Open Access Journals (DOAJ)?
Does the publisher belong to the Open Access Scholarly Publishers’ Association (OASPA)?
List of Predatory Journals https://predatoryjournals.com/journals We are happy to support you
Cabell's journal blacklist http://www2.cabells.com/blacklist
bibliometrics.lib@chalmers.se
Beware of predatory journals and conferences
https://www.chalmers.se/insidan/EN/news/news/articles/beware-predatoryRanking
Per-Eric Thörnström, PhD
Specialist Support Staff
Dept. of Communication and Learning in Science
Chalmers University of TechnologyShould we really care about rankings?
I say YES, we have to!
• A good ranking position is never a disadvantage – it means status!
• Students look at rankings – especially in Asia & South America it seems
• Postdocs and assistant professors are often aware of rankings nowadays, but the
status of the subject and/or the research group is normally most important.
• Collaboration partners within academia and industry are increasingly interested…
• Funding organizations for students are interested. Does this go for funding bodies
for international research grants as well? That is what KTH anticipate...
• Chalmers use rankings to evaluate the universities from where the international
master students come. How do others evaluate Chalmers?Rankings are here to stay
There are approx. 30 international world-wide rankings – increasing!
• Universities, Fields, Subjects, Special rankings (e.g. Employability, Co-publ. with industry,
Business incubators, Innovation, Sustainability)
Who are the rankers?
• Companies active within ”Higher Education” , for example:
– THE – World University Ranking (THE-WUR)
– QS – World University Ranking (QS-WUR)
• University coupled entities, for example:
– Centre for Science and Technology Studies - CWTS (Leiden ranking)
– Shanghai Ranking – Academic Ranking of World Universities (ARWU)
• Ranking report 2016 (in Swedish) describes most lists available, incl. subject rankings:
https://chalmersuniversity.app.box.com/file/251121505882The major rankings – some differences
THE-WUR QS-WUR ARWU CWTS
Starting year 2004 (2010) 2004 (2010) 2003 2012
Ranked universities 1102 1000+ 500+300 938
Size dependent No (Yes) No (Yes) Yes (90%) No/Yes
Data reporting Yes Yes No No
Indicators (no.) 13 (5) 6 6 5+5
Bibliometric indicators 3 (38,5%) 1 (20%) 3 (60%) 100%
Data base for publications Scopus Scopus WoS WoS – part of
Surveys Surveys Nobel prize One list
Focus
18%+15% 40%+10% 20%+10% per indicator
Share, excl. Share, excl. Share of the Absolute numbers &
Calculation of score
extremes extremes very best Share of total productionChalmers Ranking Position 2012 - 2018
2012 2013 2014 2015 2016 2017 2018 National
Position
0
50
100
4th SWE
128
150
200
6th SWE
241
250
298 8th SWE
300
350
400
ARWU THE QSChalmers CWTS Position 2012 - 2018
Dependence on Fractional counting or not National
2012 2013 2014 2015 2016 2017 2018 Position
0
1 SWE
50
100
150 NB! 1 SWE
1 SWE
- Field-weighted
200
- No self-citations
250
300 8 SWE
350
400 8 SWE
450
500
550
392 in number of publications with
600 fractional counting 2018.
391 in number of publications
650
without fractional counting 2018.
700
CWTS topp 10% most cited (Fract) CWTS topp 1% most cited (Fract) CWTS Industrisamverkan
CWTS topp 10% most cited (No Fract) CWTS topp 1% most cited (No Fract)Why such different pictures?
• Crucial if indicators depend on size of the university. (Numbers or Shares)
• The composition of indicators in the ranking and their respective weight.
• Which are the most common indicators?
– Bibliometrics; publications (fractional counting or not), citations (with or without self-
citations, subject normalized or not). Per acdemics, per paper, top percentiles, FWCI, etc.
Collaboration - internat, industry, (shares) etc.
– Internationalisation; students and/or faculty, co-publications
– No. of students; levels, per faculty etc.
– Surveys to academics / employers
– Doctoral education; exams, per masters/bachelor exams, per faculty
– Income (research/teaching, from industry, per acdemics)
– Prizes (Nobel, Fields medal, other)
• The scores of the indicators say more than the ranks in general, BUT not always transparent –
changes are there!What about AoA Transport?
• Hard to rank an AoA - rankings are subject based.
• Subjects are defined by the channels for publishing (Journal, Conf. Proc. etc.)
• If a publication channel is attributed to more than one subject, every publication in that channel is
counted as one publication in each of the attributed subjects.
• Thus all subjects normally contains publications from many departments and Areas of Advance..
• Subject rankings tell little about the departmental performance, much more about
Chalmers’ joint performance in a specific subject.Transport – “performance parameters”
Indicator (SciVal) AoA Transport Chalmers Publ. Years
P (all publications) 1 021 9 791 2013-2016
Top 25% (J) 63,4% 63,4% 2013-2016
FWCI (excl self-c) 1,31 1,17 2012-2015
Top 10% most cited (field weighted) 19,8% 17,7% 2012-2015
• Only BIO, E2 and TME has higher FWCI than AoA Transport
• In top 10% most cited publications AoA Transport is no.4 (E2, BIO, CSE)
• 15,7% are non-cited publications 2012 – 2015 (Chalmers 21%)
The share of non-cited papers have decreased from 2012 to 2015 – positive trend!
Data from SciVal – Transport is a publication set with all publications marked AoA Transport in our CRIS-system:
”research.chalmers.se”, 2012 - 2017FWCI, Top 10%, SNIP Top 25%,
Int. Coll, Corp. Coll. – Is there a link?
% konf. Academic
Department FWCI Department CIT Top 10% Department SNIP Top 25% Department Int Coll. Department Papers Department Corporate Coll.
BIO 1,94 E2 24,1% SEE 77,5% F 65,6% CSE 78,8% TRPT 21,0%
E2 1,41 BIO 22,9% BIO 71,8% BIO 63,8% E2 63,1% IMS 20,4%
TME 1,33 CSE 19,9% K 70,5% SEE 62,2% IMS 47,9% M2 15,8%
TRPT 1,33 TRPT 19,8% F 67,9% MC2 59,8% M2 46,9% E2 13,0%
SEE 1,32 CLS 19,6% MV 64,1% Chalmers 51,5% TRPT 43,9% BIO 12,2%
CSE 1,29 MC2 19,1% Chalmers 62,8% MV 48,7% MC2 41,0% K 11,3%
K 1,28 SEE 18,0% MC2 62,0% K 47,3% CLS 39,1% CSE 10,8%
MC2 1,27 TRPT 61,8% CSE 47,2% Chalmers 33,8% MC2 10,3%
Chalmers 17,5%
60,4% E2 44,2% ACE 30,6% Chalmers 9,4%
F 1,19 K 16,8% ACE
Chalmers 1,16 M2 16,5% E2 60,1% M2 39,7% SEE 19,1% MV 4,8%
CLS 1,12 IMS 15,9% IMS 58,6% TRPT 36,1% F 16,7% F 4,3%
MV 1,08 TME 15,9% M2 56,8% ACE 35,9% TME 11,8% TME 3,4%
CLS 53,8% CLS 34,8% K 10,1% SEE 3,0%
IMS 1,02 F 14,5%
TME 53,8% TME 28,6% MV 8,8% ACE 2,4%
M2 0,93 ACE 12,5%
38,6% IMS 26,1% BIO 3,2% CLS 2,2%
ACE 0,91 MV 11,7% CSE
Source: Scopus, Publication Set 170502, 2012-2016,
Transport Publication Set 2012-2016 from180921AoA Transport Research Performace
No fractionalization
NB! Including self citations
1,34 excluding self citations
1
1
Mechanical Engineering (21,6% => 6,5%)
Automotive Engineering (14,9% => 4,5%)
Data: SciVal, Publ.Set TRPT 2013-2017Publications and FWCI for main subjects, TRPT
FWCI =
1,56
Data: SciVal, Publ. Set TRPT 2013-2017Subject Rankings
• QS Subjects (Scopus): (0%) 70% size dependent. Academic reputation 40%, Employers
reputation 30%, Bibliometrics 30% (H-index & citation/publication)
48 subjects
• ARWU – GRAS (WoS): 71% size dependent – Award 24%, Bibliometrics 76% (Scolarly output,
FWCI, % Int.collaboration, top 20% journals)
54 Subjects
– Transportation – 27 in the world (2017: 70)
Improvement by more publications in higher ranked journals – will hopefully lead to
improvement in citations
• NTU Subject (WoS) : 90% size dependent indicators – Bibliometrics 100% ! Top focus 30%.
14 SubjectsQS Subject Rankings 2014-2018 20-50% Bibliometric, 50-80% ”Reputation”, 100% Size indep. Subject 2014 2015 2016 2017 2018 Architecture / Built Environment 51-100 51-100 51-100 51-100 Engineering - Chemical 51-100 51-100 101-150 101-150 101-150 Engineering - Civil & Structural 101-150 51-100 51-100 51-100 101-150 Computer Science & Info Systems 101-150 151-200 101-150 151-200 101-150 Engineering - Electrical 51-100 51-100 51-100 51-100 51-100 Engineering - Mechanical 51-100 51-100 101-150 101-150 51-100 Biological Sciences >400 301-350 351-400 351-400 Chemistry 101-150 101-150 101-150 101-150 151-200 Environmental Sciences 51-100 101-150 101-150 101-150 101-150 Materials Science 101-150 51-100 101-150 51-100 51-100 Mathematics 151-200 151-200 151-200 101-150 101-150 Physics & Astronomy 101-150 101-150 151-200 101-150 101-150 Statistics & Operational Research 101-150 151-200 151-200 151-200 101-150
Global Ranking of Academic Subjects:
    No. of publications rank minus FWCI rank

Sorce: Global Ranking of Academic Subjects (GRAS) 2017, WoS 2011-2016, articles only!
Publishing is that a problem for
Chalmers?
FWCI, all publications, Scopus, 2012-2015, excl. self-citations
Chalmers
Sweden
SLU
UmU
LU
GU
KI
0 0,2 0,4 0,6 0,8 1 1,2 1,4 1,6 1,8 2
• In addition, 25% of all publications from Chalmers (same period) are not
cited at all. Sweden’s average: 23%. 10th place in Sweden.
• However, FWCI (=MNCS) (Same period, WoS, CWTS – excluding self-
citations) for Chalmers is 1,10. An increase from 1,01 for 2010-2013.What to do, to improve in
rankings?
Very much in line with Chalmers vision and strategy - Quality is in focus!
• Recruit the right people and give them time for research, teaching and utilization.
• Improve bibliometry – ”publication policy” and strategies!
• Improve internationalisation – collaborate deeply with the best.
• Make Chalmers more visible – internationally.
The academic reputation of Chalmers must be increased.
Everyone of us is an ambassador for Chalmers!
Strive for our goals: world-class teaching, excellent research and efficient utilizationThank you!
If you have any questions, do not hesitate to
contact us.
All questions regarding bibliometrics: bibliometrics.lib@chalmers.se
Stina Johansson: stina.johansson@chalmers.se
Jakaria Rahman: jakaria.rahman@chalmers.se
Per-Eric Thörnström: peth@chalmers.seYou can also read


