Overview of America's Freight Railroads - Association of American ...
←
→
Page content transcription
If your browser does not render page correctly, please read the page content below
Overview of America’s Freight Railroads
Association of American Railroads January 2019
Summary
From one end of the country to the other, America is connected by the best freight rail
system in the world. The seven large “Class I” railroads, working with hundreds of smaller
railroads and tens of thousands of rail customers, deliver economic growth, support job
creation, and provide crucial environmental benefits such as reduced highway gridlock and
cleaner air. America’s freight railroads are almost entirely privately owned and operated:
unlike trucks and barges, freight railroads operate overwhelmingly on infrastructure that
they own, build, maintain, and pay for themselves. In recent years, railroads have been
spending more than ever before on enhancing their nearly 140,000-mile network. Railroads are
getting ready today to meet the freight transportation challenges of tomorrow.
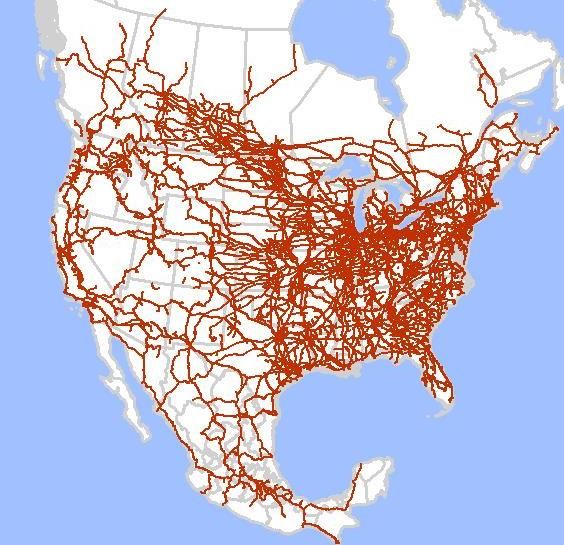
Delivering the Goods Across the Country and to the World
More than 600 freight railroads operate in the United States. The seven “Class I”
railroads — railroads with 2017 revenue of at least $464 million — account for around 68
percent of freight rail mileage, 88 percent of employees, and 94 percent of revenue. Each Class I
railroad operates in multiple states over thousands of miles of track.
Non-Class I railroads (also known as short line and
regional railroads) range in size from tiny operations
handling a few carloads a month to multi-state operations
close to Class I size. Collectively, they earn several billion
dollars in revenue each year.
Together, U.S. freight railroads form an integrated,
nearly 140,000-mile system that earned close to $74 billion
in revenue in 2017 and that provides the world’s safest,
most productive, and lowest-cost freight rail service.
From the food on our tables to the cars we drive to
the shoes on our children’s feet, freight railroads carry the
things America depends on:
• Historically, coal has generated more electricity than any other fuel, and railroads deliver
around 70 percent of coal delivered to power plants. Railroads also carry enormous
amounts of corn, wheat, soybeans, and other grains; fertilizers, plastic resins, and a vast
array of other chemicals; cement, sand, and crushed stone to build our highways;
lumber and drywall to build our homes; autos and auto parts; animal feed, canned
goods, corn syrup, flour, frozen chickens, beer, and countless other food products; steel
and other metal products; crude oil, liquefied gases, and other petroleum products;
paper products; iron ore and scrap metal for steelmaking; and much more.
Overview of America’s Freight Railroads Page 1 of 5• Rail intermodal is the movement of shipping containers and truck trailers by rail. It’s
been the fastest growing major rail traffic segment over the past 25 years and set a new
annual volume record in 2018. Just about everything you find on a retailer’s shelves may
have traveled on an intermodal train. Around half of rail intermodal consists of imports
or exports, reflecting the vital role intermodal plays in international trade.
Carrying the Things America Depends On
Intermodal:
13.7 million trailers and Food products: Lumber, paper & other
containers 1.6 million carloads forest products: Grain and
1.2 million carloads other farm
\\aarfs2\Communications\CONTENT products:
INVENTORY\Photos & B- https://pixabay.com
roll\Intermodal\Intermodal-Either-Side
/en/retail-grocery-
\\aarfs2\Communications\CONTEN 1.6 million
T INVENTORY\Photos & B-
supermarket-store- roll\Commodities\Centerbeams- carloads
Commodities
1424043/
\\aarfs2\Communicatio Sand, stone & gravel:
ns\CONTENT \\aarfs2\Communicati
INVENTORY\Photos 1.5 million carloads ons\CONTENT
& B-
roll\Commodities\Plast
INVENTORY\Photos & \\aarfs2\Communications\CO Coal: And
B-
ic-Pellets-
Commodities
roll\Commodities\Add
NTENT INVENTORY\Photos &
B-roll\Commodities\Train- 4.5 million much
https://pixabay.com/en/o Coal-V3
more!
pen-pit-mining-sand-raw-
carloads
materials-2464761/
Plastics, fertilizers and Motor vehicles
other chemicals: and parts:
2.3 million carloads 1.8 million carloads Figures are for 2017.
The Right Track for the Economy
America’s freight railroads connect producers and consumers across the country and
the world, expanding existing markets and opening new ones.
The approximately 167,000 freight railroad employees are among America’s most highly
compensated workers. In 2017, the average U.S. Class
I freight railroad employee earned wages of $87,100 and Annual Compensation:
fringe benefits of $38,300, for total average compen- U.S. Average vs. U.S. Freight Railroads
sation of $125,400. By contrast, the average wage per $140,000
full-time equivalent U.S. employee in domestic $120,000
industries in 2017 was $62,100 (just 71 percent of the Benefits
$100,000
comparable rail figure) and average total compensation
was $76,500 (just 61 percent of the rail figure). $80,000
Benefits
An October 2018 study from Towson $60,000
Wages
University’s Regional Economic Studies Institute found $40,000
Wages
that, in 2017 alone, the operations and capital $20,000
investment of America’s major freight railroads
supported approximately 1.1 million jobs (nearly $0
U.S. Average* Freight RRs**
eight jobs for every railroad job), $219 billion in *Average full-time employee equivalent in domestic industries.
economic output, and $71 billion in wages. **Average Class I freight railroads. Data are 2017. Source: BEA, AAR
Railroads also generated nearly $26 billion in tax
revenues. In addition, millions of Americans work in industries that are more competitive in the
tough global economy thanks to the affordability and productivity of America’s freight railroads.
Overview of America’s Freight Railroads Page 2 of 5Without railroads, American firms and
consumers would be unable to participate in the International Trade
as a Share of Rail Traffic in 2014
global economy anywhere near as fully as they do
today. In 2014, international trade accounted for an Rail Trade Trade %
estimated 35 percent of U.S. rail revenue, 27 percent of Total Share of Total
U.S. rail tonnage, and 42 percent of the carloads and Revenue ($ bil) $75.1 $26.4 35.2%
intermodal units U.S. railroads carried. Tons (millions) 1,879.4 511.0 27.2%
Units (millions)* 32.2 13.4 41.6%
Affordable and Efficient *carloads and intermodal containers and trailers
Source: AAR analysis of government and other data
The affordability of freight rail saves rail
customers (and, ultimately, American consumers)
billions of dollars each year and enhances the global competitiveness of U.S. products. Average
rail rates (measured by inflation-adjusted revenue per ton-mile) were 46 percent lower in 2017
than in 1981. This means the average rail shipper can move close to twice as much freight for
about the same price it paid more than 35 years ago.
Several years ago, the American Association of State Highway and Transportation
Officials (AASHTO) estimated that if all freight rail traffic were shifted to trucks, rail customers
would have to pay an additional $69 billion per year. Adjusted for increased freight volume and
inflation, it’s probably close to $100 billion today.
Saving Americans Money Railroad Rates* vs. Average
7.5¢ Prices of Common Consumer Goods
7.0¢ (% change 1981-2017, not adjusted for inflation)
6.5¢ 177%
Average inflation-adjusted
revenue per ton-mile (2017 $)
6.0¢ 154%
U.S. freight rail rates were
5.5¢ 46 percent lower in 2017
than they were in 1981.*
5.0¢ 101%
93%
4.5¢
75%
4.0¢ 63%
55%
3.5¢
27%
3.0¢
2.5¢ RR Gasoline Chicken Potato chips
2.0¢ Rates*
'81 '84 '87 '90 '93 '96 '99 '02 '05 '08 '11 '14 '17 Bananas Bread Eggs Postage
*Revenue per ton-mile, average all commodities. Source: AAR *Avg. revenue per ton-mile, all commodities. Source: BLS, AAR
Investing for the Future
As America’s economy grows, the need to move more freight will grow too. The Federal
Highway Administration recently forecast that total U.S. freight shipments will rise from an
estimated 17.7 billion tons in 2016 to 24.2 billion tons in 2040 — a 37 percent increase.
Railroads are getting ready today to meet this challenge:
• America’s freight railroads operate overwhelmingly on infrastructure that they own,
build, maintain, and pay for themselves. By contrast, trucks, airlines, and barges
operate on highways, airways, and waterways that are publicly funded.
Overview of America’s Freight Railroads Page 3 of 5• From 1980 to 2018, America’s freight railroads spent more than $685 billion — their own
funds, not taxpayer funds — on capital expenditures and maintenance expenses related to
locomotives, freight cars, tracks, bridges, tunnels and other infrastructure and equipment.
That’s more than 40 cents out of each revenue dollar. America’s freight railroads have
been spending more in recent years than ever before on a network that keeps our
economy moving.
• Over the past decade, the average U.S. manufacturer has spent about 3 percent of
revenue on capital expenditures. The comparable figure for U.S. freight railroads is close
to 19 percent, or about six times higher.
Capital Spending as % of Revenue*
Record Railroad Spending
on Infrastructure & Equipment* Average all manufacturing 2.9%
($ billions)
$30.3 Food 2.2%
Petroleum & coal products 2.4%
$28.0
Machinery 2.6%
$25.5 $25.1 $25.9 Fabricated metal products 3.1%
$24.8
$23.3 Primary metal products 3.1%
$21.5 Wood producs 3.1%
$20.7 Motor vehicles & parts 3.2%
$20.2
Chemicals 3.4%
Plastics & rubber products 3.6%
Paper 4.0%
Nonmetallic minerals 4.8%
Computer & electr. products 5.1%
'08 '09 '10 '11 '12 '13 '14 '15 '16 '17 Class I Railroads 19.1%
*Capital spending + maintenance expenses.
Data are for Class I railroads. Source: AAR *Avg. 2007-2016
Source: Census Bureau, AAR
Always Looking to Improve Safety
Nothing is more important to railroads than safety, and railroads know that the safety
challenge never ends. That’s why railroads, in cooperation with policymakers, their employees,
suppliers, and customers, are constantly looking for new technologies, operational enhancements,
improved training, and other ways to further improve their already excellent safety record.
• The train accident rate in 2017 was down 40 percent from 2000; the employee injury rate
in 2017 was down 43 percent from 2000; and the grade crossing collision rate in 2017 was
down 38 percent from 2000. By all these measures, recent years have been the
safest in history.
• Railroads today have lower employee injury rates than most other major
industries, including trucking, airlines, agriculture, mining, manufacturing, and
construction — even lower than food stores.
Virtually every aspect of rail operations is subject to safety oversight by the
Federal Railroad Administration (FRA). For example, stringent FRA regulations cover track
and equipment inspections, employee certification, operating speeds, and signals. FRA safety
inspectors (and in some states, state inspectors) evaluate rail facilities and operations. Railroads
are also subject to oversight by the Occupational Safety and Health Administration, the Pipeline
and Hazardous Materials Safety Administration, and the Department of Homeland Security.
Overview of America’s Freight Railroads Page 4 of 5Rail Accident & Injury Rates Have Plunged RRs Are Safer Than Most Other Industries
12 (injuries per 200,000 employee-hours)
11 5.5
10 RR Employee Injuries* 5.0 Air
1980-2017: 82% Food & bev. Transp.
9 4.5
1990-2017: 74% stores Trucking
8
2000-2017: 43% 4.0
7 Inland
3.5 water Manuf.
6 All Agric.
3.0 freight private
5 transp. industry
2.5
4 Constr.
3 Train Accidents** 2.0
RRs Mining
2 1980-2017: 78% 1.5
1990-2017: 48%
1 2000-2017: 40% 1.0
0 0.5
'80 '85 '89 '93 '97 '01 '05 '09 '13 '17
0.0
*Per 100 employee equivalents. **Per million train-miles.
2017 is preliminary Source: FRA Data are for 2017. Source: Bureau of Labor Statistics
Railroads are constantly incorporating new technologies to improve safety. Just a few
examples: sophisticated detectors along tracks that identify defects on passing rail cars;
ground-penetrating radar that identifies problems below ground, such as excessive moisture,
that could destabilize track; and specialized rail cars that use sophisticated instruments to
identify defects in tracks.
Essential to a Greener, Less-Congested Future
Railroads are the most environmentally sound way to move freight over land. In 2017,
U.S. railroads moved a ton of freight an average of 479 miles per gallon of fuel. On average,
railroads are four times more fuel efficient than trucks. Because greenhouse gas emissions are
directly related to fuel consumption, moving freight by rail instead of truck reduces greenhouse
gas emissions by an average of 75 percent. Because a single train can replace several
hundred trucks, railroads help reduce highway gridlock and the need to spend scarce taxpayer
dollars on highways.
A Need for Reasonable Regulation
Largely because of decades of excessive regulation, by the 1970s U.S. freight railroads
were on the brink of ruin. Railroad bankruptcies were common, and tracks and equipment
were falling apart because railroads couldn’t afford the cost of maintenance. The economy
suffered greatly because railroads could not provide the quality service their customers needed.
Recognizing the need for reform, in 1980 Congress passed the Staggers Rail Act. The
Staggers Act put in place a more reasonable regulatory system under which railroads could
largely decide for themselves — rather than have Washington decide for them — what routes to
use, what services to offer, and what prices to charge. Railroads today don’t have unlimited
freedom to charge whatever they want, though. If a railroad faces no effective competition for
its services, the Surface Transportation Board can limit what the railroad can charge.
Unfortunately, some shortsighted groups are calling for a return to the days of
unbalanced and unreasonable rail regulation. Policymakers should reject these calls. America
needs a common-sense regulatory system that provides effective oversight but gives railroads the
opportunity to earn enough to provide the rail system our economy needs to grow. Rail
investment should be encouraged, and regulations and legislation should not harm railroads’
ability or willingness to make those investments.
Overview of America’s Freight Railroads Page 5 of 5You can also read