SP 7 - Hybrid solutions - Panel session: Hybrid solutions - The key technology to reduce emissions? - CleanER-D
←
→
Page content transcription
If your browser does not render page correctly, please read the page content below
SP 7 – Hybrid solutions

    Panel session:
    Hybrid solutions – The key
    technology to reduce emissions?
    Dr. Michael Meinert / Siemens AG
    Pierre Prenleloup / Saft

    CleanER-D Final Conference -
    Delivering Clean Diesel Rail Solutions

    Wednesday, 20th November 2013 - Brussels

                                             Grant Agreement number: 234338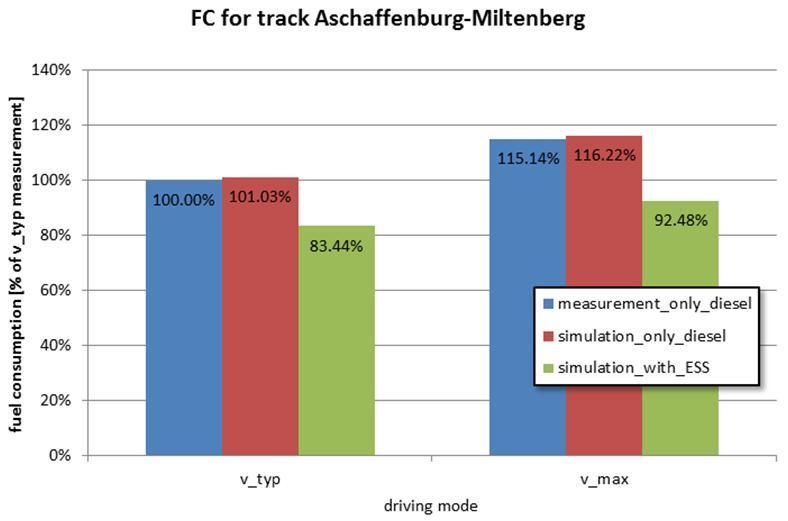
Agenda
Overview and partners
Objectives of SP and WP
Hybrid solutions for diesel-driven rail vehicles
Energy Storage Technologies
Key messages for hybrid solutions
Future scenarios and recommendations
2 20/11/2013
SP7 structure
                                     SP0
                                     Management

                                                   SP7- Hybrid Solutions
               WP 7.1
               State-of-the-art
               Hybrid Technologies             WP 7.2
               for Railway                     Duty Cycles for Diesel
               Applications                    Powered Rail Vehicles
                                                                           SP5
                                                                           Sustainability
SP1                                            WP 7.3
System                                         Influences on Fuel
Requirements                                   Consumption and
                                               Emissions due to Duty
                                                                           SP6
                   WP 7.4                      Cycles and Drive System
                                                                           Emerging
                   Innovative Energy           Architectures
                                                                           Technologies
                   Storage System
                   Technologies

                 WP7.5
                 Benefit of Hybrid Solutions

                                               3                                 20/11/2013
SP7 partners
SP0
UNIFE
SP7- Hybrid
WP 7.1 Solutions
University of
WP 7.2Siemens
Newcastle
UIC
SP5
UIC
SP1 WP 7.3
Bombardier Siemens
SP6
WP 7.4 University of
Saft Newcastle
WP7.5
Siemens
4 20/11/2013SP General Objectives
Hybrid solutions are one possibility to
achieve environmental-friendly system
architectures
Energy storage units/systems (ESS)
became a common used technology in
LRV and bus applications
European-funded projects (e.g. Modurban,
Railenergy) elaborated some useful
results worth to be considered
5 20/11/2013WP7.1 State of the art
Note: Braking resistor linked to the
high potential for energy storage intermediate DC-link is not displayed
systems (ESS) in diesel-driven
rolling stock
multiple frequent stops for
suburban and regional duty cycles
other transport modes are also
investing in hybrid solutions
hybridisation using battery
systems are advanced in the
automotive sector Note: Braking resistor linked to the
intermediate DC-link is not displayed
• Battery technology,
• Double layer capacitors (DLC) or
• Combination of both seem to be
the preferred solution
6 20/11/2013WP7.2 Duty cycles
duty cycles for typical rail applications were defined
considering the Railenergy-results
simulation parameters were defined for synthetic diesel
hybrid rail vehicles
● in order to prove the assumptions for duty cycles for comparison
● to allow comparison of different system architectures and energy
storage technologies
fuel and emission mapping charts from existing UIC II and
IIIA compliant engines were used
• Confirmed is that the TS 50591 (former TecRec 100 from
Railenergy) is usable and can be extended
• Shunter duty cycle was newly defined, based on real
measurements from service
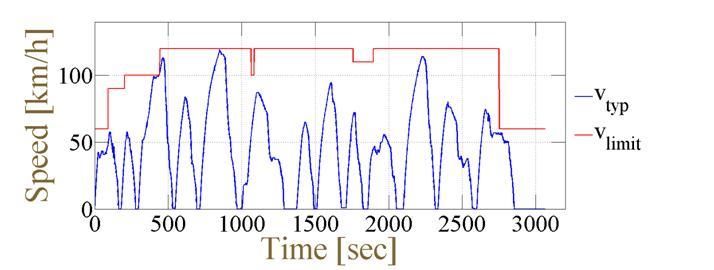
7 20/11/2013WP7.2 Duty cycles
High hybridization potential
Example: defined duty cycle for regional train with new
alternative gradient
Speed limit
160
140
120
100
km/h
80
60
40
20 alt. gradient
0
0 10.000 20.000 30.000 40.000
160 50.000 60.000 70.000 80.000
m
140
120
100
m
80
60
40
20
0
0 10.000 20.000 30.000 40.000 50.000 60.000 70.000 80.000
m
8 20/11/2013WP 7.3 System architectures
Diesel-hydromechanic multiple unit
(e.g. suburban) with hydrostatic
accumulators as ESS & all auxiliaries
at internal combustion engine
electr.
aux.
mech. G
aux. hydromechanic
hydro. DM
DE transmission
aux.
hydrostatic
accu.
ESS
car 2
Diesel-electric shunter with
Double-layer Capacitors as ESS
and auxiliary battery
9 20/11/2013WP7.4 Energy storage
SP7 ESS final perimeter
Traction ESS : included Auxiliary ESS : included Starting ESS : excluded
auxiliary ESS has an average mass of 422 kg & capacity of 12 kWh
energy balance for the ESS has to be ensured for the complete duty
cycle (round-trip including 20 min stop time at returning point)
estimation for ESS-efficiency is 80 %
• Not only traction ESS are in focus because ESS for starter &
auxiliaries are needed
• “Pure battery” solution: NiMH-technology does not fully comply
and therefore will not be considered
10 20/11/2013Variety for combinations
Supplier Manufacturer/OEM Operator
flywheel DLC BAT DH DH regional suburban
DE
shunter
Hardware
D M
Energy Storage Technology System Architecture Duty Cycle
intercity
hydrostatic freight highspeed
Intelligence
voltage driving style
Energy Management
temperature dwell time
lifetime signalling
driving
SoC current start-stop strategy speed stops
• Number of ESS: 4 n = 126 !!!
• Nmber of system architectures: 3 52 are n = 364 !!!
• Number of duty cycles: 6 meaningful 12 most
promising
• Number of energy management
11
strategies: 7 20/11/2013ESS-technology – DLC & battery
Pros & cons for both electric ESS
1h 30 min 10 min
1000
Specific Energy Density (Wh/kg)
EV
LiIon (High Energy) 1 min
LiIon (High Power)
100
30 s
NiMH
10 s
hybrid
bus
10
DLC
1s
1
10 100 1000 10000
Specific Power Density (W/kg)
Hybrid-ESS combines benefits
12 of battery and DLC
20/11/2013WP 7.4 Energy storage
Battery example on duty cycle
2000 100
“Regional 360 kW 1800
Wheel ICE ESS SOC
80
DE with altitude”:
SOC (%)
1600 60
6 branches in 1400 40
parallel 1200 20
Start – Stop 1000 0
strategy for 800 -20
60 kW 600 -40
auxiliaries 400 -60
dwell time is
Power (kW)
200 -80
1 min and 0 -100
up to 20 min -200 -120
-400 -140
-600 -160
-800 -180
-1000 -200
0 1500 3000 4500 6000 7500 9000 10500
time (s)
• ESS has to be balanced over the complete duty cycle
• Operator‘s duty cycle are a predominant boundary condition
• Some strategies are only possible
13 by ESS (e.g. Start – Stop)
20/11/2013fuel consumption in l
0
25
50
75
100
125
150
175
200
225
STD 250
Bat
DLC
FW
DHM
Hyd
Bat/DLC V1
Bat/DLC V2
Bat/DLC V3
STD
Bat
DLC
FW
DHD
Hyd
14
Bat/DLC V1
Bat/DLC V2
Bat/DLC V3
STD
Bat
DLC
FW
DE
Hyd
Bat/DLC V1
Bat/DLC V2
Bat/DLC V3
20/11/2013
Fuel consumption will be reduced by ESS
Regional 360 kWRegional 360 kW, Hybrid-ESS
Emmisions will be reduced as well
3,5 0,18
0,16
3,0
0,14
2,5
0,12
PM in kg
NOx in kg
2,0
0,10
1,5 0,08
0,06
1,0
0,04
0,5
0,02
0,0 0,00
DHM DHD DE V1 DE V2 DE V3
DHM DHD DE V1 DE V2 DE V3
without ESS with ESS without ESS with ESS
reduction of both together can be contradictory 20/11/2013
15LCC-reduction due to hybridization
within 20 years is obvious
13.940
150 %
13.011
140 %
12.081
130 %
11.152
120 %
10.223
110 %
9.293
100 %
8.364
90 %
7.435
80 %
6.505
70 %
5.576
60 %
4.647
50 %
3.717
40 %
2.788
30 %
1.859
20 %
929
10 %
00 %
DMU DMU DMU DMU DMU DMU DMU DMU DMU DMU DMU DMU DMU DMU DMU
560kW 560kW 560kW 560kW 560kW 560kW 560kW 560kW 560kW 560kW 560kW 560kW 560kW 560kW 560kW
DE, low DE, med. DE, high DE BAT, DE BAT, DE BAT, DE DLC, DE DLC, DE DLC, DE FW, DE FW, DE FW, DE DE DE
low med. high low med. high low med. high Bat/DLC Bat/DLC Bat/DLC
V1, low V1, med. V1, high
LC Fuel Cost LC Lubricating Oil Cost LC Coolant Cost
LC engine & ESS maintenance cost First cost ESS system Replacement cost ESS module at EoL
• For each system architecture an ESS can be found in order to
reach customer’s ROI
• Example here: Hybrid-ESS can
16 give the most benefits 20/11/2013Anual LCC-reduction is reached by
every ESS even if invest is considered
DMU DMU DMU
DMU DMU DMU DMU DMU DMU DMU DMU DMU 560kW DE 560kW DE 560kW DE
560kW DE 560kW DE 560kW DE 560kW DE 560kW DE 560kW DE 560kW DE 560kW DE 560kW DE Bat/DLC Bat/DLC Bat/DLC
BAT, low BAT, med. BAT, high DLC, low DLC, med. DLC, high FW, low FW, med. FW, high V1, low V1, med. V1, high
10 %
46195
5%
23098
0%
0
-5%
-23098
- 10 %
-46195
- 15 %
-69293
- 20 %
-92390
- 25 %
-115488
- 30 %
-138585
- 35 %
-161683
- 40 %
-184780
LC Fuel Cost LC Lubrictaing Oil Cost LC Coolant Cost
LC engine maintenance Cost First cost ESS system Replacement cost ESS module at EoL
High savings are not linked to17fast ROI 20/11/2013Results regarding standardization
Former TecRec 100_001 was derived from Railenergy
and became already a TS 50591
● The alternative gradient of the regional cycle can be added
● The shunter cycle can be added
New standardization work is launched
● IEC TC 9 PT 62864-1 (as ESS-integration standard started 2013)
Railway applications – Rolling stock – Power supply with onboard
energy storage system,
Part 1: Series hybrid system
● AHG 10 (as ESS-component standard will start June 2013)
Lithium-Ion Traction Batteries for Railway Applications
• Continuous investigation will improve the definition
of duty cycles for the evolution of TS 50591
• Already launched standardization work will benefit
18 20/11/2013Standardization structure for electric
ESS-technology
Overview on the technical framework
PT 62864-1 defines the basis for other depending standards
PT 62864-1
Railway applications – Rolling stock –
Power supply with onboard energy storage system
Part 1: Series hybrid system
-> Level 1: Architectures
IEC 61287-1 IEC 61377(series) IEC 61133
Railway applications - Power convertors Railway applications - Rolling stock -
installed on board rolling stock Railway applications - Rolling Testing of rolling stock on completion
Part 1: Characteristics and test methods stock - Combined testing of construction and before entry into
service
-> Level 2: Systems, Interfaces
IEC 60349(series) IEC 61881-3
prIEC xxx
Electric traction - Rotating Railway applications - Rolling stock finalized
Railway applications - Rolling stock equipment equipment – Capacitors for power electronics
electrical machines for rail in 2012
– Lithium-Ion Traction Batteries
and road vehicles Part 3: Electric double-layer capacitors
-> Level 3: Components
• ESS-standardization is nowadays structured
• Completion will last 5 years at least
• Results from EC-funded projects feed the standardization work
19 20/11/2013Key messages
Potential of hybridization is given
● Easy reduction of fuel consumption & CO2 up to 20 %
vs. eco-driving
● Energy management strategies can allow higher
savings up to 25 %
● Reduction of NOx and/or PM but:
reduction of both together is contradictory in some
cases
● Reduction of both emissions can be solved by energy
management strategies
Hybridization of diesel-driven Rolling Stock is promising
20 20/11/2013Key messages
Energy management strategies can improve the benefits
electrification of auxiliaries is necessary
if Start-Stop strategy and emission-free tunnel
operation are used
downsizing and replacement respectively of ICE is
possible (e.g. use 1 instead of 3)
example: shunter (ICE power: 1000 kW 560 kW,
battery: 235 kWh ):
PM-emissions can be reduced up to 73 %
NOx can be decreased up to 57 %
fuel consumption is lowered by 34 %
optimization of ESS with energy management and
operation strategies can be
21 done right now 20/11/2013Key messages
If the overall vehicle is taken into consideration:
The reduction of PM-emissions by hybridization
(overall system view) is not as high as the legislative
requests by 90 % for the step from IIIa to IIIb (only
engine view)
replacement of aftertreatment systems for stage IIIb
due to use of ESS is unlikely (PM-emissions needs to
be decreased by 90 % vs. stage IIIa)
There are improvements necessary to consider the
overall system including the engine and the reduction
of emissions by ESS (legislative, tax, market benefits)
22 20/11/2013Key messages
LCC were elaborated comprising the ESS‘s and engine‘s
invest cost for 1st time
Validation of the simulation tool was done successfully by
real measurements
Tool is COOL
Every application or use case can be assessed
and shall be investigated for
23 hybridization‘s benefits
20/11/2013
23Future scenarios/recommendations
1st time investigations for hybridization of diesel-driven
Rolling Stock with energy management strategies were
done in European-funded consortium
But use and field experiences are still at the beginning
(e.g. Plathee-prototype by SNCF, 5 shunter with NiCd
ordered by MEG)
• Demonstration in revenue operation is necessary to
prove optimization / energy management strategies
• Funding for improvement / application / approval of
ESS-technologies
• New train generation needs an optimization of the
overall system architecture with energy management
and customer’s operational strategies
• Apply new functionalities by
24 ESS, e.g. Start-Stop
24
20/11/2013Many thanks
to all members and supporters
for the done work
and fruitful discussions
20/11/2013SP5 Sustainability & Integration
What are the costs and benefits of rail diesel emission
reduction?
Henning Schwarz, UIC (DB), Dr. Ahmed Al-Sened (TEC)
Dr. Roland Nolte (IZT), Christian Kamburow (IZT)
CleanER-D Final Conference
Brussels, 20th November 2013
Grant Agreement number: 234338Presentation Outline
Introduction
Sustainability Study
Cost Analysis
Sustainability Impact Assessment
Conclusions
27 10/01/2014General objectives
Develop reliable rail diesel vehicle fleet and emissions scenarios
(Sustainability Study)
Integrate the results from System Requirements (SP1), Emerging
Technologies (SP6) and Hybrid Solutions (SP7)
● perform impact assessment from a railway sector perspective using
cost/ benefit methods
● Cost/ benefit Analysis and Sustainability Impact Assessment
Develop recommendations on future emission reduction approaches
and strategies of rail diesel traction in Europe
● Recommendation regarding future emission reduction approaches
and strategies
28 10/01/2014Total emissions from transport (NOx)
Rail’s diesel traction share of total NOx emissions of transport is 2.5%
Emissions from transport - NOx (kt) - EU27 & EFTA (source: eea)
5000
4500
4000
3500
3000
2500
kt
2000
1500
1000
500
0
1990 1991 1992 1993 1994 1995 1996 1997 1998 1999 2000 2001 2002 2003 2004 2005 2006 2007 2008
International aviation Road transport: Passenger cars Road transport: Light duty vehicles
Road transport: Heavy duty vehicles Railways National navigation (Shipping)
Civil aviation (Domestic) International inland waterways
30 10/01/2014
Source: eea - European Union emission inventory report 1990-2008
under the UNECE Convention on Long-range Transboundary Air Pollution (LRTAP)Total emissions from transport (NOx)
Rail’s diesel traction NOx emissions decreased by 35%
Emissions NOx - Index (1990=100) - EU27 only (source: eea)
180
170
160
150
140
130
120
110
100
90
80
70
65
60
50
40
30
20
10
0
1990 1991 1992 1993 1994 1995 1996 1997 1998 1999 2000 2001 2002 2003 2004 2005 2006 2007 2008
Civil aviation (Domestic, LTO) International aviation (LTO) Road transport: Passenger cars
Road transport: Light duty vehicles Road transport: Heavy duty vehicles Railways
International inland waterways National navigation (Shipping)
31 10/01/2014
Source: eea - European Union emission inventory report 1990-2008
under the UNECE Convention on Long-range Transboundary Air Pollution (LRTAP)Total emissions from transport (PM)
Same picture for PM: Rail’s diesel traction share is 4.5% only and
decreased by 35%
Emissions from transport - PM (kt) - EU27 & EFTA (source: eea) Emissions PM - Index (1990=100) - EU27 only (source: eea)
140 230
220
210
120 200
190
180
170
100 160
150
140
80 130
120
kt
110
60 100
90
80
70 64,5
40
60
50
40
20 30
20
10
0 0
1990 1991 1992 1993 1994 1995 1996 1997 1998 1999 2000 2001 2002 2003 2004 2005 2006 2007 2008 1990 1991 1992 1993 1994 1995 1996 1997 1998 1999 2000 2001 2002 2003 2004 2005 2006 2007 2008
Road transport: Passenger cars Road transport: Light duty vehicles Road transport: Heavy duty vehicles Civil aviation (Domestic, LTO) International aviation (LTO) Road transport: Passenger cars
Railways National navigation (Shipping) Civil aviation (Domestic) Road transport: Light duty vehicles Road transport: Heavy duty vehicles Railways
International aviation International inland waterways International inland waterways National navigation (Shipping)
32 10/01/2014
Source: eea - European Union emission inventory report 1990-2008
under the UNECE Convention on Long-range Transboundary Air Pollution (LRTAP)Environmental Rail Sector Strategy
The railway sector in Europe is committed to further
improve its emission performance
European Railways have adopted in December 2010 the
“European Rail Sector Strategy 2030 and beyond”
● Exhaust emission reduction target
• By 2030 the European railways will reduce their total exhaust
emissions of NOx and PM10 by 40% in absolute terms even with
projected traffic growth compared to base year 2005
● CO2 reduction target
• By 2030 the European railways will reduce their specific average
CO2 emissions from train operation by 50% compared to base year
1990
Cleaner-D supports the sector to achieve its goals!
33 10/01/2014Presentation Outline
Introduction
Sustainability Study
Cost Analysis
Sustainability Impact Assessment
Conclusions
34 10/01/2014Sustainability Study – Content
European rail diesel fleet – fleet composition and
development
● Current status of diesel fleet – UIC and non-UIC railways
(Sources: UIC official statistics, UIC & Cleaner-D SP5 surveys,
Rail market studies (UNIFE, SCI Verkehr); 2010)
● CleanER-D SP5 fleet development scenarios until 2020
Total exhaust emissions from European rail diesel traction
until 2020
35 10/01/2014Future development of European rail diesel
fleet until 2020
Development of number of diesel locomotives & DMUs, EU27 & EFTA
CleanER-D SP5 scenario 2020
16000
14000
13645
12000
11100
10000
9100 9210
8000
6000
4000
2000
0
2008 2009 2010 2011 2012 2013 201436 2015 2016 2017 2018 10/01/2014
2019 2020
DMUs LocomotivesFuture development of European rail diesel
fleet until 2020 - locomotives
16000
Diesel locomotives fleet development (European railway operators, EU27 & EFTA)
Status: Current fleet is UIC II and older as well as IIIA engines. Approx. 150 new locomotives p.a. Repowering and
145 decommissioning of old vehicles included
14000
12000
10000
600
(6.5%)
8000
• Declining total number of locos 2142
13963 • Late entry of stage IIIB engines and locos (23.3%)
6000 • Significant number of new IIIA locos after 2012
• In 2020 main part of fleet still UIC II and older
4000
6468
(70.2%)
2000
0
2008 2009 2010 2011 2012 2013 201437 2015 2016 2017 2018 10/01/2014
2019 2020
UIC II and older IIIA (incl. remotorisation) IIIBFuture development of European rail diesel
fleet until 2020 – DMUs
12000
DMUs fleet development (European railway operators, EU27 & EFTA)
Status: Current fleet is UICII and older and IIIA engines. Approx. 250 new DMUs p.a. Repowering and
decommissioning of old vehicles included
10000 2250
(20.3%)
650
8000
2338
(21.1%)
6000
• Increasing total number of DMUs
• Entry of IIIB DMUs as intended
8163 • In 2020 significant part of fleet with IIIA & IIIB engines
4000
6513
(58.7%)
2000
0
2008 2009 2010 2011 2012 2013 201438 2015 2016 2017 2018 2019 2020
10/01/2014
UIC II and older IIIA (incl. remotorisation) IIIBTotal exhaust emissions from rail diesel traction
until 2020 - NOx
Total NOx exhaust emissions from rail diesel traction
kt
European railway operators, EU27 & EFTA
250
• Total NOx reduction > 35% until 2020
• Decreasing loco numbers
• Introduction of IIIA & IIIB
200
• Stable NOx emissions from DMUs despite growing fleet and mileage
176,63 172,21
167,90
163,18
157,99
152,55
146,95
150 141,53
135,95
128,70
121,89
116,13
129,72 110,25
100
71,78
50
38,19 38,47
0
2008 2009 2010 2011 2012 2013 2014 2015 2016 2017 2018 2019 2020
40 10/01/2014
Total NOx emissions NOx locomotives NOx DMUsTotal exhaust emissions from rail diesel traction
until 2020 - PM
Total PM Exhaust Emissions from rail diesel traction
kt
European railway operators, EU27 & EFTA
5,0
• Total PM reduction > 45% until 2020
4,5
• Decreasing loco numbers
• Introduction of IIIA & IIIB
4,0 • Stable PM emissions from DMUs despite growing fleet and mileage
3,66
3,54
3,43
3,5 3,31
3,18
3,04
2,89
3,0 2,75
2,61
2,43
2,5 2,26
2,52 2,11
1,96
2,0
1,5
1,09
1,0
0,90 0,87
0,5
0,0
2008 2009 2010 2011 2012 2013 2014
41 2015 2016 2017 2018 2019
10/01/20142020
Total PM emissions PM locomotives PM DMUsTotal exhaust emissions from rail diesel traction
until 2030 (NOx)
200
Total NOx exhaust emissions from rail diesel traction
176,634 Estimation until 2030
180
IIIB continues (high and low number of new vehicles/engines)
vs. new stage after 2020 (low numbers of new vehicles/engines)
160
140
120
110,245
kt
100 98,397
89,848
80
A fast commissioning of stage IIIB yields even 75,634
higher emission reduction than hypothetical „zero emission“ stage!
60
40
20
0
2008 2009 2010 2011 2012 2013 2014 2015 2016 2017 2018 2019 2020 2021 2022 2023 2024 2025 2026 2027 2028 2029 2030
Total NOx, scen. I (low numbers of new vehicles), new stage after 2020
Total NOx, scen. I (low numbers of new43vehicles), IIIB continues after 2020 10/01/2014
Total NOx, scen. II (high numbers of new vehicles), IIIB continues after 2020Total exhaust emissions from rail diesel traction
until 2030 (PM)
4,0
Total PM exhaust emissions from rail diesel traction
3,657 Estimation until 2030
3,5
IIIB continues (high and low number of new vehicles/engines)
vs. new stage after 2020 (low numbers of new vehicles/engines)
3,0
2,5
1,961
2,0
kt
1,477
1,5
A fast commissioning of stage IIIB yields even 1,408
higher emission reduction than hypothetical „zero emission“ stage!
1,0
1,083
0,5
0,0
2008 2009 2010 2011 2012 2013 2014 2015 2016 2017 2018 2019 2020 2021 2022 2023 2024 2025 2026 2027 2028 2029 2030
Total PM, scen. I (low numbers of new vehicles), new stage after 2020
44 10/01/2014
Total PM, scen. I (low numbers of new vehicles), IIIB continues after 2020
Total PM, scen. II (high numbers of new vehicles), IIIB continues after 2020Presentation Outline
Introduction
Sustainability Study
Cost Analysis
Sustainability Impact Assessment
Conclusions
45 10/01/2014Cost Analysis – Objectives
Establish technical options for emission reduction
Develop LCC model for engine and aftertreatment
system only!
Compare LCC for technical options IIIA and IIIB
● Baseline: UIC II
● IIIA
● IIIB EGR + DPF
● IIIB SCR
● IIIB SCR + DPF
Compare costs for technical options
46 10/01/2014LCC distribution locomotive engines
Life Cycle Cost of Locomotive engine with stage IIIB emission control by
EGR+DPF over time period 20 years
47 10/01/2014Cumulated Engine Costs of IIIA and IIIB
Introduction
900
Cumulated life cycle technology costs
800
from introduction of NRMM stages IIIA/IIIB 786
European railway operators, EU27 & EFTA
(Without system integration and platform development costs for stage IIIB!)
700
687
600
500
400
300
200
163
157
100
45
0 7
2008 2009 2010 2011 2012 2013 2014 2015 2016 2017 2018 2019 2020
Total cumulated technology cost (IIIA48+ IIIB vs. UIC II) with high cost option
10/01/2014
in million €
2008 prices Total cumulated technology cost (IIIA + IIIB vs. UIC II) with low cost optionCost Analysis – Conclusions
Fuel consumption is main influencing factor for LCC
Engine first cost (replacement) represent a rather small
percentage of LCC
Aftertreatment and engine maintenance represent
significant part of LCC
Engine costs of introduction of IIIA and IIIB compared to
UIC II cumulate to 680 – 780 million € by 2020 (system
integration costs not included!)
49 10/01/2014Presentation Outline
Introduction
Sustainability Study
Cost Analysis
Sustainability Impact Assessment
Conclusions
50 10/01/2014Impact of introduction of NRMM stages IIIA/IIIB
– NOx
kt Total NOx emissions with & without introduction of IIIA & IIIB
160
European railway operators, EU27 & EFTA
140 138,80
120
100
• Total NOx reduction ~ 20% until 2020 86,57
80 due to introduction of IIIA & IIIB
71,78
60
48,28
40 39,23 38,47
20
0
2008 2009 2010 2011 2012 2013 2014 2015 2016 2017 2018 2019 2020
NOx locomotives 51 NOx locos, continuation UIC II
10/01/2014
NOx DMUs NOx DMUs, continuation UIC IIImpact of introduction of NRMM stages IIIA/IIIB
– PM
kt
Total PM emissions with & without introduction of IIIA & IIIB
3,0
European railway operators, EU27 & EFTA
2,728
2,5
2,0
• Total PM reduction ~ 8% until 2020 (introduction IIIA/B)
1,5
• Lower reduction than for NOx (equal PM performance of
1,152
UIC II & IIIA + good PM performance of UIC I)
0,983
1,0 0,928 1,095
0,866
0,5
0,0
2008 2009 2010 2011 2012 2013 2014 2015 2016 2017 2018 2019 2020
PM locomotives 52 PM DMUs 10/01/2014
PM locos, continuation UIC II PM DMUs, continuation UIC IIExternal Costs
External costs of exhaust emissions from rail diesel traction
External costs per ton NOx and ton PM
Weighted European average costs based on performed
diesel train mileages per country
Benefits of exhaust emissions reduction
Avoided external costs
Per year and cumulated benefits
54 10/01/2014Cost/Benefit of IIIA/IIIB
1600
Cumulated avoided external costs (benefits) vs. cumulated life cycle
1416
technology costs from introduction of NRMM stages IIIA/IIIB
1400
European railway operators, EU27 & EFTA
1200
System integration and platform development costs could not be
considered and would have to be included in any impact
assessment (About 20 platforms for the European rail industry)
1000
800
786
600
687
400
264
200 163
67 157
12
0 45
7
2008 2009 2010 2011 2012 2013 2014 2015 2016 2017 2018 2019 2020
Cumulated avoided external costs from introduction of IIIA/IIIB vs. UIC II
in million €
Total cumulated technology cost (IIIA56
+ IIIB vs. UIC II) with high cost option 10/01/2014
2008 prices Total cumulated technology cost (IIIA + IIIB vs. UIC II) with low cost optionPresentation Outline
Introduction
Sustainability Study
Cost Analysis
Sustainability Impact Assessment
Conclusions
57 10/01/2014Conclusions
Current total emissions from rail diesel traction are very low
The scenarios until 2020 estimate a further significant reduction of emissions
A high commissioning rate of IIIB engines after 2020 can yield higher emission
reduction than a hypothetical “zero emission” stage
An additional reduction of emissions would be possible if the migration of
current engine technologies into the fleet will be accelerated
The migration of current technologies into the fleet can be accelerated if
adequate market conditions will be provided (legislation framework (i.e. time
between new legislation) and incentives as well as technologies with low LCC)
The introduction of stages IIIA and IIIB will generate societal benefits from
cumulated avoided external costs
However system integration and platform development
costs could not be considered and would have to be included in any impact
assessment
58 10/01/2014Thank you for your attention!
Henning Schwarz, henning.schwarz@deutschebahn.com
Dr. Ahmed Al-Sened, ahmed@theengineconsultancy.co.uk
Dr. Roland Nolte, r.nolte@izt.de
Christian Kamburow, c.kamburow@izt.de
59 10/01/2014SP5 Sustainability & Integration
CleanER-D Recommendations & Conclusions
Henning Schwarz, UIC (DB), Judit Sandor, UNIFE
CleanER-D Final Conference
Brussels, 20th November 2013
Grant Agreement number: 234338Recommendations to further reduce emissions
Based on the aforementioned results and conclusions the
CleanER-D consortium derived recommendations towards
● The European Commission
● Member States and Public Procurement Authorities
● Railway Operators
● Engine Manufacturers and Vehicle Integrators and
● Infrastructure Managers
These recommendations could activate further potential and
accelerate the emissions reduction of rail diesel traction in
Europe in the future
3 10/01/2014Key Recommendations to further reduce emissions
Stakeholder Key Recommendation
“Create framework conditions supporting an increase
European Commission
of fleet renewal rates”
Member States and “Provide framework conditions and incentives
Public Procurement supporting an increase of fleet renewal rates and the
Authorities use of innovative technologies”
“Use every possible economic solution over the life of
Railway Operators the vehicle to introduce energy efficiency and emission
reduction technologies in the rail diesel fleet”
Engine Manufacturers and “Provide economically viable solutions, which reduce
Vehicle Integrators emissions, fuel consumption and LCC”
“Support energy efficient operation by intelligent traffic
Infrastructure Managers
flow management on the network”
4 10/01/2014Thank you for your attention!
Henning Schwarz, henning.schwarz@deutschebahn.com
Judit Sandor, judit.sandor@unife.org
5 10/01/2014You can also read