Eskom MYPD4 Revenue Application Focus on Coal and Independent Power Producer Costs - Nersa Public Hearings Durban
←
→
Page content transcription
If your browser does not render page correctly, please read the page content below
Eskom MYPD4
Revenue Application

Focus on Coal and Independent
Power Producer Costs

Nersa Public Hearings
Durban

17 January 2019
The MYPD methodology through the allowable
 revenue formula was applied

 = ( × )+ + + + & + ± + & ±

 Primary Operating Integrated
 Energy Return on Tax &
 IPPs expenditure Demand Depreciation Revenue
(incl imports and Assets Levies
 DMP)
 (incl R &D) Management

 + + + + + + =

 Return on assets = % cost of capital allowed X depreciated replacement asset value

 1

Eskom allowed revenue application for 3 year
 period is R763 billion
 Application Application Application
Allowable Revenue (R'million) AR Formula
 2019/20 2020/21 2021/22
Regulated Asset Base (RAB) RAB 1 268 310 1 336 120 1 401 506
WACC % ROA X -1.32% -0.21% 1.45%
Returns -16 687 -2 765 20 314
Expenditure E + 56 619 59 820 62 663
Primary energy PE + 73 386 75 876 79 561
IPPs (local) PE + 29 590 34 324 41 002
International purchases PE + 3 533 3 734 3 957
Depreciation D + 64 651 72 919 75 649
IDM I + 189 193 202
Research & Development R&D + 176 187 198
Levies & Taxes L&T + 8 272 8 198 8 147
RCA RCA +
Total R'm 219 730 252 485 291 692
Corporate Social Investment (CSI) - - 192 - 193 - 151

Total Allowable Revenue 219 537 252 292 291 542
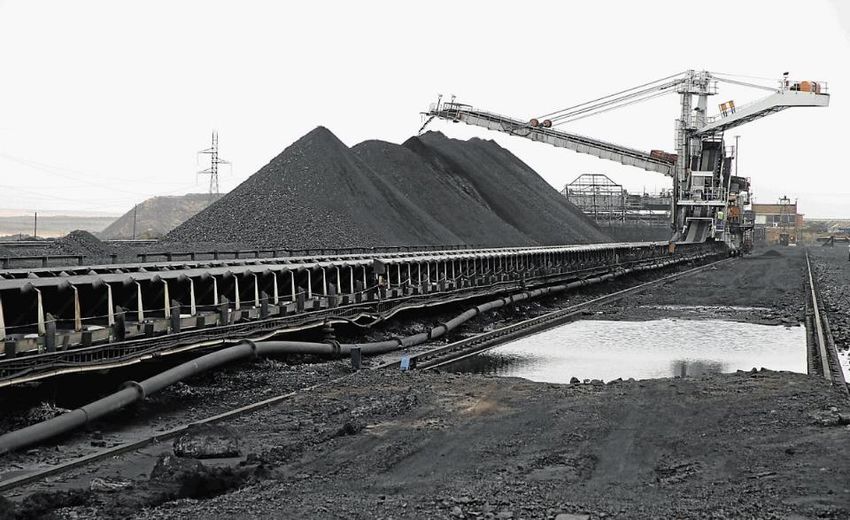
PRIMARY ENERGY COAL COSTS

Eskom is navigating a dynamic coal environment with many
 challenges to manage

Coal supply shortfall at Flexibility in coal
several power stations with procurement to match older
long term contracts coming power stations production
to an end ramp down
 Cost of mining coal Increased pressure from local
 consistently increasing above communities for localization of
 inflation and export prices Eskom goods and services
 influence on the domestic procurement
 market
Competition by the export Growing Renewable Energy
market for Eskom grade coal sector disrupting Eskom’s
within the 4200-5500kcal range business model and no
 demand growth
 Lack of new mining
 investment in large Investors and Funders migration
 scale coal mines away from coal technology. Signal -
 and execution of disinvestment in the South African
 current mining rights coal industry by multinationals
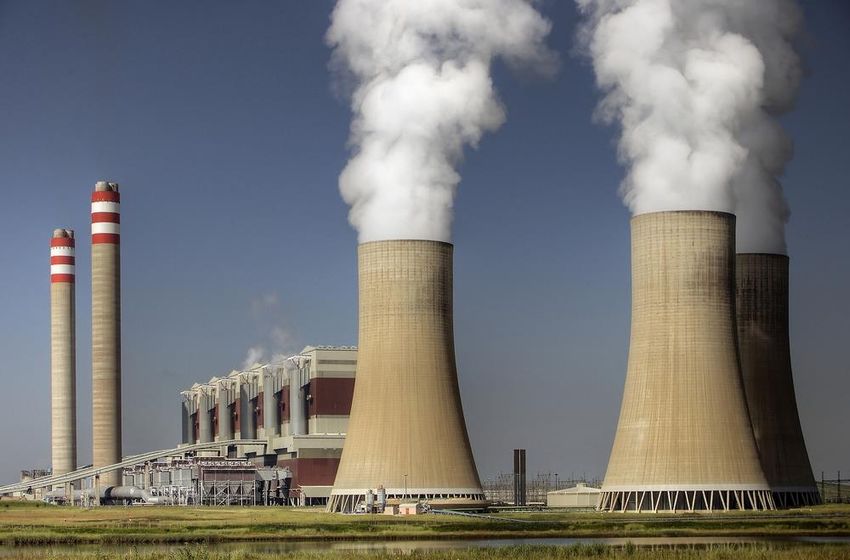
Within this environment -
Eskom has three primary objectives

 Optimal cost of coal Contribute to the lowest cost per MWh sent-out
 for Eskom by delivering pit to boiler optimal
 coal costs

 Meet volume requirements with a safety
 Security of coal supply margin above coal demand to enhance
 flexibility in absorbing burn variance

 Eskom will continue to support transformation of
 Support
 transformation in coal
 its coal procurement spend in line with the
 procurement spend Mining Charter and implemented through
 compliance to the Preferential Procurement
 Policy Framework Act and Broad-Based Black
 Economic Empowerment Act

 5
6
 Critical success factors for objectives to be met
 include

 The NERSA tariff determination based on market cost of mining and
 coal prices

 Availability of capital funding for investment in cost plus mines

 Eskom’s ability to send a strong signal to procure coal on a long term
 basis to achieve prices projected in the application

 Policy and legislation certainty to stimulate investment in new coal
 mines
Cost of coal burn to generate electricity over FY20 – FY22
 period is projected to be R198.5bn

 +10%
 (Rbn) 69 Demand as per 11 year supply plan
 66 Insights
 64

 52
 The difference in volumes
 47
 45 between coal purchases and
 coal burn in:

 FY19:
 – Due to contractual
 volumes at Lethabo &
 Medupi exceeding burn
 requirements
 – Building stock at individual
 FY17 FY18 FY19* FY20 FY21 FY22
 power stations

 FY20 – FY22:
Coal burn
 113.74 115.49 112.93 116.16 113.81 113.54
 – Primarily due to
volumes (Mt)
Coal contractual coal volumes
purchases at Lethabo & Medupi
volumes (Mt) 120.25 115.25 120.44 118.44 116.07 116.18
 Power Stations being
 higher than the burn
 requirement

* FY19 YE projection as at end Nov 2018
Eskom needs to secure up to 1318 Mt of coal in long term,
 (if no Cost Plus investments are made) and 1095 Mt should
 investments in Cost Plus mines are possible and made
 Secured Supply – WITH Cost-plus CAPEX Secured contracts fixed and cost plus
 Mtpa
 Shortfall
 ▪ For foreseeable future Eskom is largely
120 contracted at:
 Cost plus with investment
115 – Matimba - fixed price
110 Cost plus
 – Medupi - fixed price
105
 Additional 223Mt secured Medium term – Duvha - fixed price
100
 through cost plus Fixed price ▪ Lethabo (New Vaal) will require investment &
 95
 investments extension
 90
 85 Demand aswith
 Shortfall per cost
 11 year supply
 plus plan
 investments as per
 80
 draft IRP – 1095Mt
 75
 70 Eskom needs to procure coal by:
 65
 Shortfall reduces from
 60
 1 318 to 1 095 Mt with cost ▪ Providing long term large volume RFP’s to the
 55
 plus mine investments market, to trigger long term contracts with mines
 50
 and investments into coal mining
 45
 40
 35 ▪ Revitalising and continuing investment in
 30 cost-plus mines
 25
 20 ▪ Managing flexibility of demand will be done
 15 through Medium term contracts. These
 10 contracts may be at market related prices,
 5 however it provides flexibility for Eskom to
 0 navigate risks involved
 2020 2025 2030 2035 2040 2045 2050
In 2018, Eskom has secured 91.8Mt of additional coal to be
supplied over a number of years
 Percentage contribution of contracted coal vs. requirement
 Demand as per 11 year supply plan
 Insights

 100 100 100 100 100
 2% 4%
 Coal requirement compared to that
 18% contracted will always fluctuate depending on
 18% 26% 29% a number of factors including:
 4%
 ▪ Electricity demand and outlook.

 ▪ Demand forecast per power station and
 variations to that demand on a daily,
 98% weekly, monthly and any other periodic
 basis.
 78% 76%
 71% 68% ▪ Performance of contracted coal suppliers.

 ▪ Realization of projected coal purchases
 that are not yet contracted at time of
 presentation

 2020 2021 2022 2023 2024

 Uncontracted Flexibility Pipeline Secured

 9
Recovery base plan and projection up to March 2020

Base plan is official recovery plan and tracked on a weekly basis.

 KEY INSIGHTS

• Actual stock days end Dec 27.5 days vs base plan of 21.8 due to new contracts accelerated delivery and lower burn from
 (Gx plant performance)
• Based on high confidence new contracts, forecast to end F2019 at 32 days (5 stations below 20 days but none below 10
 days)
• All power stations recover to expected levels between Sep 2019 and Mar 2020
 10
10 power stations are currently below prescribed
 minimum stock days
 Coal fleet stock levels on 13 January 2019 Below Minimum level
 Above minimum level
 Minimum Alarm Expected Recovery Date
 Power station
 Arnot 26 30 35 Dec 2019
 Camden 20 20 25 Oct 2019
 Duvha 22 26 30 Mar 2020
 Grootvlei 20 23 25 Feb 2020
 Hendrina 20 25 30 Feb 2020
 Kendal 25 30 35 Sep 2019
 Komati 7 7 11 Sep 2019
 Kriel 32 38 44 Mar 2020
 Kusile 25 30 35 N/A
 Lethabo 24 27 30 N/A
 Majuba 40 45 50 Nov 2019
 Matla 27 31 35 Dec 2019
 Matimba 20 24 28 N/A
 Medupi 20 24 28 N/A
 Tutuka 32 36 40 Nov 2019

 Total System* 26 30 37

 • 10 Power Stations are below the prescribed Minimum level
 • 5 stations (viz Arnot, Camden, Hendrina, Kriel and Matla) are below 10 days
 • Total stock excluding Medupi and Kusile = 27.3 days

* Total System excludes Medupi and Kusile 11
SA’s historic bituminous coal production =
 local + export sales. (No surplus availability)
 Sales vs Production of bituminous coal (Mt) Comments

 • No surplus coal in system. All bituminous coal
300 produced is either sold locally or exported.
 251 249 255 256 253 258
 242 243 245 245 248 249 248
 238
250 223 222 219
 59 75
 • Production in 2016 is almost the same as in
 68 68 67 60 66 68 73 73 74 72
200 71 71 2006, but export volume is higher
 69 69 69
 • ‘This is after five years of confusion, after five
150
 years of the mining moratorium because no one
100
 178 182 196 184 185 184 182 181 177 180
 was going to invest...’ Sikonathi Mantshantsha,
 168 173 176 177
 154 152 157
 deputy editor at Financial Mail, on intention to
 50
 revoke MPRDA amendment bill.
 0 • Exports facilitated by increasing Transnet rail
 2000 2001 2002 2003 2004 2005 2006 2007 2008 2009 2010 2011 2012 2013 2014 2015 2016
 capacity to RBCT .

 Production Local sales Eskom burn South African Coal Roadmap steering committee
 Export sales Eskom purchases chairperson Ian Hall:

 Burn vs Purchases (Mt) 133
 126 124 126 • ‘From 2013 to 2019, 120-million tons of new
 120 122 122 122 120
 105
 113 112
 117
 38
 119 115 capacity need(ed)to come on stream’. This did
 11 20 26 31 37
 92 89 93 7 16 40 45 44 44 46 45 not occur
 1 1 2 44
 30 31 31
 28 31 31 30
 29 30 30 30
 31 29 28 31 33
 • ‘The current coal supplies to State electricity
 33 31
 utility Eskom will decline rapidly after 2015,
 68 71 65 67 65
 62 59 60 63 60 60 53 52 50 47 42
 when existing large-scale mines' suppliers
 40 41
 reach the end of their lives and require
• •
 FY00 •
 FY01 •
 FY02 •
 FY03 •
 FY04 •
 FY06 •
 FY07 FY08
 FY09 FY10 FY11 FY12 FY13 FY14 FY15 FY16 FY17 FY18 (expansion) recapitalisation’.

 ST/MT FP CP Burn • SA’s exports expanded from India & China to
 include The Netherlands, Italy, Morocco, Egypt
 Source: SAMI; Eskom PED & Senegal.
Furthermore, bulk of export grade coal competes
with Eskom’s boiler specifications
 South African thermal coal exports – from all ports
 Million ton
 >6,200 kcal/kg, NAR 5,000-5,600 kcal/kg, NAR
Eskom faces a coal supply shortfall, however has a
plan to remedy the problem on long term basis
 Causes of coal supply shortages Long term coal strategy pillars

• Unsuccessful negotiations to extend Arnot • Extension of cost plus mines for total reserves
 Power Station tied colliery coal supply to match power stations life.
 agreement • Investment in cost plus mines to access
• Kusile long term tied colliery coal contracts did remaining reserves for contractual volumes
 not materialize (makes up the bulk of the 1 • Extension of the tied long term fixed price
 318Mt shortfall) collieries
• Contract negotiations to extend the Hendrina • Expansion of domestic rail infrastructure for
 tied colliery coal contract discontinued Eskom by Transnet
• Lack of capital investment in the at four of the • Coal open tenders to source coal for the
 five cost plus mines resulting in reduced remaining life of power stations
 production – mines producing at 68% of
 contractual
• Limited investment in RSA in opening new
 large scale mines
• Increased export volume of Eskom grade coal
It is critical for Eskom to recapitalise cost plus
mines to stem the production decline…
R bn CP production (Mtons)
 Investment
 Reinvestment in mines
 No investment
 Reinvestment in equip 3,93 38,33
 36,85
 Beneficiation 35,43
 34,63 34,35
 Water treatment 1,93 8,13
 8,55
 Logistics 6,65 9,34

 Other R5.65bn 2,58

 2,13
 3,79

 32,70
 1,31 30,20
 1,23 2,43 27,70 28,30
 26,09
 0,94 2,01
 0,80
 0,88

 0,26 0,92
 0,19 0,12 0,43
 0,07 0,18
 0,11 0,08 0,16 0,05
 0,12 0,10
 0,05 0,05
 0,02 0,08 0,08
 FY17 FY18 FY19 FY20 FY21 FY22 FY23 FY24 FY20 FY21 FY22 FY23 FY24

• With investment in CP mines, an additional 34.6 Mt is forecast over FY20 – FY24

• More than 90% of capital expenditure over FY20 – FY22 is for reinvestment in the cost plus mines.

• Investing in cost plus mines is integral to Eskom’s long term coal strategy.

• Investment in cost plus mines and extension of cost plus agreements is required to secure coal volume. Steady state
 coal supply and costs is anticipated from about FY23/24 based on investments taking place as planned

• Impact of not investing in cost plus mines will result in further reduction in coal from these mines and an increase in
 expenditure on short/medium term coal.
…and manage increases in cost of coal burnt to
generate electricity

• RSA has experienced limited investment in new coal mines, especially new large mines.

• Eskom has been increasingly competing for coal with other buyers, especially seaborne.

• Annual increases in coal R/ton cost have been impacted by lower production at cost plus
 mines and increasing costs of replacement coal due to associated transport costs.

• Eskom intends to:
 • Increase or contract coal from suppliers closest to the Eskom Power Stations

 • Invest in Cost Plus mines

 • Secure long term coal contracts through life of Power Station open tenders

 • Procure coal through transparent coal procurement mechanisms in line with
 Preferential Procurement Policy Framework Act regulations.

 • Seek and strive to manage coal cost increases over MYPD application periods
 estimated at less than 10% per annum on a CAGR basis
Independent Power
Producer Costs
Policy implementation
 Regulations for New Generation Capacity

Integrated Resource Plan Approved IRP

 Developed Cabinet Approval
 By DoE Gazetted
 DoE Accountable Minister of Energy
 Eskom procure or
 Determination build
 Eskom
 Minster of Energy, Eskom responsible
 with Minister of Finance for ownership,
 engineering,
 procurement and
 IPP construction

 Procurement
 (bid evaluation, negotiating
 PPAs)

 Procurer- DoE,
 Buyer - Eskom

 2019/01/17 18
Principles of Section 34 procurement

– In Terms of Regulations of Electricity Regulation Act (ERA), Minister of Energy makes a
 determination that Eskom be buyer of energy from IPP’s

– Before signing a Power Purchase Agreement (PPA), the Regulations also require Eskom to ensure
 that it meets requirement for “value for money” and also ensure PPA meets requirements of
 Electricity Regulation Act, Public Finance Management Act, Companies Act and all applicable
 legislation before signing in line with Board’s fiduciary duties

– When Eskom makes an MYPD revenue application, Eskom estimates future costs of actual
 purchases of power from IPPs as well as administration costs (employee benefits, depreciation, travel
 and subsistence, legal costs, office costs).

– NERSA assesses costs as forecasted by Eskom for future period covered by the particular MYPD
 revenue application, and if NERSA deems it appropriate it will substitute a different assumption
 regarding these future costs, for the purpose of its revenue determination.

– IPP costs are included in the revenue allowance made to Eskom and are subsequently included in
 the calculations of the Eskom tariffs to customers. Therefore, Eskom recovers these costs through
 revenue when customers pay Eskom, same as for Eskom’s other costs.

– After the end of the financial year, when Eskom submits the Regulatory Clearance Account (RCA)
 application, a comparison is made of the assumed costs as included in the MYPD revenue
 determination versus the actual costs incurred i.e. payments to IPPs for the year, to determine if there
 was an over recovery or under recovery

– Eskom will be refunded (by virtue of an ‘add-on’ to future ‘allowed revenues’ thus tariffs) for an under
 recovery and for an over recovery Eskom will have a reduction of the RCA amount (thus a deduction
 from future ‘allowed
Primary energy indicates an increasing trend in
IPPs and decreasing trend in coal

 = ( × )+ + + + & + ± + & ±
 • Generation own primary energy
 9%
 132,667
 costs have a compounded
 average growth rate (CAGR) of
 122,131
 114,781 6.4% per annum from 2018/19 to
 2021/22

 58% • Non-Eskom primary energy costs
 60% reflect a CAGR of 14.8% per
 62% annum between 2018/19 to
 2021/22. Of this, local IPPs have
 a CAGR of 15.6%.

 31%
 • Total primary energy reflects a
 26% 28% CAGR of 9.0% per annum
 between 2018/19 to 2021/22
 1% 1% 1%
 7% 7% 6%
 0% 0% 1% 3% 0%
 1% 3% 1% 3% • Coal burn costs reflect a CAGR
 FY2019/20 FY2020/21 FY2021/22 over the period of 7.8% per
 annum
 Coal Environmental levy Nuclear DMP
 IPPs International purchases OCGT
 20
IPP portfolio mix assumptions – energy

 GWh

20.000 DoE Peakers Assumptions on IPP
 Renewables 88 portfolio mix for
 STPPP/MTPPP MYPD4:
15.000 88 • DOE Peaker
 projects –
 67 88 contractual
 169
10.000 105 18.577
 assumptions
 7.228 • REIPP - five bid
 14.947
 12.010
 windows (bid
 11.282
 5.000 9.479 window 1, 2, 3,
 3.5, 4)
 4.235 • No short-term
 0 0 0 0 0 0 Eskom
 2016/17 2017/18 2018/19 2019/20 2020/21 2021/22 programmes

 21
IPP portfolio mix assumptions – costs

 R million
 IPP portfolio mix
45.000 Assumptions for MYPD 4
 DOE Peakers
40.000 2.513 • DOE Peaker projects
 Renewables
 – contractual
35.000 STPPP/MTPPP
 2.463 assumptions
30.000
 2.422
25.000 2.648 • REIPP
20.000 2.186 2.291 - Signed (BW 1, 2, 3,
 38.220
 3.5 and 4) – using
15.000 31.607
 26.928 PPA prices
 15.582 23.709
10.000 19.008 &expected energy
 5.000
 3.952 • No short-term Eskom
 0 programmes
 2016/17 2017/18 2018/19 2019/20 2020/21 2021/22

 22
IPP programme details

Renewable IPP programme
• Five bid windows (bid window 1, 2, 3, 3.5, 4) concluded.
• Costs for BW 1 through 4 are based on finalised power purchase agreements (PPAs)
• Costs associated with the Small Renewable IPP programme are not included in this application

DoE Peaker
• The Peaker programme has been fully operational from 20 July 2016 with capacity of 1 005 MW.
• These power stations are compensated for available capacity on system and energy produced.
• They are fully dispatched by System Operator.
• Expected load factor of 2 stations is 1%, leading to an expected energy output of 88 GWh per year.

Co-generation
• One contract was announced under the Co-generation programme but has never been finalised.
• Co-generation costs are not included in this application.

Base-load Coal
• Two preferred bidders were announced under the Coal programme but these contracts have not been
 finalised.
• Costs associated with the Coal programme are not included in this application.

Wholesale Electricity Pricing System (WEPS) programme
• The application does not include any allowance for Eskom short term programmes.

 23
Renewable energy determinations
 Minister of Energy designates RE for IPPs;
 Eskom is Buyer
 IRP 2010 capacities and status of
Renewable Energy Independent Power determinations to allocate them for implementation
Producer Procurement Programme
(REIPP)
• 1st determination 2011 (3725 MW)
• 2nd determination 2012 (+ 3200 MW)
• 3rd determination 2015 (+ 6300 MW)
 Operational
 Announced

 Contracted
 Approved

TOTAL 8 127 6305 6305 3876
BW1 1425 1424 1424 1415
BW2 1040 1041 1041 1033
BW3 1457 1435 1435 1428
BW3.5 200 200 200 0 2011 determinations Eskom commitments (pre IRP)

BW4, 4.5 2205 2205 2205 0 2012 determinations

BW 5 1800 0 0 0 2015 determinations
Smalls 1 49 0 0 0
 24
IPP procurement prices
 Steady decline in Wind and PV costs

 CSP PV Wind

 4 500
 Average energy price (R/MWh, 2018 ZAR)

 4 064
 3 907
 4 000
 3 588
 3 971
 3 500

 3 000

 2 500
 2 460

 2 000
 1 702
 1 322
 1 500

 1 373 995
 1 000
 979 825
 500

 -
 BW1 BW 2 BW 3 BW 4

Source: SBO estimated payment in April 2023 (when all operating), adjusted to 2018 ZAR. Some BW 2 and BW 3 projects have partial
indexation (leading to over-estimation of cost relative to others not using partial indexation). CSP average prices reflect expected
generation over peak which carries substantial price premium.

2019/01/17 25
Renewable Portfolio (for FY 2021/22)

Expected energy output (GWh)
Technology BW1 BW2 BW 3 + 3.5 BW 4 Total
Wind 1 973.40 1 741.93 2 803.80 3 960.96 10 480.10
Solar PV 1 324.57 988.70 959.56 2 133.10 5 405.93
CSP 502.28 232.94 1 584.73 0.00 2 319.95
Other 0.00 93.08 53.64 224.51 371.24
Total 3 800.26 3 056.66 5 401.74 6 318.57 18 577.22

Average price (R/MWh) (2018 ZAR)
Technology BW1 BW2 BW 3 + 3.5 BW 4 Total
Wind 1 702.17 1 373.08 978.68 825.29 1 122.50
Solar PV 3 970.80 2 459.71 1 321.57 995.40 2 050.14
CSP 4 063.84 3 907.45 3 588.33 - 3 723.32
Other - 1 470.59 1 289.53 1 777.53 1 630.05
Total 2 805.04 1 920.67 1 808.28 916.55 1 727.37
Note: Impact of additional CSP (200 MW) from BW 3.5 counters the price reduction in PV and Wind from BW 2 to BW 3
Additional cost of BW 4 at 91,7c/kWh (not R2.22/kWh mentioned in media) 26
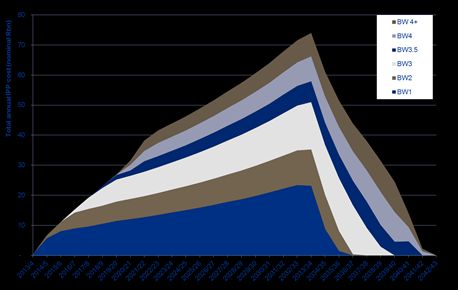
REIPPP Bid Window Costs (Real)

 35 000,00 3

 Average REIPPP price (R/kWh, 2018 ZAR)
Annual PPA cost (Rm, 2018 ZAR)

 30 000,00
 2,5

 25 000,00
 2

 20 000,00

 1,5

 15 000,00

 1
 10 000,00

 0,5
 5 000,00

 - 0

 BW 4+ BW4 BW3.5 BW3 BW2 BW1 Avg price (rhs)

 27
Trends in IPP revenue increase (nominal)

 CAGR increase of 15.6% over MYPD 4 application period
Seasonal output patterns - REIPPP

 REIPP Monthly Capacity Factor
 60

 50

 40
Capacity factor (%)

 30

 20

 CSP
 10
 Wind
 PV

 0
 Jan-16 Apr-16 Jul-16 Oct-16 Jan-17 Apr-17 Jul-17 Oct-17 Jan-18 Apr-18 Jul-18 Oct-18
 29
Average REIPPP prices per technology

 30
Thank you
You can also read