Characteristics of rice agribusiness in rural areas of Serdang Bedagai regency, North Sumatra
←
→
Page content transcription
If your browser does not render page correctly, please read the page content below

IOP Conference Series: Earth and Environmental Science

PAPER • OPEN ACCESS

Characteristics of rice agribusiness in rural areas of Serdang Bedagai
regency, North Sumatra
To cite this article: Moral Abadi Girsang et al 2021 IOP Conf. Ser.: Earth Environ. Sci. 807 032062

View the article online for updates and enhancements.

                                This content was downloaded from IP address 46.4.80.155 on 27/09/2021 at 12:42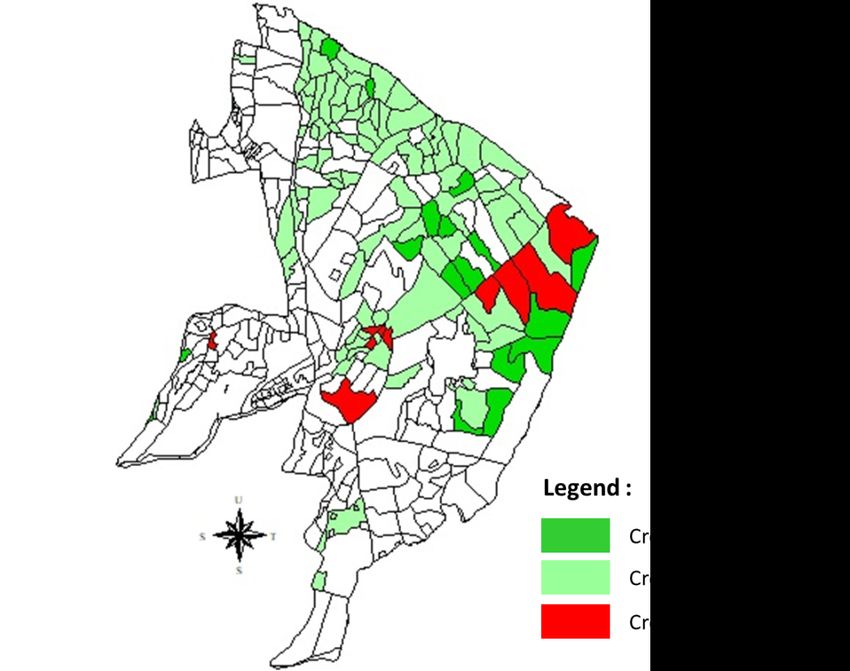
IC-FSSAT 2021                                                                                                  IOP Publishing
IOP Conf. Series: Earth and Environmental Science 807 (2021) 032062                        doi:10.1088/1755-1315/807/3/032062

Characteristics of rice agribusiness in rural areas of Serdang
Bedagai regency, North Sumatra

                     Moral Abadi Girsang, Khadijah El Ramija, Imelda S Marpaung, Erpina Delina
                     Manurung, Tumpal Sipahutar, L Haloho, and P Nainggolan

                     North Sumatra Assessment Institute for Agricultural Technology (North Sumatra
                     AIAT)

                     E-mail: abadigirsang@gmail.com

                     Abstract. This research was conducted to determine the characteristics of the rice farming
                     system in Serdang Bedagai Regency and to recommend policies to increase the contribution of
                     rice agribusiness to rural development. The studies carried out included the existing technology
                     used by farmers, production, productivity, cropping index, analysis of farming system and
                     distribution, and marketing of products. The research method used in this study is a survey
                     method with a purposive sampling technique to 40 farmer respondents. Structured interviews
                     were also conducted with traders, rice mill entrepreneurs, and policymakers. The data analysis
                     used in this research is qualitative and quantitative analysis. Qualitative analysis is used to find
                     an overview of the technology, production, productivity, cropping index, and marketing and to
                     explain the costs and income of rice farmers which are described descriptively. The quantitative
                     analysis used is the analysis of farm costs and income, which are the ratio of revenue and costs
                     (R/C ratio) analysis and the cost per kg milled dry grain. The results showed that the cultivation
                     technology used by farmers was varied, there were 23 villages whose rice productivity was still
                     below 5 tons/h, 10 villages in 3 sub-districts had the cropping index still below 2, the R / C ratio
                     of rice farming was 1.45, where the cost to produce 1 kg of milled dry grain in Serdang Bedagai
                     Regency, on average are IDR 3,099. Meanwhile, the distribution and marketing of the harvest
                     were controlled by big rice mill entrepreneurs.

1. Introduction
Rice is a strategic commodity because it is the main source of food that influences the economy and
politics in Indonesia. As one of the countries with the most populous population and experiencing an
increase in population growth every year, followed by an increase in national rice consumption. Based
on GriSP (2013), Indonesia is the third rice producer and the first largest rice consumption in the world
with a per capita calorie intake from rice of 50.7% (1,260 kcal per day) in 1995 to 47.6% (1,259 kcal
per day) year 2009 [1]. Efforts to achieve sustainable food self-sufficiency are still an important agenda
for Indonesia, not only related to the issue of national sovereignty but because the need for rice
consumption per capita of the Indonesian population is among the highest in the world [2]. Per capita,
rice consumption reaches 113 kg/year, higher than other rice consuming countries, so that every year
there is an increase in consumption needs [3].
   North Sumatra as the 6th national rice producer after East Java, West Java, Central Java, South
Sulawesi, and South Sumatra has an important role in supporting national food self-sufficiency. The

              Content from this work may be used under the terms of the Creative Commons Attribution 3.0 licence. Any further distribution
              of this work must maintain attribution to the author(s) and the title of the work, journal citation and DOI.
Published under licence by IOP Publishing Ltd                          1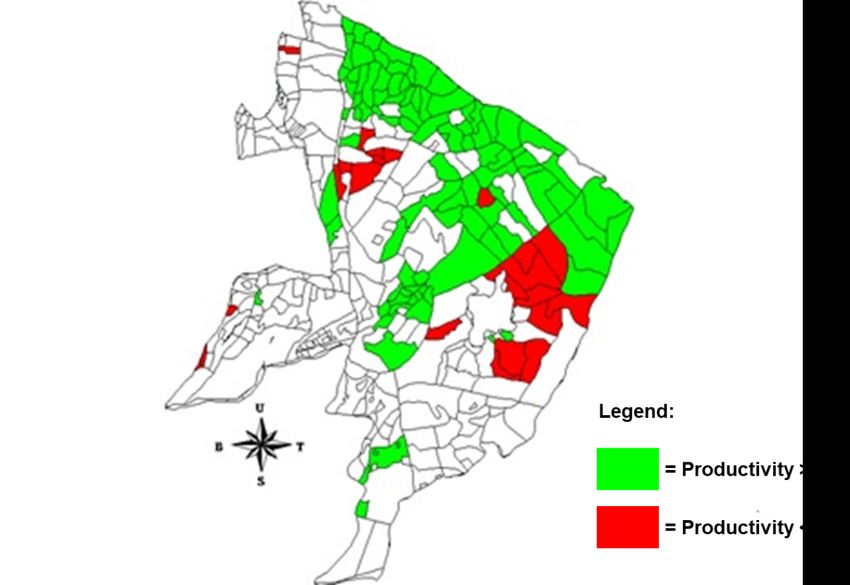
IC-FSSAT 2021                                                                             IOP Publishing
IOP Conf. Series: Earth and Environmental Science 807 (2021) 032062   doi:10.1088/1755-1315/807/3/032062

total land area is 438,346 ha with an average production of 5.14 tonnes, and a productivity of 5.2 t / ha,
which contributes 3.4% to national food [4]. The increase in rice production from 2014 to 2017 by
25.3% is better than the increase in the population of only 3.5%. As an overview, in North Sumatra five
districts have contributed greatly to the success of increasing rice production, namely Langkat, Deli
Serdang, Serdang Bedagai, Simalungun, and Mandailing Natal regencies with a harvest area of 92,189.1
ha each; 88,881.5 ha; 84,042.1 ha; 71,911.4 ha; 62,713 ha or about 46.3% of the total harvested area in
2017 [4]. This success is supported through 2 aspects, namely increasing planting area and increasing
productivity through the paddy field printing program, special efforts (UPSUS) for food self-sufficiency
in increasing IP and the spread of new superior varieties, and other important programs.
    One of the biggest rice contributors in North Sumatra is Serdang Bedagai regency. Farmers are
enthusiastic about planting rice well, supported by relatively fertile irrigated rice fields, farmers
responsive to technology, close access to Medan City so that all the information needed can be quickly
obtained [5]. This district is one of the regencies on the East Coast of North Sumatra with an area of
1,900.22 km2. Geographically relatively flat, the altitude ranges from 0-500 meters above sea level.
Based on the administrative area, it consists of 17 districts and 237 villages, and 6 sub-districts. The
total population in 2017 was around 612,924 people with a composition of 307,722 men and 305,202
women with a population density of 323 people/km2 [6]. Based on Serdang Bedagai regency potential
as one of the important rice contributor in North Sumatra, this research was done to determine the
characteristics of rice farming and understand the rice marketing pathway in Serdang Bedagai Regency.

2. Methodology
This study was designed as an explanatory study with a survey method. This research used quantitative
and qualitative analysis. The qualitative analysis includes analysis of the general state of rice farming
which includes existing technology, production, productivity, cropping index, land area, and harvest
area. The quantitative analysis in the form of income analysis used the R/C ratio analysis which is widely
used to see the cost effectiveness incurred and is more suitable for seasonal farming such as rice.
    Types and sources of data used in this study are primary and secondary data, both quantitative and
qualitative. Primary data were collected from observations and direct interviews with rice farmers,
market players, and field agricultural extension workers (PPL) using survey methods [7]. Interview data
were obtained by conducting interviews on 20 rice farmer respondents in each Melati and Pegajahan
villages with a list of questions structured and 40 total respondents were interviewed. Respondents were
collected purposively (purposive). Secondary data were obtained by collecting information through
literature studies from several related government agencies and then analyzed by descriptive method
[9]. Farmers' data on rice farming were analyzed by:
Total Cost (TC) = TFC + TVC
     TC       = Total Cost (Rp)
     TFC      = Total Fix Cost (Rp)
     TVC = Total Variable Cost (Rp)

Revenue [8]
   TR       =    PxQ
   TR       =    Total Revenue (Rp)
   P        =    Price (Rp)
   Q        =    Quantity (kg)

Income [10]
    I     =     TR – TC
    I     =     Income(Rp)
    TR    =     Total Revenue (Rp)
    TC    =     Total Cost (Rp)

                                                     2
IC-FSSAT 2021 IOP Publishing
IOP Conf. Series: Earth and Environmental Science 807 (2021) 032062 doi:10.1088/1755-1315/807/3/032062
Profitability [10]
π = TR – TC
π = Profitability (Rp)
TR = Total Revenue (Rp)
TC = Total Cost (Rp)
To determine the feasibility of rice farming, the Revenue Cost Ratio (R/C ratio) is used, which is the
result of the division between revenues and total costs [9]. To determine the feasibility of farming a
formula is used [9]:
RCR = TR – TC
RCR = Revenue Cost Ratio
TR = Total Revenue (Rp)
TC = Total Cost (Rp)
3. Results and discussions
3.1. Existing technology
In general, rice farming activities in Serdang Bedagai Regency are carried out in rainfed and irrigated
rice fields, with a relatively small scale of land ownership, between 0.2 hectares to 1 hectare. The
technology of rice cultivation that is carried out is also relatively varied with the common spacing is the
tegel system of 25 x 25 cm by 30% of farmers, and legowo row 4: 1 by 70% of farmers. According to
the Badan Litbang Pertanian (2013), the plant population of the 4: 1 legowo model with a spacing (20 ×
10 cm) × 40 cm is 36 clumps/m2, while with a 20 × 20 cm tegel system there are 25 clumps/m2 [10].
This will affect the plant population per unit area and the number of productive tillers, and in the end, it
will affect crop production. This is also related to the effect of peripheral crops, which are expected to
be productive so that they will give higher yields.
The results of the study using the legowo planting system show that legowo 4:1 has a higher
production compared to legowo 2: 1 for both Inpari 30 and Inpari 15 [11]. The seeds used are generally
labeled seeds with the majority using superior varieties, either ciherang or inpari, although some farmers
also use mekongga variety. Meanwhile, land processing is generally carried out correctly. In general,
most of the rice farmers in this district have implemented the recommended cultivation technology. The
annual cropping pattern that is commonly applied by farmers in this regency is Rice-Rice-Palawija, or
what is mostly done is the Rice-Rice-Soybean pattern. Generally, rice planting time is June-September
and October-January, while February-May is the planting time for crops/soybean commodities
3.2. Harvest area, production, and productivity
Based on the data from BPS (2018), the rice harvested area in this district is 86,316 hectares with
production reaching 485,839,563 tons, with an average productivity of 5.87 tons/hectare (Table 1) [4].
From table 1, it can be seen that Sei Bamban and Perbaungan districts are districts with the largest
planting and production areas, where Sei Bamban District has a rice planting area of 15,135 hectares
with a production of 93,990 tons, while Perbaungan District has an area of 12,277 hectares with a
production of 64,666 tons. However, if viewed from the productivity aspect, the sub-district that has the
highest rice productivity is Pantai Cermin District with productivity reaching 6.11 tons/hectare followed
by Perbaungan District with productivity reaching 6.08 tons/hectare. However, the average rice
productivity in Serdang Bedagai Regency is relatively above the national average productivity of 5.4
tons/hectare. Meanwhile, two districts do not have rice fields, namely Dolok Merawan District and
Bintang Bayu District, because these two districts are generally areas for oil palm plantations, both
privately owned, government and community plantations.
3IC-FSSAT 2021 IOP Publishing
IOP Conf. Series: Earth and Environmental Science 807 (2021) 032062 doi:10.1088/1755-1315/807/3/032062
Table 1. Planting areas, harvesting area, production, and productivity
Districts Planting areas Harvesting areas Production Produktivity
(hectares) (hectares) (tonnes) (ton/hectare)
2 Dolok Masihul 3,418 3,536 20,088.43 5.68
3 Sipispis 375 203 1,139.681 5.61
4 Dolok Merawan 0 0 0 0.00
5 Tebing Tinggi 4,966 3,203 18,535.314 5.79
6 Bandar Khalifah 9,689 10,605 59,179.688 5.58
7 Tanjung Beringin 9,862 10,702 59,834.784 5.59
8 Teluk Mengkudu 7,770 7,554 43,951.416 5.82
9 Sei Rampah 7,080 7,982 45,971.663 5.76
10 Perbaungan 12,277 10,628 64,666.004 6.08
11 Pantai Cermin 8,450 7,060 43,166.875 6.11
12 Silinda 693 458 2,414.554 5.27
13 Bintang Bayu 0 0 0 0.00
14 Serba Jadi 2,040 2,234 13,008.225 5.82
15 Tebing Syahbandar 1,628 1,142 6,453.34 5.65
16 Sei Bamban 15,135 16,479 93,989.279 5.70
17 Penggajahan 2,928 2,243 13,412.41 5.98
Total 86,316 84,034 485,839.563 5.78
If we look in more detail, there are several villages in the Serdang Bedagai Regency where the
productivity of paddy farming is still far below the average rice productivity of both North Sumatra
Province and the national average of Indonesia. From Table 2. It can be seen that there are 23 villages
in 4 districts in this district whose average productivity is still below 5 tons/hectare. There are 6 villages
in Tebing Tinggi District and 4 villages in Silinda District, the average productivity is even below 4
tons/hectare, as well as 1 village in Tebing Syahbandar District whose average productivity is still below
4 tons/hectare. Meanwhile, there are 8 villages in Pegajahan District that have an average productivity
of 4.6 tons/hectare, but this average yield is also still below the provincial and national average. The low
productivity of rice in some of these villages is likely due to several factors, such as the quality of the
seeds used, the use of balanced fertilizers, and inadequate control of pests and diseases [12].
To simplify the distribution of the average productivity of rice in Serdang Bedagai Regency per
village, it can be seen in Figure 1. regarding the map of the distribution of productivity at the village
level in Serdang Bedagai Regency. The map clearly shows the distribution of villages with rice
productivity below 5 tonnes/hectare and above 5 tonnes/hectare. With the map of the distribution of the
cropping index, it is hoped that it can facilitate the implementation of IP enhancement activities in these
districts.
4IC-FSSAT 2021 IOP Publishing
IOP Conf. Series: Earth and Environmental Science 807 (2021) 032062 doi:10.1088/1755-1315/807/3/032062
Figure 1. Map of distribution of rice productivity level in Serdang Bedagai Regency
Table 2. Average Rice Productivity at Village Level in Serdang Bedagai Regency.
Districts Villages Productivity(t/h)
Tebing Tinggi Kuta Baru 3.8
Mariah Padang 3.8
Paya Bagas 3.8
Paya Lombang 3.9
Paya Mabar 3.8
Sei Priok 3.8
Silinda Kulasar 3.8
Pagar Manik 3.9
Pamah 3.9
Sungai Buaya 3.9
Tebing Syahbandar Binjai 4.1
Kuta Pinang 4.1
Penggalangan 3.8
Penggalian 4.0
Paya Pinang 4.0
Pegajahan Bingkat 4.6
Jati Mulyo 4.4
Karang Anyar 4.6
Lestari Dadi 4.6
Pegajahan 4.6
Petuaran Hilir 4.6
Petuaran Hulu 4.6
Sennah 4.6
5IC-FSSAT 2021 IOP Publishing
IOP Conf. Series: Earth and Environmental Science 807 (2021) 032062 doi:10.1088/1755-1315/807/3/032062
3.3. Cropping index
The low productivity and production of rice in several villages in Serdang Bedagai Regency was also
followed by low cropping index, there were 10 villages in 4 districts, namely Tebing Tinggi, Kotarih,
Dolok Masihul, and Bandar Khalifah Districts whose cropping indexes were still below IP 200 and 2
villages in Tebing Tinggi subdistrict, apart from having a low cropping index, also has very low
productivity, which is only 3.8 tonnes/hectare. Meanwhile, in the other 3 districts, although the cropping
index was low, from a relative productivity aspect it was quite high because their productivity was
already above the national average productivity (Table 3).
One of the efforts to increase rice production in Serdang Bedagai Regency is by introducing a
program to increase the cropping index. The activity of increasing the cropping index in its
implementation in the target development area uses two strategies, namely technological engineering
and social engineering intending to optimize space and time so that the next maximum cropping index
production and farmer income also increases [13]. The effort to introduce the increase of IP Paddy to
development target areas until it can be adopted by farmers is not easy. First, several preparatory steps
are needed, knowing the biophysical, socio-economic conditions, and existing technology that has been
applied by farmers. This information is the basis for engineering technology and social engineering to
create conducive conditions according to the requirements needed [14].
Table 3. Distribution of Villages with Rice Planting IndexIC-FSSAT 2021 IOP Publishing
IOP Conf. Series: Earth and Environmental Science 807 (2021) 032062 doi:10.1088/1755-1315/807/3/032062
Figure 2. Map of Village Level Crop Index Distribution in Serdang Bedagai District
3.4. Rice Farming analysis
The results of the analysis of rice farming in Serdang Bedagai Regency were calculated based on the
average results of 30 respondents who were interviewed using purposive sampling. These results
indicate that the total costs incurred by farmers for 1 hectare of land reached Rp. 15,492,687, with an
average yield of 5 tonnes per hectare, rice farmers can generate a gross income of Rp. 22,500,000. If it
is deducted from the total cost, each farmer can generate a net income of Rp. 7,007,313 for each hectare
per season.
From Table 4, it can be seen that the cost for labor is the largest portion of the cost, namely Rp.
6,283,400 or around 41% of the total cost, while the second-largest cost after labor is the cost for land
lease, which is Rp. .5,000,000 / hectare/season or up to 32% of the total cost. The third-largest cost is
the cost of buying fertilizer, which is Rp. 2,716,700, or 17.5% of the total cost. Although the costs
incurred by farmers are relatively large, economically, this activity is still very profitable. It can be seen
from the R / C ratio that it still reaches 1.45. The ratio is still> 1 which indicates that this business is still
economically feasible.
More details about the cost structure of rice farming in Serdang Bedagai Regency for each 1 kg of
milled dry grain production can be seen in the graph in Figure 3. It was shown that the total cost to
produce 1 kg of milled dry grain in Serdang Bedagai Regency on average costs Rp. 3,099 / kg of milled
dry grain. Of these costs, labor costs are the highest cost spent by farmers, reaching around Rp. 1,257 /
kg milled dry grain, while the second-largest cost incurred by farmers to produce 1 kg of milled dry
grain was land lease costs which reach Rp. 1,000 / kg milled dry grain, followed by fertilizer costs as
the third-largest cost, reaching Rp. 543.34 / kg milled dry grain. Broadly speaking, the cost used to
produce 1 kg of milled dry grain for rice in Serdang Bedagai Regency is quite high when compared to
the cost of 1 kg of milled dry grain in Vietnam, which is Rp. 1,900 /kg milled dry grain [15].
7IC-FSSAT 2021 IOP Publishing
IOP Conf. Series: Earth and Environmental Science 807 (2021) 032062 doi:10.1088/1755-1315/807/3/032062
Table 4. Analysis of Rice Farming in Serdang Bedadai Regency
Item Costs (Rp.)
Seed 100,446
Fertilizer 1,377,500
Manure 1,339,200
Pesticide 919,641
Labor: 6,283,400
- Sowing 89,000
- Land preparation 1,246,000
- Fertilization 854,400
- Planting 1,246,000
- Weeding 1,496,268
- Pest Controlling 854,400
- Harvesting 1,993,600
Land Tax 150,000
Land Lease 5,000,000
Irrigation fees 322,500
Total Cost 15,492,687
Production (t) 5 ton
Price MDG/Kg 4,500
Revenue 22,500,000
Income/season 7,007,313
R/C 1,452
Seed; 20,8
Fertilizer;
543,34
Pesticide;
183,93 Land lease;
1000
Labor; 1256,68
Irrigation fee;
64,5
Land tax; 30
Cost IDR/kg MDG (Milled Dry Grain)
Figure 3. Graph of Total and Cost Components of Production of 1 Kg of MDG in Serdang Bedagai
Regency
3.5. Marketing
Rice marketing in Serdang Bedagai Regency starts with farmers who, on average, sell their rice in the
form of harvested dry grain rice at the location of each farmer's rice farm. The produce was bought by
an agent who was usually an accomplice to a large rice mill from Sei Rampah City. These crops are sold
at a price range of Rp. 4,300-Rp. 5,000 depending on the size of the rice supply available at that time.
8IC-FSSAT 2021 IOP Publishing
IOP Conf. Series: Earth and Environmental Science 807 (2021) 032062 doi:10.1088/1755-1315/807/3/032062
Agents usually get a fee from rice milling of around Rp. 100 / kg MDG. Rice that has been milled into
rice is marketed domestically in Serdang Bedagai Regency, is also marketed to other regencies/cities
outside Serdang Bedagai, and also marketed outside of North Sumatra Province. The flow of rice
marketing from Serdang Bedagai Regency can be seen in Figure 8 below.
Figure 4. Rice Marketing in Serdang Bedagai Regency
4. Conclusion
1. There are still 23 villages in four sub-districts whose rice productivity is still below 5
tonnes/hectare
2. There are still 10 villages in four sub-districts whose crop index is still below 2 times a year.
3. On average, rice farming activities in Serdang Bedagai Regency are still feasible because the
financial R/C ratio is 1.45
4. The cost of producing rice per kg of GKP in Serdang Bedagai Regency is relatively high, namely
Rp. 3,099/kg GKP
5. The distribution and marketing of the rice harvest in Serdang Bedagai regency were controlled by
big rice mill entrepreneurs.
References
[1] GRiSP (Global rice science partnership) 2013 Rice almanac, 4th edition (Los Baños
(Philippines): International Rice Research Institute)
[2] Suswono 2013 Pengembangan Kelembagaan Petani Kecil untuk Mendukung Pembangunan
Pertanian dan Pedesaan (Bogor: Institut Pertanian Bogor)
[3] Tarigan H, Suhaeti R N and Rivai R S 2018 Strategi komunikasi pemanfaatan varietas unggul
baru padi toleran rendaman Anal. Kebijak. Pertan. 14
[4] BPS Sumut 2018 Sumatera Utara Dalam Angka Tahun 2018
[5] Haloho L, Paul L S, Sipahutar T and Silalahi M 2017 Analisis adopsi program pengelolaan
tanaman terpadu (PTT) di Kabupaten Serdang Bedagai Prosiding Seminar Nasional
Agroinovasi Spesifik Lokasi Untuk Ketahanan Pangan Pada Era Masyarakat Ekonomi
ASEAN (Balai Besar Pengkajian dan Pengembangan Teknologi Pertanian) pp 390–7
[6] BPS Serdang Bedagai 2018 Kabupaten Serdang Bedagai Dalam Angka tahun 2018
[7] Singarimbun M and Effendi S 1987 Metode Pengkajian Survei (Jakarta: LP3ES(Lembaga
Pengkajian,Pendidikan dan Penerangan Ekonomi dan Sosial))
[8] Rosyidi M 2001 Analisis Pengaruh Faktor-Faktor Persepsi Konsumen Terhadap Perilaku
9IC-FSSAT 2021 IOP Publishing
IOP Conf. Series: Earth and Environmental Science 807 (2021) 032062 doi:10.1088/1755-1315/807/3/032062
Konsumen Dalam Proses Pengambilan Keputusan Pembelian Surat Kabar Di Wilayah
Kotamadya Surabaya
[9] Soekartawi 1995 Analisis Usahatani (Jakarta: UI-PRESS)
[10] Badan Litbang Pertanian 2013 Sistem Tanam Legowo Badan Penelit. dan Pengemb. Pertan.
Kementeri. Pertan.
[11] Zaini Z 2014 Evaluasi teknologi pemupukan spesifik lokasi (PHSL) dan sistem tanam legowo
4:1 dalam pola tanam padi-padi (Bogor: Puslibangtan.)
[12] Hasyim S and Fauzia L 2013 Analisis Faktor-faktor yang Mempengaruhi Produksi Padi Sawah
(Studi Kasus: Desa Medang, Kecamatan Medang Deras, Kabupaten Batu Bara) J. Agric.
Agribus. Socioecon. 2 15053
[13] BB Padi 2009 Pedoman umum peningkatan IPpadi 400, peningkatan produksi padi melalui
pelaksanaan IP padi 400 (Badan Litbang Pertanian)
[14] Supriatna A 2012 Meningkatkan indeks pertanaman padi sawah menuju IP padi 400 Agrin 16
[15] Gavagnin C, Zolin M B and Pastore A 2016 Vietnam’s Rice Price at the Intersection of
Globalisation and Climate Variability Copenhagen J. Asian Stud. 34 28–53
10You can also read