Une histoire d'énergie : équations et transition - Sustainable Energy, April 24th 2018 - Blogs ULg
←
→
Page content transcription
If your browser does not render page correctly, please read the page content below
Une histoire d’énergie :
  équations et transition

           Sustainable Energy, April 24th 2018

      Raphael Fonteneau, University of Liège, Belgium
                     @R_Fonteneau

Joint work with Pr Damien Ernst - thanks to many other people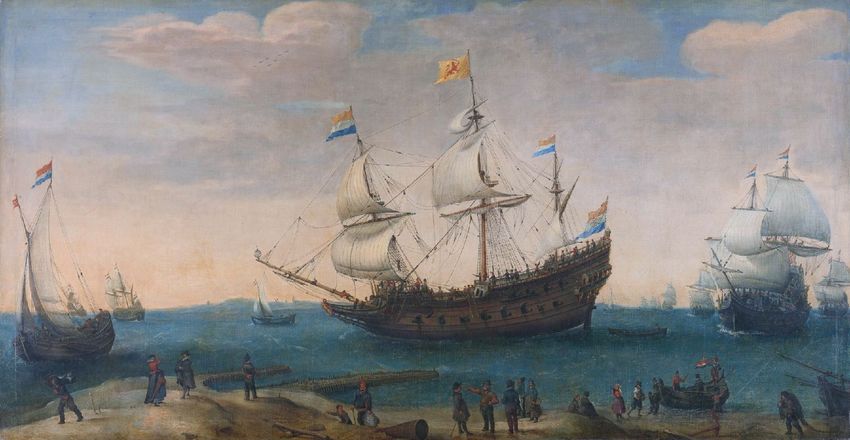
In the news

What does this mean
      to you?
Outline

Energy
Stories
           Modeling
              the
           Transition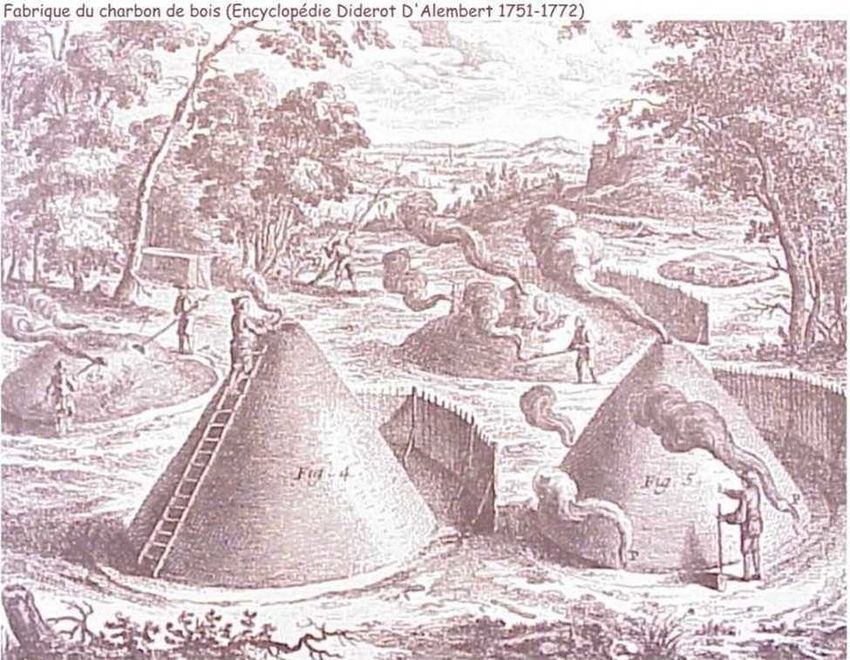
Energy stories
About 1 million years ago:
Fire domestication: lighting, heating, cooking
        ->improved health
                                         Chenspec via Wikipedia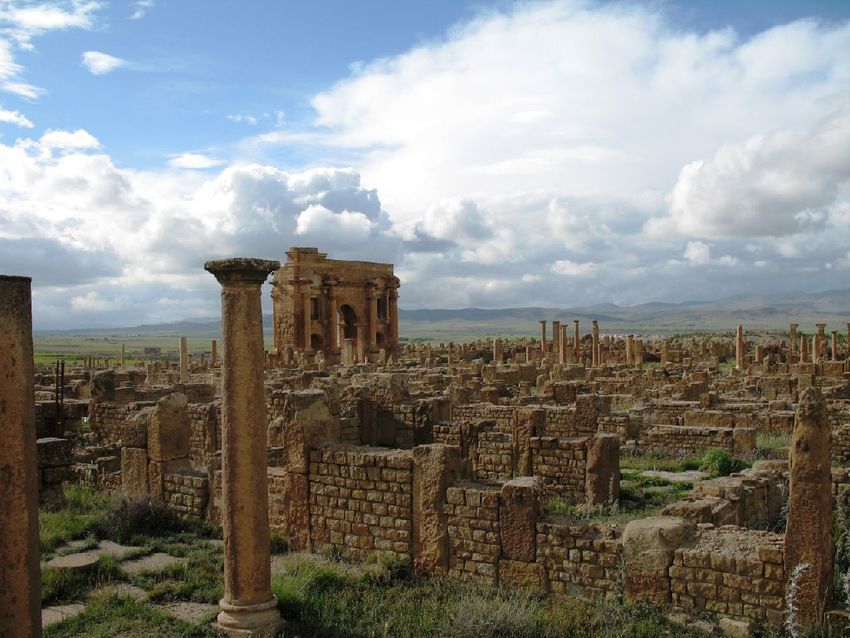
About 10 000 years ago:
        Agriculture: a ‘new’ way to ‘efficiently’ collect solar
        energy via photosynthesis

Inconnu via Wikipedia                 Mosaique du Grand Plalais, Constantinople via Wikipedia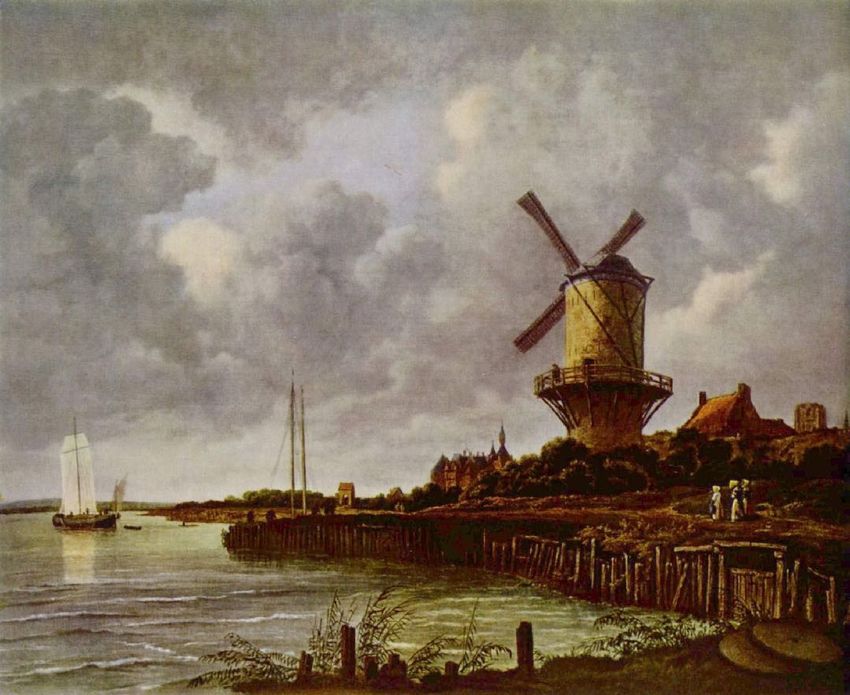
During the Roman Empire, agriculture provided food
to humans (some of them are slaves) and animals:
this was (almost) the only source of energy

                                           Fiesco via Wikipedia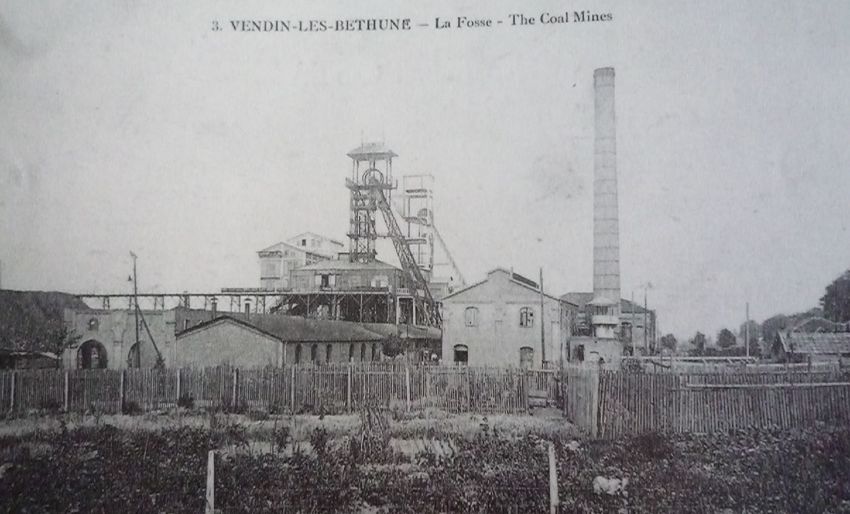
Well, the Romans used to have another source of energy…

                                           Andrei Nacu via Wikipedia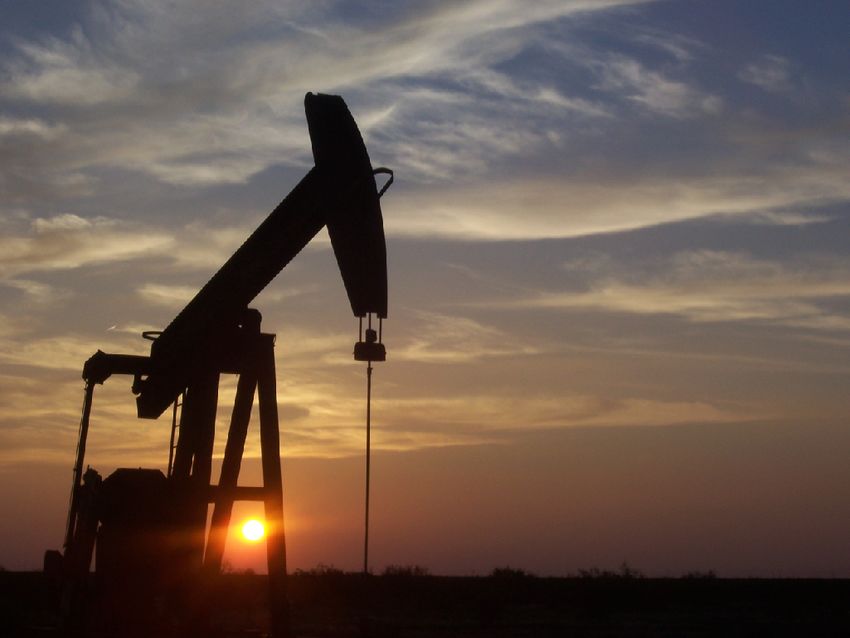
During the Middle Ages, mills are deployed in Europe
1 mill corresponds to (about) 40 men in terms of power
- European GDP*2 between 1000 and 1500
- « Only » 30% in Asia during the same period
                                        Jacob van Ruisdael via Wikipedia
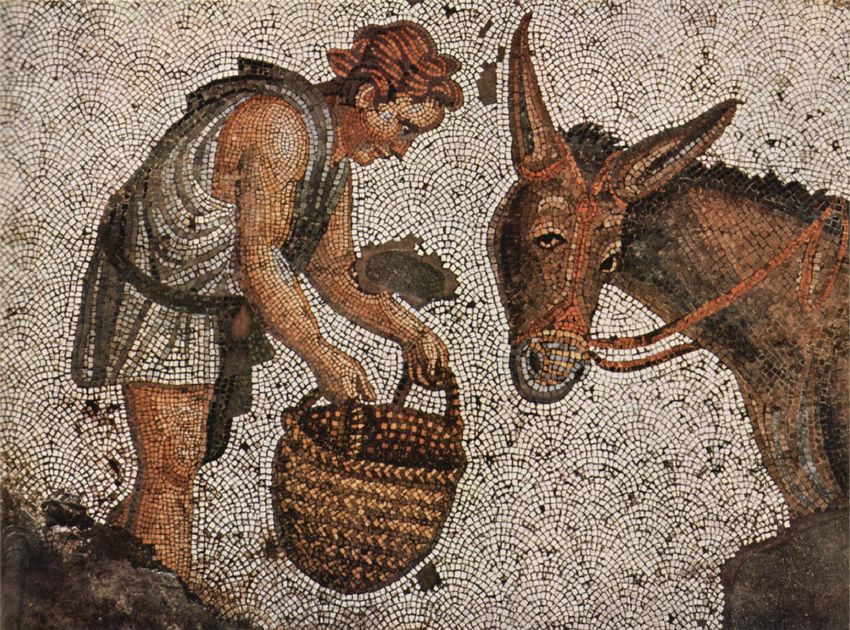
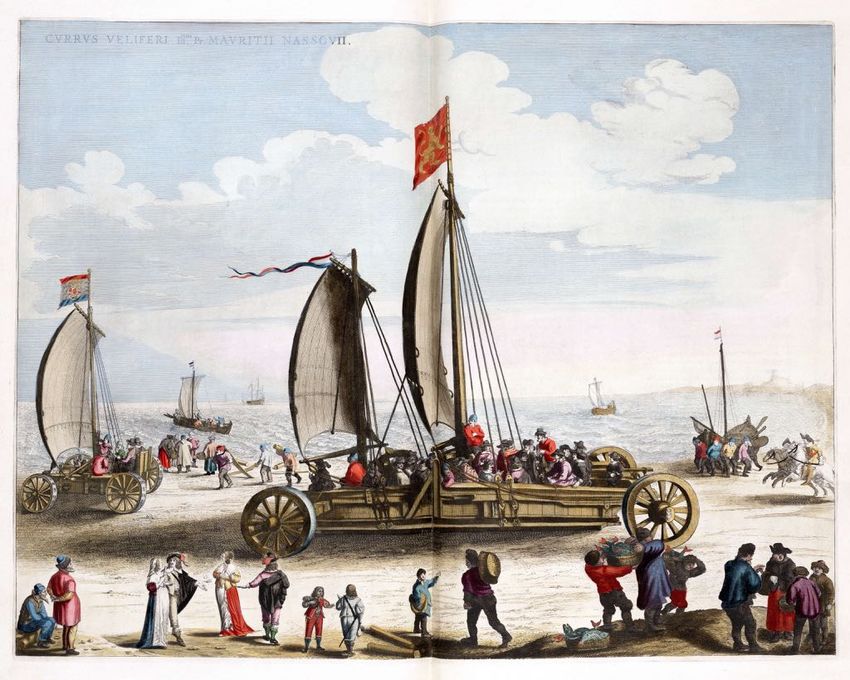
A famous example: the Dutch Golden Age (16th century)
- Efficient agriculture
- Peat
- Waterways
- Trade, city development
- Sawmills for boat construction

                                     Hendrick Cornelis Vroom via Wikipedia
« Een Wonder en is gheen wonder »
Simon Stevin
Jacques de Gheyn via WikipediaBefore using coal, 25 cubic meters of wood are needed
to produce 50 kg of iron
(in forty days, a forest is cleared on a radius of 1 km)
Diderot - D’Alembert via WikipediaIn the UK, wood shortage leads to the discovery of
the potential of coal
Coal made the massive development
of metallurgy possible, leading to new infrastructures
WikipediaAfter WW2, almost exponential growth of oil consumption
opens the so-called « consumer society » era
Hartmut Reiche via WikipediaIn Western Europe, almost 5% GDP growth per year during
30 years
« The Glorious Thirty » - « Les Trente Glorieuses »
-> 1973 Oil Crisis
-> In Europe, emergence of public debt and mass
unemployment
Eric Kounce via WikipediaTrajectories of Societies
Energy Society
Johanna Pung via WikipediaEnergy & GDP
• Recent research in Economics has shown that:
• The empirical elasticity (measured from time series among
OECD countries over the last 50 years) of the consumption of
primary energy into the GDP is about 60%, which is 10 times
higher that what is predicted by the « Cost Share Theorem »
Elasticity can be quantified as the ratio of the percentage change
in one variable to the percentage change in another variable
• There is a causality link between the consumption of primary
energy and the GDP in the direction Energy -> GDP
$€Energy & GDP Source: The Shift Project - JM Jancovici
PIB et barils sont dans un bateau…
                               Energy & GDP

       Variation lissée de la consommation mondiale de pétrole (rouge) et du PIB par
     personne (bleu). Source World Bank 2013 pour le PIB, BP Stat 2013 pour le pétrole

Source (in French): Jean-Marc Jancovici, « L’économie aurait-elle un vague rapport avec l’énergie? », LH Forum, 27 septembre 2013
Energy & GDP
A must read
The Challenge (1)

   Non renewable

> 80% - < 20%
                   Renewable
The Challenge (2)
Dematerialized economy does not exist on its own.
« You cannot compute food, and even if you could,
you would need an industry to build computers ».
D.R.Modeling the transition
ERoEI
•   ERoEI for « Energy Return over Energy Investment » (also
    called EROI) is the ratio of the amount of usable energy
    acquired from a particular energy resource to the amount of
    energy expended to obtain that energy resource:

                    U sable Acquired Energy
             EROI =
                       Energy Expended
•   The highest this ratio, the more energy a technology brings
    back to society

•   Notation : 1:X
D F I D - 5 9 7 1 7
st
Source: EROI of Global Energy Resources - Preliminary Status and Trends - Jessica Lambert, Charles Hall, Steve Balogh, Alex
Poisson,
Figureand7:Ajay
TheGupta
“NetState University
Energy Cliff”of New York,
(figure College of
adapted Environmental
from LambertScience and Forestry
and Lambert, Report 1 - Revised
in preparation [3] and
Submitted - 2 November 2012 DFID - 59717
Murphy et al. 2010 [71]) As EROI approaches 1:1 the ratio of the energy gained (dark gray) to the en-D F I D - 5 9 7 1 7
Source: EROIFigure
of Global Energy Resources
5: “Pyramid - Preliminary
of Energetic Status and Trends
Needs” representing - Jessica Lambert,
the minimum Charlesfor
EROI required Hall, Steve Balogh, Alex
conventional
Poisson, andoil,
AjayatGupta State University
the well-head, of New
to be able to York, College
perform of Environmental
various Science
energetic task andfor
required Forestry ReportThe
civilization. 1 - Revised
blue
Submitted - 2values
November 2012 DFID values:
are published - 59717 the yellow values are increasingly speculative (figure adapted froms in the order of hundreds of years:
Modeling the transition
T ⇠ 100 500
•A the
egarding discrete-time model of from
energy produced the deployment of
non-renewable sources
« renewable energy » production capacities
ch year, a quantity of non-renewable
• Budget of non-renewable energy
energy is available:
8t 2 {0, . . . , T 1}, Bt 0.
assume 9r 0, 9⌧a quantity
that>such R : 8t is
> 0, 9t0of2 energy 2 net
{0, (this
. . . , Tassumption
1}, is
he chapter). By renewable energy, we mean fossil (t tenergy
0) (coal,
also nuclear energy (Uranium Bfission). 1 e
For
⌧
clarity here, we
t = ⇣ ⌘2
r
rate the different types of energy production (t t
technologies 0 )
from
1+e ⌧
rces. The evolution of the quantity of available non-renewableof
yrgy energy
of from R :
energyrenewable
R :
n,t origin
n,t
NN},
},8t
8tModeling
2
2 {0,
{0, . .
. .
. .
, ,
T T 1}, the
1},
R
ume that a set of N differentn,t R n,t transition
0. 0.
technologies for producing energy
sources is available. To each technology is associated a producti
yusproducing
us a quantity
(non-comprehensively)
(non-comprehensively) of energy R
mention
mention
• Set of renewable energy productionn,t:biomass, hydro-
biomass, hydro-
technologies:
photovoltaic
hotovoltaic panels.
panels.Two Twomain parameters,
main parameters,the ex-
the ex-
8neach
2 {1,
f the deployment
aracterize of .these
. of }, 8t 2production
. , Nenergy {0, . . . , T means
technologies: 1}, Rn,tis modeled
0.
racterize each of these technologies:
r:
}, 8t•technologies,
Nthese 2Characteristics
{0, . . . , T let1}, n,t 0.
us (non-comprehensively) mention biomas
}, 8t 2
. , N },
1,ty,. .wind
{0, . .
turbines .
8t 2 {0,
, T 1},
or .photovoltaic
. . , T n,t
1}, panels.
R
0. Two
= main
(1 + ↵ parameters
ERoEIn,t 0. n,t+1 n,t )Rn,t
ifetime and ERoEI characterize ERoEI each 0. technologies:
n,t of these
rgy production means is modeled using a
vided •inDeployment
wth parameter section 2. may The be expected
negative:
strategy lifetime parameter
8n 2 {1, . . . , N }, 8t 2 {0, . . . , T 1}, n,t 0.
ded in section
of equipment 2. The
allowing expected
energy lifetime
production. Noteparameter
that
ERoEI n,t 0.
of 2 equipment
Tsider {1,
1}, , N },allowing
fluctuation
. .R.n,t+1 =8t (12+
and {0,
storage
↵energy
n,t . issues
. . )R ↵n,t 2 Note
associated
, Tn,tproduction.
1}, [ 1, 1[
with that
nider
practice, providing
fluctuation andstorage
storage capacities
issues or technolo- with
associated
ion of ERoEI is provided in section 2. The expected lifetime pchnologies:
.nt. .becomes
, T8n 21},
{1, . . ,2
↵.n,t
obsolete 1, 1[
N [},and
8t has
2 {0,to. .be
. , Treplaced
1}, M(see later
0 in the
n,t
ptions regarding this energy cost).
3.5 Energy costs for growth and long-term replacement
. . . , N }, 8t 2 {0, . . . , T 1}, Cn,t (Rn,t , ↵n,t ) 0
erm
We
Modeling the transition
f this quantity of energy is to formalize the energy cost that has
replacement
equipment
introduce becomes
the energy obsolete and has to with
cost associated be replaced
the growth (seeoflater
the ip
ndis
ew net
cost energy
also
assumptions
ties of• renewable to society
incorporates
regarding
technologies: theenergy
this energy cost).required for maintenan
Energy costs for growth and long-term replacement
of thethe
with equipment.
growth ofWe the also introduce
production capaci-the energy cost associat
notations, we
placement of define
8n the
2 {1, .the
. . ,total
production N }, energy
means:
8t 2 {0, produced
. . . , T at1}, year
Cn,tt: (Rn,t , ↵n
nergy and net energy to society
XN
2
,
We T{1, 1},
.
assume . . C
, Nn,t},
(R
that 8t n,t
this2 , {0,
↵ .
n,t
cost )
. . ,
also T0 1},
incorporatesM n,t the 0energy required
8t 2 {0, . . . , T 1}, Et = Bt + Rn,t
previous
during the notations,
lifetimewe of define the total energy
the equipment. We alsoproduced
introduce at year
the t:
ener
n=1
ates
antity •
the Total
of energy
energy
energy is and
required
to net
for energy
formalize
to the long-term replacement of the production to
maintenance
the society
energy cost means:that has to
X N
enet
entalso introduce
becomes
energy available the
obsolete energy
to and
society: cost
has associated
to be replaced (see later in t
8t 2 {0, . . . , T 1}, Et = Bt + Rn,t
uction means:
mptions regarding 8nthis2 {1, energy }, 8t 2 {0, . . . , T 1}, Mn,t
. . . , Ncost).
N
n=1 !
X
{0,
.The
, T. .role
. ,1},
T ofStthis
1},
= M
E t n,t
quantity 0 of C (R
energy
n,t n,tis, ↵
to ) + M
formalize
n,t n,t the energy c
fine the net energy available to society:
paid when equipment becomes n=1 obsolete and has to be replace3.7 Constraints on the quantity of energy invested for energy
e quantity of energy invested for energy production
Modeling the transition
We assume that the energy investment for developing, maintai
the production means from renewable sources cannot exceeds
nergy investment for developing, maintaining and replacing
the total energy. In other words, this assumption means that the
from
societyrenewable sources
over total energy cannot exceeds
has to remain a
abovegiven fraction
a given of
• Constraint on the quantity of energy invested forthreshold
her
sumewords,
that: this production
energy assumption means that the ratio net energy to
gy has to remain above a given threshold. Formally, we as-
8t 2 {0, . . . , T 1}, 9 t : Cn,t (Rn,t , ↵n,t ) + Mn,t
1
.,T 1}, 9 t : Cn,t (Rn,t , ↵n,t ) + Mn,t Et
In the following, we denote by “energy threshold” t such a par
straint is motivated by research investigation showing that, if
too highby
denote proportion
“energy ofthreshold”
its energy such
for producing energy,
a parameter. then
This less
con-
yedresearch
to other investigation
society needs,showing
which maythat,result
if a into a decrease
society invests of
a
welfare [Lambert
its energy et al. (2012)].
for producing energy, then less energy is dedicat-⇢
n,t ↵n,t Rn,tif ↵n,t 0
Cn,t (Rn,t , ↵n,t ) =
0 else
Modeling the transition
costs allowing a given production capacity producing energy
fetime• is done assumptions
Further initially. This results into the following equa-
• Energy cost for growthn,t
is proportional to growth, and
8t 2 {0, . . . , done
T 1}, n,t =
initially:
2 {0, . . . , T 1}, 9µ > 0 : M (R ) = µ R
n,t ERoEI
n,t
n,t n,t n,t n,t
n,t
Cn,t (Rn,t , ↵n,t ) = ↵n,t Rn,t if ↵n,t 0
EI parameter, we get the following
ERoEIequations:
n,t
cost associated with the long-term 1
replacement of production
N }, 8t 2 {0, . . . , T 1},
• Long-term µn,t = cost is (i) proportional
replacement and (ii)
(i) annualized
annualized ERoEI
and (ii) proportional to the n,t
quantity of energy
uced: 1
Mn,t (Rn,t ) = Rn,t
ERoEIn,tic panelsrenewable
between in the worst
and case configura-energy pro-
non-renewable
dhevariables
mbertdepletion
et al. of non-renewable
with
(2010)]respect
which to the energy
total
provides two is initially
energy at 1.4 1.8
12)]:
s the current situation
Energy for energy Energy for energy
andofnon-renewable
2014 [British Petroleum Energy to society Energy to society
etween renewable energy pro- 1.2
Total energy
Renewable
1.6 Total energy
Renewable
PV Non−renewable Non−renewable
I1,t
E=
the 0 ERoEI
current
= 1 min = 6 of 2014 [British Petroleum
situation 1
1.4
1.2
aic Bpanels in the worst case configura-
0 = 0.85E0
Normalized energy
Normalized energy
0.8
c012)]:
panels in of
depletion thenon-renewable
best case configuration
energy is initially
1
0.8
eenB = 0.85E0and
by0renewable non-renewable energy topro-
0.6
ed photovoltaic P panels
V is initially assumed be
EI
e 1,t = ERoEI
current situation =6
P Vmin of 2014 [British Petroleum
0.4
0.6
nergy mix:
I1,t = ERoEImax = 12 0.4
d by photovoltaic panels is initially assumed to be 0.2
0.2
aic
ergy Rpanels
mix:
1,0 in the0best case configuration
= 0.01E
he average of these two values, 9i.e.: 0
0 50 100 150 200 250 300 350
0
0 50 100 150 200 250 300 350 400 450
B]:0 = 0.85E0 9
Time t Time t
R1,0corresponds
ately = 0.01EP0 to V the current proportion of ener-
EIX ERoEI
N
1,t = ERoEI
1,t = 9 max = 12
Fig. 2. Scenario “peak at time t=0” Fig. 3. Scenario “plateau at time t=0”
=ypanels plus=wind
photovoltaic
RNn,0 turbines
panels
0.14E 0
is in the world
initially total energy
assumed to be
ies
ately
y mix:
n=2 X
producing
corresponds energy to from
the renewable
current sources
proportion of are
ener-
esthe of PV panels
average of is still
these twodiscussed
values, in the
i.e.:
el,=
panelsi.e.: R
plusthat
wind = 0.14E
n,0 turbines 0
1.6 2
(ii) it is veryinlikely
the world
that total energy
,t Energy for energy Energy for energy
12)]), and Energy to society
Total energy 1.8
Energy to society
Total energy
Rest1,0
may = be
producing
n=2 dedicated
0.01E 0 energyto growing
from en-
renewable
1.4
sources are Renewable
Non−renewable
Renewable
Non−renewable
uture. In
}, ERoEI1,t = 9 all configurations considered 1.2
1.6
el, i.e.: parameter equal to 20:
lifetime
1.4
1
that may be dedicated to growing
proportionen-
Normalized energy
Normalized energy
y tcorresponds
= 14 to the current of ener- 1.2
ues of PV panels is still discussed in the 0.8 1
1},
nels plus 1,t = 20 turbines in the world total energy
wind
2012)]), and that (ii) it is very likely that 0.6
0.8
producing energy fromreported
renewable sources are
eldfuture.
is motivated by results 0.6
In all configurations considered0.4
.e.:
a},lifetime
own tby=Lambert
14 et al., this value 0.4
parameter equal to 20: 0.2
evelop and sustain social amenities 0.2
0 0
ociety Maslow
Constant pyramid”, such as
growth 0 50 100 150 200 250 300 350 0 50 100 150 200 250 300 350 400 450
1}, is
hold = 20
1,tmotivated
Time t Time t
“Pyramid else by
of Energetic
if possible, results
Needs” in reported
shown by Lambert
max admissible Fig.et4. al., this“peak
Scenario value
at time t=20” Fig. 5. Scenario “plateau at time t=20”12
Modeling the transition
Increasing
of the •renewable theproduction
energy ERoEI parameter
capacities is boosted by the availability of
non-renewable resources. 1.4
Energy for energy
As a second observation, we notice that the depletion scenario has an influence Energy to society
Total energy
1.2 Renewable
on the maximal level of production that can be reached during the transition phase. Non−renewable
However, one can compute that it does not affect the steady-state production level,
1
which is exactly the same in the four scenarios, and function of the ERoEI of the
Normalized energy
0.8
photovoltaic panels.
0.6
To illustrate the influence of the ERoEI parameter on the levels of energy produc-
tion, we give in Figure 8 a last run of MODERN for which we consider a linear
0.4
increase of the ERoEI parameter from 9 to 12 between time 0 and the time horizon
0.2
(the growth scenario is the same as before, 10% annual growth):
0
0 50 100 150 200 250
Time t
t
8t 2 {0, . . . , T 1}, ERoEI1,t = 9 + (12 9)
TSo?
A few suggestions
•   What kind of decisions can be suggested by such a
    « rough model »?

      •   Price may not always be a good indicator

      •   Pay attention to the ERoEI

      •   Energy efficiency: « do better with less »

•   The energy transition is a global process: how to prioritize
    actions?

      •   Back to Maslow
Epilogue
During the collapse of the Roman Empire, the quality of the
food (measured from bones) improved (this may be explained
by the fact that the pressure of the Empire on agriculture
decreased with the collapse)

 This is an example of « good news » that may come with the
           switch from a society model to another…

    … and I believe this will be the case for the energy
                         transition

                                                   PhR61via Wikipedia
References [1] Wikipedia, Feu, Domestication par l'Homme [2] Auzanneau, M. (2011). L’empire romain et la société d’opulence énergétique : un parallèle via lemonde.fr [3] Tainter, J. (1990). The Collapse of Complex Societies. [4] Gimel, J. - The Medieval Machine : the industrial Revolution of the Middle Ages, Penguin Books, 1976 (ISBN 978-0-7088-1546-5) [5] Maddison, A. « When and Why did the West get Richer than the Rest ? » [6] Wikipedia, Dutch Golden Age, Causes of the Golden Age [7] Wikipedia, Histoire de la production de l'acier [8] Wikipedia, Houille [9] Giraud, G. & Kahraman, Z. (2014). On the Output Elasticity of Primary Energy in OECD countries (1970-2012). Center for European Studies, Working Paper. [10] Stern, D.I. (2011). From correlation to Granger causality. Crawford School Research Papers. Crawford School Research Paper No 13. [11] Stern, D.I. & Enflo, K. (2013). Causality Between Energy and Output in the Long-Run. Energy Economics, 2013 - Elsevier. [12] Auzanneau, M. (2014). Gaël Giraud, du CNRS : « Le vrai rôle de l’énergie va obliger les économistes à changer de dogme » via lemonde.fr [13] Jancovici, J.M. (2013). Transition énergétique pour tous ! ce que les politiques n'osent pas vous dire, Éditions Odile Jacob, avril 2013. See also J.M. Jancovici's website. [14] Meilhan, N. (2014). Comprendre ce qui cloche avec l'énergie (et la croissance économique) en 7 slides et 3 minutes. [15] Wikipedia, Decline of the Roman Empire [16] Lambert, J., Hall, C., Balogh, S., Poisson, A. and Gupta, A. (2012). EROI of Global Energy Resources - Preliminary Status and Trends - J State University of New York, College of Environmental Science and Forestry Report 1 - Revised Submitted - 2 November 2012 DFID - 59717 [17] Jancovici, J.M. « L’économie aurait-elle un vague rapport avec l’énergie? »(2013), LH Forum, 27 septembre 2013 [18] Fonteneau, R. and Ernst, D. On the Dynamics of the Deployment of Renewable Energy Production Capacities. Mathematical Advances Towards Sustainable Environmental Systems, pp 43-60, 2017. [19] Kümmel, R., Ayres, R.U. and Linderberger, D. (2010).Thermodynamic Laws, Economic Methods and the Productive Power of Energy. Journal of Non-Equilibrium Thermodynamics, in press [20] Gemine, Q., Ernst, D. and Cornelusse, B. (2015). Active network management for electrical distribution systems: problem formulation and benchmark. In press
You can also read