High Quality and Low Cost - The Toyota Production System
←
→
Page content transcription
If your browser does not render page correctly, please read the page content below
The Toyota Production System

High Quality and Low Cost
                                                        COST VS
                                                        DEFECTS

Readings;
James Womack, Daniel T. Jones and Daniel Roos,
 The Machine that Changed the World, 1990, Ch 3 and 4
Kenneth N. McKay, “The Evolution of Manufacturing Control-
What Has Been, What Will Be” Working Paper 03 –2001
Michael McCoby, “Is There a Best Way to Build a Car?”
HBR Nov-Dec 1997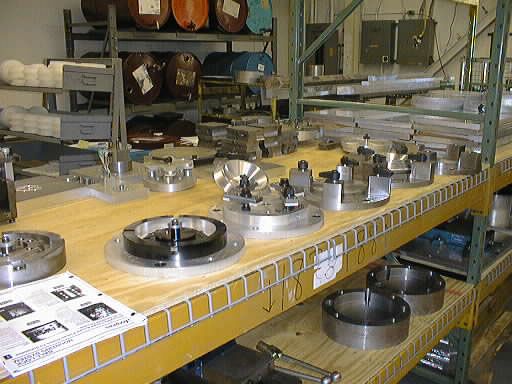
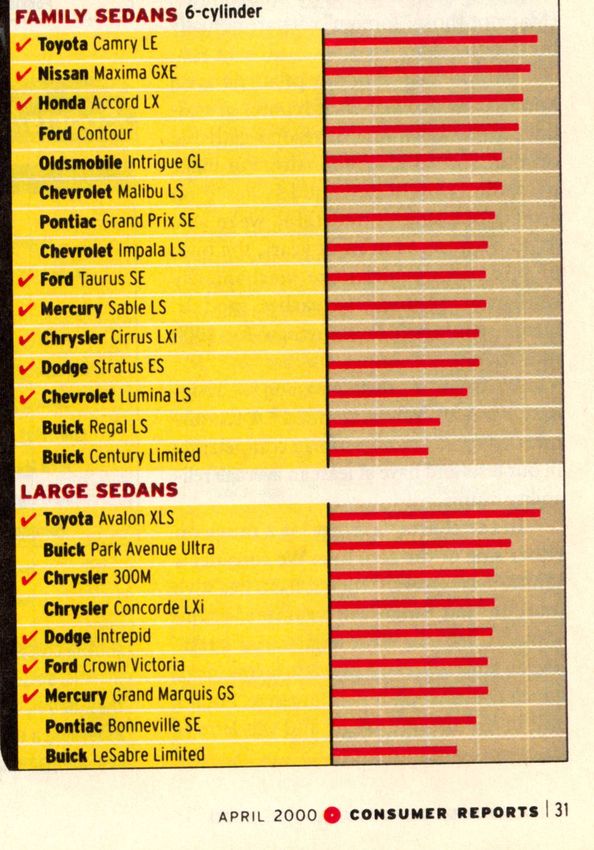
Consumer Reports
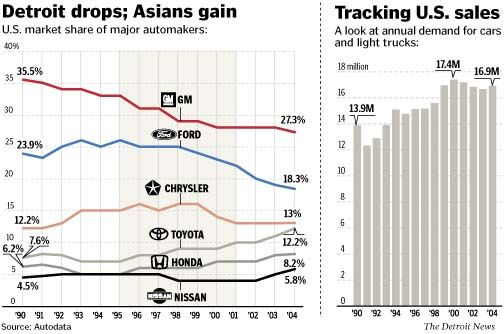
Gains of imports
The Toyota Production System Historical View Performance measures Elements of TPS Difficulties with Implementation Six Eras of Manufacturing Practice
Three Major Mfg Systems
                   from 1800 to 2000

Machine tools, specialized machine tools, Taylorism, SPC, CNC, CAD/CAM

     1800                        1900                        2000

   Interchangeable             Mass                 Toyota
   Parts at U.S.               Production           Production
   Armories                    at Ford              System
Key Elements for New Mfg Systems
Element/ Need of Work Enabling Leader Resources
System Society Force Technology
Motivation
Interchange- Military “Yankee Machine Roswell U.S.
able Parts Ingenuity” Tools, Lee/ Govt
Division of John
Labor Hall
Mass Trans- $5/day Moving Henry Earnings
Production portation Immigrant Assembly Ford
Line,etc
Toyota Post War Jobs, CNC, Taiichi Japanese
Production Security Integration Ohno Banks
System of LaborQ. By what method did these
new systems come about?
A. Trial and ErrorHistory of the Development of the Toyota Production System ref; Taiichi Ohno 1945 1975
The Toyota Production System Historical View Performance measures Elements of TPS Difficulties with Implementation Six Eras of Manufacturing Practice
Summary of Assembly Plant Characteristics, Volume Producers,
                           1989
            (Average for Plants in Each Region)
                                      Japanese        Japanese    in     American in       All    Europe
                                      in    Japan     North   America    North   America
      Performance:
      Producvitity (hours/Veh.)            16.8            21.2               25.1               36.2
      Quality (assembly
      defects/100 vehicles)                 60              65                82.3                97

      Layout:
      Space (sq.ft./vehicle/yr)             5.7            9.1                 7.8                7.8
      Size of Repair Area (as %
      of assembly space)                    4.1            4.9                12.9               14.4
      Inventories(days for 8
      sample parts)                         0.2            1.6                 2.9                2

      Work Force:
      % of Work Force in Teams             69.3            71.3               17.3                0.6
      Job Rotation (0 = none,
      4 = frequent)                         3              2.7                0.9                1.9
      Suggestions/Employee                 61.6            1.4                0.4                0.4
      Number of Job Classes                11.9            8.7                67.1               14.8
      Training of New Production
      Workers (hours)                      380.3           370                46.4               173.3
      Absenteeism                            5             4.8                11.7               12.1

      Automation:
      Welding (% of direct steps)          86.2             85                76.2               76.6
      Painting(% of direct steps)          54.6            40.7               33.6               38.2
      Assembly(% of direct steps)          1.7             1.1                1.2                3.1

      Source: IMVP World Assembly Plant Survey, 1989, and J. D. Power Initial Quality Survery, 1989
Cost Vs Defects Ref. “Machine that Changed the World” Womack, Jones and Roos
Cost Vs Automation
Ref. “Machine that Changed the World” Womack, Jones and Roos
The Toyota Production System Historical View Performance measures Elements of TPS Difficulties with Implementation Six Eras of Manufacturing Practice
How do you get this kind of
performance?
Womack, Jones and Roos
J T. Black’s 10 Steps
Demand Flow Technology’s 9 PointsWomack Jones and Roos
• New Technology?
– No silver bullet
• Automation?
– Yes, but integrated with system
• Standardized Production?
– Not in the usual “don’t stop the line” sense
• Lean Characteristics?
– Integration of Tasks (opposite of deskilling)
– Identification and removal of defects (stop the line!)
– kaizen – institutionalizing changeJ T. Black’s 10 Steps
Ref; JT. Black “Factory with a Future” 1991
1. Form cells
2. Reduce setup
3. Integrate quality control
4. Integrate preventive maintenance
5. Level and balance
6. Link cells – KANBAN
7. Reduce WIP
8. Build vendor programs
9. Automate
10. ComputerizeDemand Flow Technology’s
9 Points
1. Product Synchronization
2. Mixed Model Process Maps
3. Sequence of Events
4. Demand at Capacity
5. Operational Cycle Time
6. Total Product Cycle Time
7. Line Balancing
8. Kanbans
9. Operational Method SheetsCurrent Value Stream Map
Future Value Stream Map
J T. Black –1, 2
1. Form Cells               2. Reduce Setup
   Sequential                   Externalize setup to
   operations, decouple         reduce down-time
   operator from                during changeover,
   machine, parts in            increases flexibility
   families, single piece
   flow within cell
Toyota Cell, one part is produced
             for every trip around the cell
                                            TPS Cell

J T. Black
Standardized Fixtures
J T. Black – 3, 4
3. Integrate quality       4. Integrate preventive
   control                   maintenance
   Check part quality at     worker maintains
   cell, poke-yoke, stop     machine , runs slower
   production when
   parts are bad
J T. Black – 5, 6
5. Level and balance    6. Link cells- Kanban
   Produce to Takt          Create “pull” system
   time, reduce batch       – “Supermarket”
   sizes, smooth            System
   production flow
Balancing and Leveling
• Balanced line: each process has the same
  cycle time. Match process time to
  assemble time, match production rate to
  rate of demand (Takt time)
• Leveled Line: each product is produced in
  the needed distribution. The process must
  be flexible to do this.
J T. Black – 7, 8
7. Reduce WIP              8. Build Vendor
   Make system reliable,     program
   build in mechanisms       Propagate low WIP
   to self correct           policy to your
                             vendors, reduce
                             vendors, make on-
                             time performance part
                             of expectation
Some Basics Concepts of TPS Smooth Flow and Produce to Takt Time Produce to Order Make system “observable” and correct problems as they occur Integrate Worker Skills Institutionalize change
Two Examples; Takt Time Pull Systems
Takt Time:
    demand time interval
             Available Time
Takt Time =
            Product Demand
     Calculate Takt Time per month, day,
     year etc. Available time includes all
     shifts, and excludes all non-
     productive time (e.g. lunch, clean-up
     etc). Product demand includes over-
     production for low yields etc.
Takt Time Automobile Assembly Line; Available time = 7.5 hr X 3 shifts = 22.5 hrs or 1350 minutes per day. Demand = 1600 cars per day. Takt Time = 51 sec Aircraft Engine Assembly Line; 500 engines per year. 2 shifts X 7 hrs => 14 hrs/day X 250 day/year = 3500hrs. Takt time = 7 hrs.
Engines shipped over a 3 month period
     at aircraft engine factory “B”

                                 12
                                              month 1                            month 2                              month 3

                                 10
      engines shipped per week

                                 8

                                 6

                                 4

                                 2

                                 0
                                      7-Jun   15-Jun   23-Jun   30-Jun   7-Jul   15-Jul   24-Jul   31-Jul   7-Aug   15-Aug   24-Aug   31-Aug

                                                                                 Weeks
Engines shipped over a 3 month period
at aircraft engine factory “C”
7
6
shipped
5
4
engines
3
2
1
0
may june july august
weeksOn-time performance of engine
plants
100%
80%
late
delivered
late
60%
on
time
engines
40%
on
time
20% on
time
0%
A B CPush and Pull Systems
Machines
1 2 3 4
Parts OrdersPush Systems –
Order (from centralized decision process) arrives at the front of the
system and is produced in batches of size “B”.
Q. How long does it take to get one part out of the system?
1 2 3 ….. N
Time = 0
Time = T1
Time = T2
Time = T3
Time = TNPush Systems –
Comment; Of course, this
1 2 3 ….. N part can come from inventory
in a much shorter time, but the
Time = 0 point is that the push system
is not very responsive.
Time
= TNPull Systems-
The order arrives at the end of the line and is “pulled” out of the
system. WIP between the machines allows quick completion.
Q.How long does it take to pull out
one part?
A.The time to finish the last opetration “t”.Comparison between
Push and Pull Systems
Push system characteristics: Central
decision making, local optimization of
equipment utilization leads to large
batches, large inventories and a sluggish
system.
Pull system characteristics: Local decision
making, emphasis on smooth flow,
cooperative problem solving.
See HP VideoHP Video
Dots Tacks Tape Pack
Inventory in the system = L
Time in the system = W
Little’s Law L = λ WHP Video Results
Push system (6) Pull (3) Pull (1)
Space 2 Tables 2 Tables 1 Table
WIP = L 30 12 4
“Cycle time” = W 3:17 1:40 0:19
Rework Units ≈
26 10 3
WIP
Quality Problem Hidden Visible Visible
Production Rate
0.15 0.12 0.21
λ=L/WGraphical Interpretation
250
200
Number or Time [s]
150
100
50
0
0 2 4 6
Inventory, L
Batch Size "B"
Time in System, W
L = λW
L ≈ k1B
λ = L / W = k1 / k2
W ≈ k2BSo what are the advantages of
the pull systems?
• quick response
• low inventories
• observable problems
(if stopped = problem)
• sensitive to state of the factory
(if no part = problem)
• possible cooperative problem solvingThe Toyota Production System Historical View Performance measures Elements of TPS Difficulties with Implementation Six Eras of Manufacturing Practice
TPS Implementation

• Physical part (machine placement,
  standard work etc)
• Work practices and people issues
• Supply-chain part
• Corporate Strategy (trust, job security)
Work practices and people
            issues
• Failed TPS attempts; GM Linden NJ,
 CAMI, GM-Suzuki, Ontario Canada.
• Successes GM NUMMI, Saturn. Toyota
 Georgetown, KY
Work practices and people
issuesExamples of “Innovative” Work
Practices
• Work Teams
• Gain Sharing
• Flexible Job Assignments
• Employment Security
• Improved Communications“What Works at Work: Overview
and Assessment”,
• Conclusion 1; “Bundling”
Innovative human resource management
practices can improve business productivity,
primarily through the use of systems of related
work practices designed to enhance worker
participation and flexibility in the design of work
and decentralization of managerial tasks and
responsibilities.“What Works at Work: Overview
and Assessment”,
• Conclusion 2; “Impact”
New Systems of participatory work
practices have large economically
important effects on the performance of
the businesses that adopt the new
practices.“What Works at Work: Overview
and Assessment”,
• Conclusion 3; “Partial Implementation”
A majority of contemporary U.S. businesses now
have adopted some forms of innovative work practices
aimed at enhancing employee participation such as work
teams, contingent pay-for-performance compensation, or
flexible assignment of multiskilled employees. Only a
small percentage of businesses, however, have adopted
a full system of innovative work practices composed of
an extensive set of these work practice innovations.“What Works at Work: Overview
and Assessment”,
• Conclusion 4; “Barriers to Implementation”
The diffusion of new workplace innovations is limited,
especially among older U.S. businesses. Firms face a number of
obstacles when changing from a system of traditional work practices
to a system of innovative practices, including: the abandonment of
organization change initiatives after limited policy changes have little
effect on performance, the costs of other organizational practices
that are needed to make new work practices effective, long histories
of labor-management conflict and mistrust, resistance of supervisors
and other workers who might not fare as well under the newer
practices, and the lack of a supportive institutional and public policy
environment.Barriers to Implementation • Early abandonment • Costs (training, commitment, benefits..) • History of conflict and distrust • Resistance of supervisors • Lack of supportive infrastructure
The Toyota Production System Historical View Performance measures Elements of TPS Difficulties with Implementation Six Eras of Manufacturing Practice
Six Eras of Manufacturing
Practice, Ken McKay
Pioneering
Systemization
Technology and Process
Internal Efficiency
Customer Service
Systems Level Re-engineeringKen McKay – 1, 2
1. Pioneering - sellers 2. Systemization - firm
grows and system gets
market, competition is complex, gross
not by manufacturing, inefficiency becomes
large margins apparent, competition
emphasize begins to make its
presence felt. Need for
throughput not standard operating
efficiency procedures, demand still
high, inventory used to
buffer against instabilities.Ken McKay – 3, 4
• 3. Technology and 4. Internal Efficiency -
Process – competition is competition “cherry pickers”
increasing, sales are enter the market they don’t
offer all of the options and
softening, manufacturing parts service but focus on the
is still in early maturity 20% which yields 80% of the
and competition is limited revenue stream. Internal plant
to firms in similar is put into order, problems are
situation. Product options pushed outside to suppliers,
best in class, bench marking
grow. Mfg focus shifts to identifies the silver bullet. Still
efficiency. using inventory to cushion
production support variety, and
maintain functional features.Ken McKay- 5, 6
5. Customer Service - 6. System Level Re-
talk to the engineering - firms
have addressed the
customer, identify
internal system and
core competency, factory – no more to
outsource, be squeeze out – look to
responsive, reduce improving indirect and
lead time, eliminate overhead, supply chain
feature creep, development.
focused factory etc.Toyota Summary
• High quality and low cost
• Relationship to previous systems (see
McKay paper), yet new,………. in fact
revolutionary
• Many elements
– Overall, see ”The Machine that Changed the
World”
– Cells, next time
– People, see Maccoby ArticleSummary …….. continued • “Autonomation” automation with a human touch • Worker as problem solver • TRUST
You can also read