Calibrated Phase-Shifting Digital Holographic Microscope Using a Sampling Moiré Technique - MDPI
←
→
Page content transcription
If your browser does not render page correctly, please read the page content below
applied
           sciences
Article
Calibrated Phase-Shifting Digital Holographic
Microscope Using a Sampling Moiré Technique
Peng Xia *    ID
                   , Qinghua Wang, Shien Ri and Hiroshi Tsuda    ID

 Research Institute for Measurement and Analytical Instrumentation, National Metrology Institute of Japan,
 National Institute of Advanced Industrial Science and Technology (AIST), Tsukuba, Ibaraki 305-8568, Japan;
 wang.qinghua@aist.go.jp (Q.W.); ri-shien@aist.go.jp (S.R.); hiroshi-tsuda@aist.go.jp (H.T.)
 * Correspondence: p.xia@aist.go.jp; Tel.: +81-029-861-4725

 Received: 31 March 2018; Accepted: 27 April 2018; Published: 3 May 2018

 Abstract: A calibrated phase-shifting digital holographic microscope system capable of improving
 the quality of reconstructed images is proposed. Phase-shifting errors are introduced in phase-shifted
 holograms for numerous reasons, such as the non-linearity of piezoelectric transducers (PZTs),
 wavelength fluctuations in lasers, and environmental disturbances, leading to poor-quality
 reconstructions. In our system, in addition to the camera used to record object information, an
 extra camera is used to record interferograms, which are used to analyze phase-shifting errors using
 a sampling Moiré technique. The quality of the reconstructed object images can be improved by
 the phase-shifting error compensation algorithm. Both the numerical simulation and experiment
 demonstrate the effectiveness of the proposed system.

 Keywords: digital holography; microscope; phase-shifting; Moiré technique

1. Introduction
      It is arduous to measure three-dimensional (3-D) objects via conventional optical microscopy due
to the finite focal depth of an imaging lens. Although confocal laser scanning microscopy (CLSM),
which can achieve high-precision 3-D measurement, has been developed, it cannot be used to measure
a fast and dynamic object owing to its long scanning time. Digital holographic microscopes [1–6] can
capture the 3-D information of an object without depth scanning and can focus at arbitrary depths.
They can also obtain both intensity and phase information from holograms and thus can measure
materials that are mostly transparent, such as biological cells and glass. Thanks to these advantages,
the digital holographic microscope has been widely used.
      The recording method of digital holographic microscopes is the same as that of digital holography.
It is grossly divided into two groups: in-line [7,8] and off-axis [9] recording methods, which depend
on the angle between the object wave and the reference wave received by the image sensor. In the
off-axis recording method, the spatial-frequency spectra of an object and the 0th-order diffracted
wave are not easily separated when large objects are recorded and reconstructed [10]. Therefore, the
in-line digital holography using phase-shifting calculation is much more efficacious than the off-axis
method. In general, a phase-shifting device such as a mirror mounted on a piezoelectric transducer
(PZT) is applied to shift the phase of the reference wave to record multiple phase-shifted holograms
for the phase-shifting calculation [11]. However, phase-shifting errors occur due to environmental
disturbances, the non-linearity of the PZT, frame loss in the camera, and the wavelength fluctuation of
lasers. Numerous methods have been proposed to solve this problem, such as a closed loop phase
control system using a single photodiode [12], an algorithm using a random phase-shifting method [13],
and self-calibrating algorithms utilizing a statistical method [14]. However, these techniques suffer
from certain disadvantages. For example, the output power fluctuation of a laser reduces the detecting

Appl. Sci. 2018, 8, 706; doi:10.3390/app8050706                                 www.mdpi.com/journal/applsci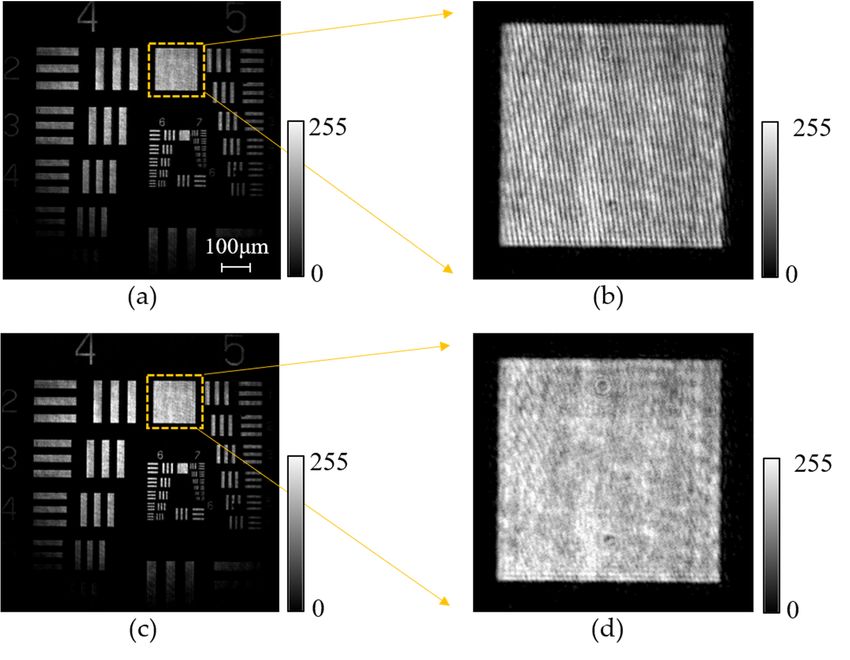
Appl. Sci. 2018, 8, 706 2 of 10
precision of phase-shifting errors in the closed loop phase control system. It also dramatically influences
the quality of the reconstructed image in the random phase-shifting method. The self-calibrating
algorithms are powerless for measuring objects that are mostly transparent because the object must be
assumed as sufficiently random in the diffraction field.
Hence, we propose a calibrated phase-shifting digital holography (CPSDH) system that is able
to improve the quality of reconstructed images by detecting phase-shifting errors using a sampling
Moiré method. The effectiveness of this technique was demonstrated with respect to a reflective
object in a preliminary experiment [15]. We are the first to present such a technique. In comparison
with conventional phase-shifting digital holographic microscopes, the proposed method markedly
improves the quality of the reconstructed images.
2. A Calibrated Phase-Shifting Digital Holographic Microscope System
The sketch of the calibrated phase-shifting digital holographic microscope system for transparent
objects is shown in Figure 1. The diameter of the beam used to illuminate the sample is small, such
that a beam can be extracted by Beam Splitter (BS) 1 before the beam passes through an expander.
The extracted beam passes through the object and arrives at Camera 1 via the microscopic system.
The collimated beam is divided into two arms by BS 2. One arm works as the reference beam, and the
other one works as the object beam for Camera 2. The beam reflected from the mirror mounted on a PZT
is subdivided into two beams by BS 4. One is reflected by BS 5 to arrive at Camera 2 and interferes with
the beam reflected from mirror (M) 2. On the other hand, the beam reflected from M 4 and BS 6 arrives
at Camera 1 and interferes with the object wave. Hence, the Camera 1 records a hologram including
the object information, while Camera 2 records an interferogram with a periodic repetitive fringe
pattern generated by two plane waves. The hologram recorded by Camera 1 and the interferogram
recorded by Camera 2 will synchronously change if the phase of the reference beam is shifted by the
PZT. The sampling Moiré technique is capable of accurately measuring minute displacement from a
single repetitive fringe pattern and the accuracy of the technique can theoretically achieve 1/500 of
an interference fringe pitch [16–18]. Therefore, we introduce the sampling Moiré method to analyze
the interferograms recorded by Camera 2 to evaluate the phase-shifting errors. Finally, the 3-D object
images
Appl. are reconstructed
Sci. 2018, by the phase-shifting error compensation algorithm [15].
8, x FOR PEER REVIEW 3 of 11
Figure 1.
Figure 1. The
The sketch
sketch of
of the
the proposed
proposed calibrated
calibrated phase-shifting
phase-shifting digital
digitalholographic
holographicmicroscope
microscopesystem.
system.
3. The Sampling Moiré Technique
The principle of the sampling Moiré technique [17] is represented in Figure 2. If the pitch of the
captured grating pattern in the image sensor plane is supposed as P, then the recorded intensity of
the grating can be described as
x 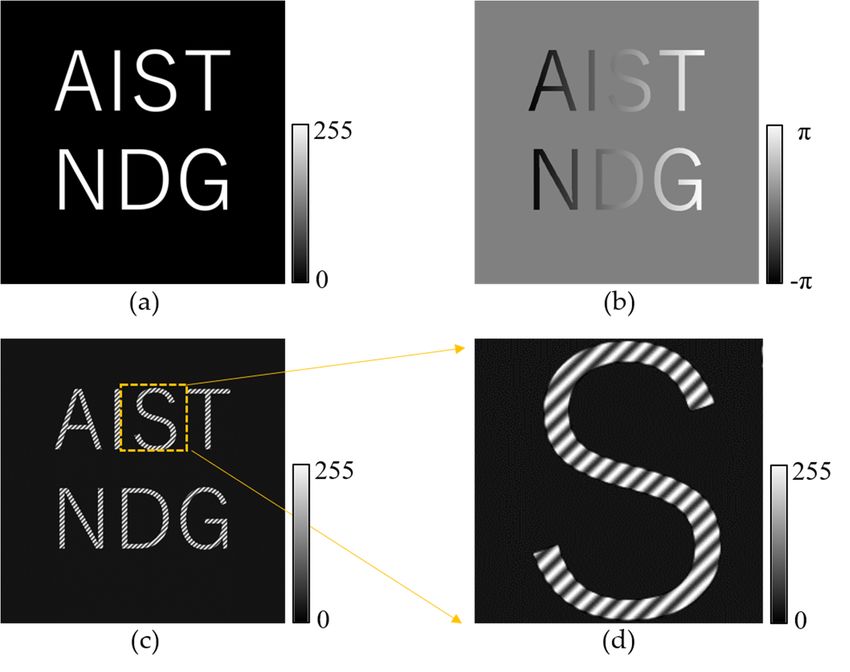
Appl. Sci. 2018, 8, 706 3 of 10
In addition, the shifting amount of the PZT is not equal to the theoretical values, because the
surface of the mirror mounted on the PZT is not strictly perpendicular to the incoming beam in
general. If ϕs is the set phase-shifting amount of the hologram used for phase-shifting calculation,
and the corresponding shifting amount of the PZT is dt , then many phase-shifted interference fringe
patterns are recorded by Camera 2, and the average phase difference ∆ϕm between two neighboring
interference fringe patterns can be calculated using the sampling Moiré technique. The real shifting
amount of the PZT can be determined using
ϕs
d = dt . (1)
∆ϕm
3. The Sampling Moiré Technique
The principle of the sampling Moiré technique [17] is represented in Figure 2. If the pitch of the
captured grating pattern in the image sensor plane is supposed as P, then the recorded intensity of the
grating can be described as
= A g cos 2π Px + φg0 + Bg
f ( x, y)
. (2)
= A g cos φg ( x, y) + Bg
Appl. Sci. 2018, 8, x FOR PEER REVIEW 4 of 11
Principleof
Figure2.2.Principle
Figure ofthe
thesampling
samplingMoiré
Moirétechnique
techniquetotocalculate
calculatethe
thephase
phasedistribution
distributionfrom
fromaasingle
single
grating pattern. FFT denotes the fast Fourier transform and DFT denotes the discrete Fourier
grating pattern. FFT denotes the fast Fourier transform and DFT denotes the discrete Fourier transform.
transform.
Here, A g is the amplitude distribution of the grating pattern, Bg is the intensity of the background,
φg0 is the initial
Figure phase the
3 illustrates value
principle of thex,
at position and φg Moiré
sampling is the phase
techniquedistribution of the
to determine thegrating pattern.
phase-shifting
Multiple
errors. In phase-shifted
the calibratedMoiré fringe patterns
phase-shifting can
digital be obtainedsystem,
holography throughseveral
down-sampling and intensity
interferograms with a
interpolation
periodic processing.
repetitive In general,
fringe pattern an integer T that
and phase-shifted holograms to P is applied
is closeincluding for down-sampling.
the object information are
T must bebylarger
captured than or equal cameras.
two synchronized to 3 to calculate the phase distribution
The phase-shifting amount of two of the Moiré fringe
neighboring patterns.
holograms
Thebe
can beginning
calculatedof the
fromdown-sampling positionof
the phase difference is the
set to the first
Moiré rowpatterns.
fringe of the recorded grating,
Therefore, thephase-
if the pixels
shifting errors are occurred in the recorded holograms, they will be accurately calculated by
j
j n j s (j = 1, 2, 3, …). (5)
n 1
Here, ∆ is the phase-shifting amount calculated from the phase difference of two neighboring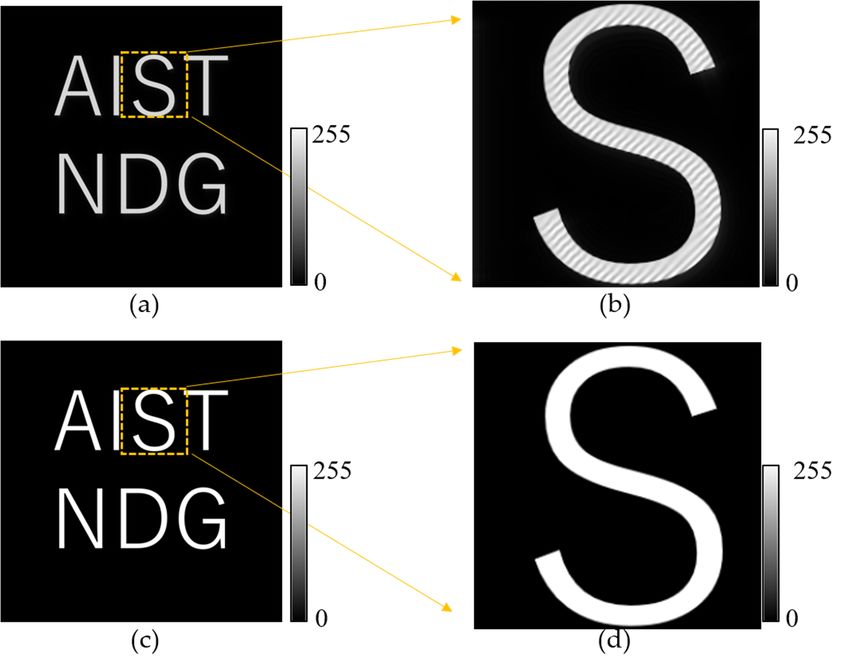
Appl. Sci. 2018, 8, 706                                                                                   4 of 10

at intervals of T-1 rows are extracted, and the vacant pixels are then interpolated using adjacent
sampled pixels. T-phase-shifted Moiré fringe patterns can be obtained when the beginning of the
down-sampling position increases from the first to the T-th row. The intensity of the phase-shifted
Moiré fringe patterns can be represented as
                                                    n                              o
                           f m ( x, y; k)   = Am cos 2π ( P1 − T1 ) x + 2π Tk + φg0 + Bm
                                                                                                              (3)
                                                    = Am cos{φm ( x, y)} + 2π Tk + Bm

where Am , Bm and φm are the amplitude distribution, the intensity of the background, and the phase
distribution of the Moiré fringe pattern, respectively. k is the number of the Moiré fringe patterns.
The phase distribution φm of the phase-shifted Moiré fringe patterns can be obtained by a phase-shifting
method [17,18], expressed as

                                                          ∑kT=−01 f m ( x, y; k ) sin(2πk/T )
                               φm ( x, y) = − tan−1                                             .             (4)
                                                         ∑kT=−01 f m ( x, y; k ) cos(2πk/T )

     Figure 3 illustrates the principle of the sampling Moiré technique to determine the phase-shifting
errors. In the calibrated phase-shifting digital holography system, several interferograms with a
periodic repetitive fringe pattern and phase-shifted holograms including the object information are
captured by two synchronized cameras. The phase-shifting amount of two neighboring holograms can
be calculated from the phase difference of the Moiré fringe patterns. Therefore, if the phase-shifting
errors are occurred in the recorded holograms, they will be accurately calculated by

                                                j
                                       ∆δj =   ∑ ∆ϕn − jϕs ( j       = 1, 2, 3, . . .)                        (5)
Appl. Sci. 2018, 8, x FOR PEER REVIEW          n =1                                                       5 of 11

            Figure 3. Principle of the sampling Moiré technique to determine the phase-shifting errors.
            Figure 3. Principle of the sampling Moiré technique to determine the phase-shifting errors.

4. Numerical Simulation
     In the microscopic field, many specimens are mostly transparent, such as biological cells and
glass. Hence, we suppose that the object in the numerical simulation is a transparent object. Images
with dimensions of 1024 × 1024 pixel and a 3.45 μm pixel pitch were treated as the amplitude and
phase distributions of the object, as shown in Figure 4a,b. The distance between the object and the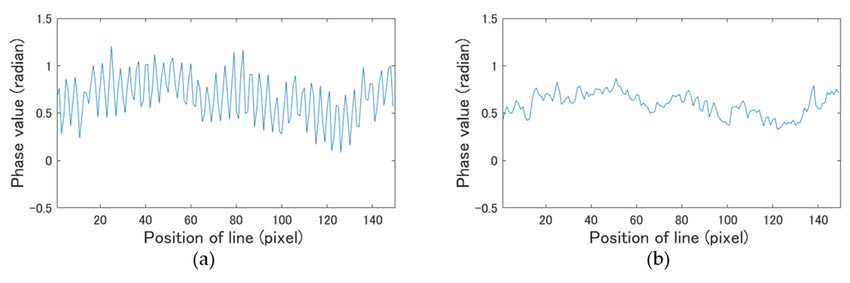
Appl. Sci. 2018, 8, 706                                                                                                          5 of 10

     Here, ∆ϕn is the phase-shifting amount calculated from the phase difference of two neighboring
interference fringe patterns. High-quality object images can be reconstructed using the phase-shifting
error compensation algorithm [15].

4. Numerical Simulation
       In the microscopic field, many specimens are mostly transparent, such as biological cells and
glass. Hence, we suppose that the object in the numerical simulation is a transparent object. Images
with dimensions of 1024 × 1024 pixel and a 3.45 µm pixel pitch were treated as the amplitude and
phase distributions of the object, as shown in Figure 4a,b. The distance between the object and the
image sensor was set to 0.5 mm. The maximum pixel value of the amplitude image was normalized to
255. The values of the phase distribution were set from −π to π. In the actual experiment, the angle
between the object wave and the reference wave was difficult to adjust to zero despite the in-line digital
holography. Therefore, we introduced a small angle between the object wave and the reference wave.
Figure 4c shows an example of the generated hologram in which the interference fringes appeared,
and part of the generated hologram is magnified in Figure 4d. The wavelength of the light source was
assumed to be 532 nm. The phase-shifting errors at a maximum of 20% were randomly introduced
when holograms and interferograms were generated. The four phase-shifted holograms—I ( x, y; 0),
I ( x, y; π/2 + ∆δ1 ), I ( x, y; π + ∆δ2 ), and I ( x, y; 3π/2 + ∆δ3 )—and four phase-shifted interferograms
were obtained. The reconstructed images by using the conventional phase-shifting method [11] and
the phase-shifting error compensation algorithm are illustrated in Figures 5 and 6. We can see that
the residual interference fringes appear in Figures 5b and 6b because the phase-shifting calculation
of the conventional method is incorrect owing to the phase-shifting errors. On the other hand, both
the amplitude and phase images of the object were correctly reconstructed by the phase-shifting error
compensation algorithm, as shown in Figures 5d and 6d. Here, the detected phase-shifting errors
by the sampling Moiré technique were 0.2846, 0.0399 and 0.2869 rad, respectively. Additionally, the
normalized root-mean-square errors (NRMSEs) of the reconstructed amplitude and phase images were
calculated. The results are revealed in Table 1. Note that the NRMSE of the proposed method is not
equal to zero because a little linear interpolation errors existed in the down-sampling processing [18].
However, the proposed method greatly reduced the errors even though interpolation errors occurred.
           Appl. Sci. 2018, 8, x FOR PEER REVIEW                                                                       6 of 11

      Figure 4.Figure  4. Simulated
                 Simulated     objectobject
                                      and and    an example
                                            an example     ofofthe
                                                                 thegenerated
                                                                     generated hologram.
                                                                               hologram. (a,b)  Amplitude
                                                                                            (a,b)           and phase
                                                                                                    Amplitude     and phase
               distributions; (c) Example of the generated hologram;   (d) Magnified image of the area
      distributions; (c) Example of the generated hologram; (d) Magnified image of the area indicated  indicated in (c). in (c).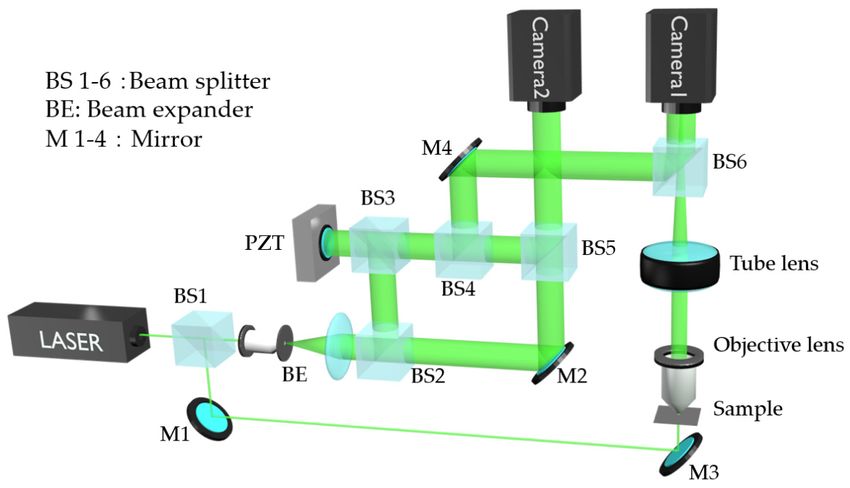
Figure
Appl. Sci.       4. 706
           2018, 8,  Simulated object and an example of the generated hologram. (a,b) Amplitude and phase
                                                                                                        6 of 10
      distributions; (c) Example of the generated hologram; (d) Magnified image of the area indicated in (c).

      Figure5.5.Simulation
     Figure      Simulationresults
                               resultsofofthe
                                            theamplitude
                                                amplitudeimages.
                                                          images.(a,c)
                                                                  (a,c)Amplitude
                                                                        Amplitudeimages
                                                                                  imagesreconstructed
                                                                                          reconstructedbybythe
                                                                                                            the
     conventional
      conventionalmethod
                      methodand andthe
                                     theproposed
                                           proposedmethod,
                                                     method,respectively;
                                                             respectively;(b,d)
                                                                           (b,d)Magnified
                                                                                Magnifiedimages
                                                                                           imagesofofthe
                                                                                                      theareas
                                                                                                          areas
     indicated
      indicatedinin(a,c),
                    (a,c),respectively.
                           respectively.
Appl. Sci. 2018, 8, x FOR PEER REVIEW                                                                          7 of 11

      Figure6.6.Simulation
     Figure      Simulationresults
                            resultsof
                                   ofthe
                                      thephase
                                         phaseimages.
                                               images. (a,c)
                                                        (a,c) Phase
                                                              Phase images
                                                                    images reconstructed
                                                                           reconstructedby bythe
                                                                                              theconventional
                                                                                                 conventional
     method
      method and         proposedmethod,
                and the proposed   method,respectively;
                                           respectively;(b,d)
                                                          (b,d) Magnified
                                                               Magnified   images
                                                                         images     of the
                                                                                of the     areas
                                                                                       areas     indicated
                                                                                             indicated      in
                                                                                                       in (a,c),
     (a,c), respectively.
      respectively.

                               Table 1. Normalized root-mean-square error results.

                                    Image          Conventional       Proposed
                                   Amplitude          6.433             0.042
                                    Phase             0.044             0.000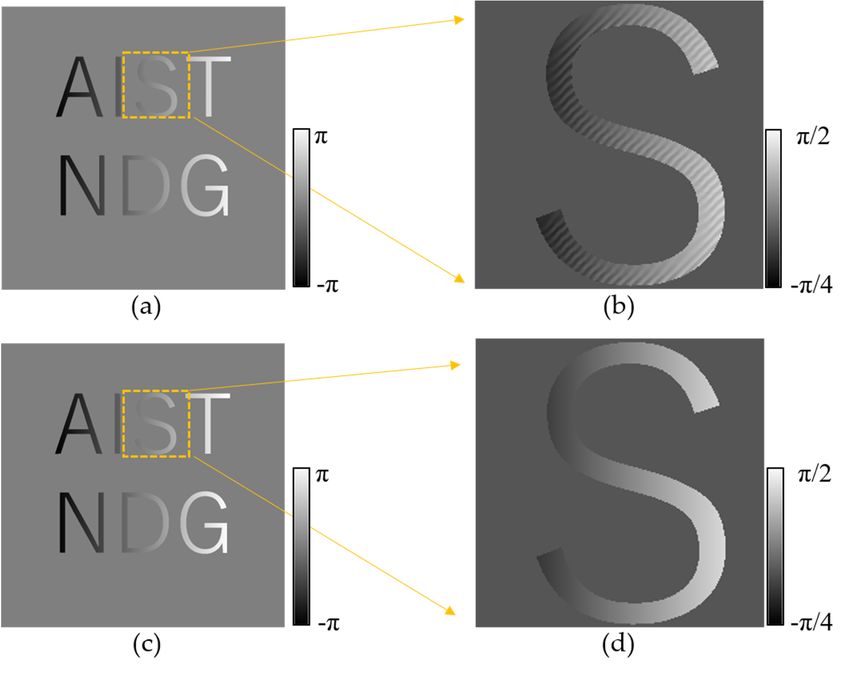
Appl. Sci. 2018, 8, 706 7 of 10
Table 1. Normalized root-mean-square error results.
Image Conventional Proposed
Amplitude 6.433 0.042
Phase 0.044 0.000
5. Experiment
The experimental conditions and results of the calibrated phase-shifting digital holographic
microscope system are presented. The proposed system markedly improves the quality of the
reconstructed image compared with the conventional phase-shifting digital holographic microscope.
5.1. Experimental Conditions
In the experiment, an Nd:YAG laser working at 532 nm and 30 mW output power was used as the
light source. Two complementary metal–oxide semiconductor (CMOS) cameras (VCXU-50, Baumer,
Inc., Frauenfeld, Thurgau, Switzerland) with a resolution of 2448 × 2048 pixel and a 3.45 µm pixel
pitch were used to record the holograms and interferograms. A transmission-type test target (1951
USAF resolution test chart) was set as the object. The system utilized an infinity-corrected optical
microscope that consists of an objective lens with 4 × magnification and a tube lens with a 200 mm
focal length. The object image was placed close to the hologram plane via the infinity-corrected optical
microscope, and four phase-shifted holograms with π/2 phase-shifting amount were then recorded by
driving a PZT (PAZ005, Thorlabs, Inc., Newton, NJ, USA).
5.2. Experimental Results and Discussion
One example of the recorded hologram including the object information and one interferogram
used for calculating the phase-shifting errors are presented in Figure 7a,b, respectively. We continuously
recorded 100 groups of four phase-shifted holograms and found that large phase-shifting errors
occurred several times. One example of the reconstructed images is presented. The reconstructed
distance was 0.5 mm. The amplitude images reconstructed by the conventional phase-shifting
method [11]Appl.
andSci.the
2018, phase-shifting
8, x FOR PEER REVIEW error compensation algorithm [15] are revealed in Figure 8 of 11 8a,c, and
the magnified images of the areas indicated in Figure 8a,c are represented in Figure 8b,d, respectively.
reconstructed distance was 0.5 mm. The amplitude images reconstructed by the conventional phase-
Furthermore, the phase
shifting methodimages were
[11] and the also reconstructed
phase-shifting by thealgorithm
error compensation conventional
[15] aremethod
revealed inand the proposed
Figure
method. The results are shown in Figure 9. Figure 9a,c are the original reconstructed
8a,c, and the magnified images of the areas indicated in Figure 8a,c are represented in Figure 8b,d, phase images,
respectively. Furthermore, the phase images were also reconstructed by the conventional
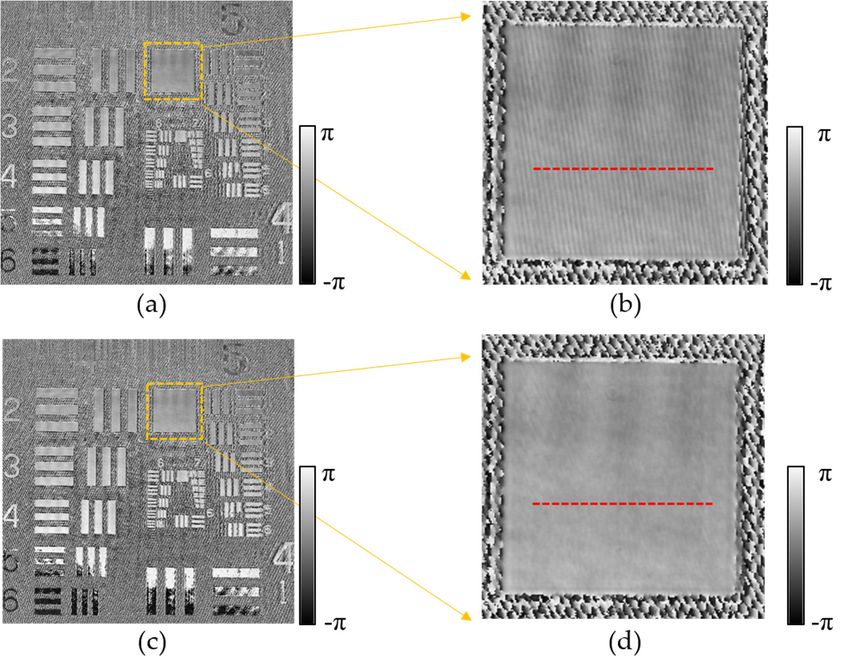
and Figure 9b,d are the magnified images of the areas indicated in Figure 9a,c, respectively. Here, the method
and the proposed method. The results are shown in Figure 9. Figure 9a,c are the original
detected phase-shifting errors were 0.0763, 0.01945 and −0.9727 radian, respectively. As found in the
reconstructed phase images, and Figure 9b,d are the magnified images of the areas indicated in Figure
numerical simulation,
9a,c, respectively. there arethemany
Here, more
detected residual errors
phase-shifting interference fringes
were 0.0763, 0.01945inand
the−0.9727
images reconstructed
radian,
by the conventional
respectively.method
As found in than there are
the numerical in the images
simulation, reconstructed
there are many more residual by the phase-shifting
interference fringes error
compensationin thealgorithm
images reconstructed
becausebyofthethe conventional method than there
large phase-shifting are in the
errors. images
Thus, reconstructed
the effectiveness of the
by the phase-shifting error compensation algorithm because of the large phase-shifting errors. Thus,
proposed system is experimentally
the effectiveness of the proposed demonstrated.
system is experimentally demonstrated.
Figure 7. (a) One hologram recorded by Camera 1; (b) One interferogram recorded by Camera 2.
Figure 7. (a) One hologram recorded by Camera 1; (b) One interferogram recorded by Camera 2.Appl. Sci. 2018, 8, 706 8 of 10
Figure 7. (a) One hologram recorded by Camera 1; (b) One interferogram recorded by Camera 2.
Figure8.8.Experimental
Figure Experimentalresults
resultsofofthe
theamplitude
amplitudeimages.
images.(a,c)
(a,c)Amplitude
Amplitudeimages
imagesreconstructed
reconstructedbybythe
the
conventional
conventionalmethod
methodandandthe
theproposed
proposedmethod,
method,respectively;
respectively;(b,d)
(b,d)Magnified
Magnifiedimages
imagesofofthe
theareas
areas
indicated
indicatedinin(a,c),
(a,c),respectively.
respectively.
Appl. Sci. 2018, 8, x FOR PEER REVIEW 9 of 11
Figure9.9.Experimental
Figure Experimental results
results of theofphase
the images.
phase images. (a,c)
(a,c) Phase Phase
images images reconstructed
reconstructed by the
by the conventional
conventional
method method
and the and method,
proposed the proposed method,(b,d)
respectively; respectively;
Magnified(b,d) Magnified
images of the images of the areas
areas indicated in
indicated
(a,c), in (a,c), respectively.
respectively.
Figure 10 plots the phase values of the dotted red lines indicated in Figure 9b,d. The test target
is made of glass whose surface is extremely flat. Obviously, the fluctuation of phase values obtained
by the conventional method is much greater than that obtained by the proposed method. In other
words, the proposed system is capable of improving the quality of the reconstructed images to
achieve a high precision phase measurement.Figure 9. Experimental results of the phase images. (a,c) Phase images reconstructed by the
conventional method and the proposed method, respectively; (b,d) Magnified images of the areas
Appl. Sci. 2018, 8, 706 9 of 10
indicated in (a,c), respectively.
Figure 10 plots
Figure 10 plots the
the phase
phasevalues
valuesof ofthe
thedotted
dottedredredlines
linesindicated
indicatedininFigure
Figure 9b,d.
9b,d. TheThe test
test target
target is
is made of glass whose surface is extremely flat. Obviously, the fluctuation of phase values
made of glass whose surface is extremely flat. Obviously, the fluctuation of phase values obtained by obtained
by
the the conventional
conventional method
method is much
is much greater
greater than than that obtained
that obtained by theby the proposed
proposed method.method.
In otherInwords,
other
words, the proposed system is capable of improving the quality of the reconstructed
the proposed system is capable of improving the quality of the reconstructed images to achieve a high images to
achieve a phase
precision high precision phase measurement.
measurement.
10. The
Figure 10. Thephase
phasevalues of the
values dotted
of the red line
dotted red inline
Figure 9b,d. (a)9b,d.
in Figure Conventional method. (b)
(a) Conventional Proposed
method. (b)
method. method.
Proposed
6. Conclusions
A calibrated
calibratedphase-shifting
phase-shifting digital
digital holographic
holographic microscope
microscope systemsystem has
has been been described.
described. The
The proposed
proposed
system usedsystem used two synchronized
two synchronized CMOS cameras.CMOSOnecameras.
was usedOne was used
to record to record the
the holograms, holograms,
which includes
which includes
the object the object
information, andinformation,
the other oneandwas
theused
othertoone was the
record used to record the interferograms
interferograms for
for evaluating the
evaluating theerrors.
phase-shifting phase-shifting
Both the errors. Both
numerical the numerical
simulation simulationdemonstrated
and experiment and experiment thatdemonstrated
the quality of
that the quality of
the reconstructed the reconstructed
image image was
was greatly improved usinggreatly improved using
the phase-shifting error the phase-shifting
compensation error
algorithm.
compensation
Compared withalgorithm. Compared
the conventional with thedigital
phase-shifting conventional phase-shifting
holographic microscope, thedigital holographic
proposed system
is more stable because of its ability to detect phase-shifting errors. Thus, the proposed system can be
applied in various industrial fields, such as product inspection on production lines. Moreover, the
cost of the system is low because the low-cost laser and PZT can be used in the proposed system.
The digital holographic microscope will become more widespread.
Author Contributions: P.X. designed the optical setup of the proposed system and implemented the experiment.
Q.W. and S.R. provided the calculation of the sampling Moiré technique and contributed to the numerical
simulation. H.T. discussed the results and commented on the manuscript at all stages.
Funding: This research was partially funded by Grant-in-Aid for Research Activity Start-up from Japan Society
for the Promotion of Science (JSPS) grant number [16H07472] and by the Mitutoyo Association for Science and
Technology grant number [R1702].
Conflicts of Interest: The authors declare no conflict of interest.
References
1. Mann, C.J.; Yu, L.F.; Lo, C.M.; Kim, M.K. High-resolution quantitative phase-contrast microscopy by digital
holography. Opt. Express 2005, 13, 8693–8698. [CrossRef] [PubMed]
2. Dubois, F.; Joannes, L.; Legros, J.C. Improved three-dimensional imaging with a digital holography
microscope with a source of partial spatial coherence. Appl. Opt. 1999, 38, 7085–7094. [CrossRef] [PubMed]
3. Zakerin, M.; Novak, A.; Toda, M.; Emery, Y.; Natalio, F.; Butt, H.J.; Berger, R. Thermal characterization of
dynamic silicon cantilever array sensors by digital holographic microscopy. Sensors 2017, 17, 1191. [CrossRef]
[PubMed]
4. Poon, T.-C.; Doh, K.; Schilling, B.; Wu, M.; Shinoda, K.; Suzuki, Y. Three-dimensional microscopy by optical
scanning holography. Opt. Eng. 1995, 34, 1338–1344. [CrossRef]
5. Martínez-León, L.; Pedrini, G.; Osten, W. Applications of short-coherence digital holography in microscopy.
Appl. Opt. 2005, 44, 3977–3984. [CrossRef] [PubMed]Appl. Sci. 2018, 8, 706 10 of 10
6. Claus, D.; Iliescu, D. Optical parameters and space–bandwidth product optimization in digital holographic
microscopy. Appl. Opt. 2013, 52, A410–A422. [CrossRef] [PubMed]
7. Zhang, T.; Yamaguchi, I. Three-dimensional microscopy with phase-shifting digital holography. Opt. Lett.
1998, 23, 1221–1223. [CrossRef] [PubMed]
8. Garcia-Sucerquia, J.; Xu, W.B.; Jericho, S.K.; Klages, P.; Jericho, M.H.; Kreuzer, H.J. Digital in-line holographic
microscopy. Appl. Opt. 2006, 45, 836–850. [CrossRef] [PubMed]
9. He, X.; Nguyen, C.V.; Pratap, M.; Zheng, Y.; Wang, Y.; Nisbet, R.D.; Williams, R.J.; Rug, M.; Maier, A.G.;
Lee, W.M. Automated Fourier space region-recognition filtering for off-axis digital holographic microscopy.
Biomed. Opt. Express 2016, 7, 3111–3123. [CrossRef] [PubMed]
10. Verrier, N.; Atlan, M. Off-axis digital hologram reconstruction: Some practical considerations. Appl. Opt.
2011, 50, H136–H146. [CrossRef] [PubMed]
11. Yamaguchi, I.; Zhang, T. Phase-shifting digital holography. Opt. Lett. 1997, 22, 1268–1270. [CrossRef]
[PubMed]
12. Mercer, C.R.; Beheim, G. Fiber optic phase stepping system for interferometry. Appl. Opt. 1991, 30, 729–734.
[CrossRef] [PubMed]
13. Nomura, T.; Imbe, M. Single-exposure phase-shifting digital holography using a random-phase reference
wave. Opt. Lett. 2010, 35, 2281–2283. [CrossRef] [PubMed]
14. Larkin, K. A self-calibrating phase-shifting algorithm based on the natural demodulation of two-dimensional
fringe patterns. Opt. Express 2001, 9, 236–253. [CrossRef] [PubMed]
15. Xia, P.; Wang, Q.; Ri, S.; Tsuda, H. Calibrated phase-shifting digital holography based on dual-camera system.
Opt. Lett. 2017, 42, 4954–4957. [CrossRef] [PubMed]
16. Ri, S.; Muramatsu, T.; Saka, M.; Nanbara, K.; Kobayashi, D. Accuracy of the sampling moiré method and its
application to deflection measurements of large-scale structures. Exp. Mech. 2012, 52, 331–340. [CrossRef]
17. Ri, S.; Fujigaki, M.; Morimoto, Y. Sampling moiré method for accurate small deformation distribution
measurement. Exp. Mech. 2010, 50, 501–508. [CrossRef]
18. Ri, S.; Muramatsu, T. Theoretical error analysis of the sampling moiré method and phase compensation
methodology for single-shot phase analysis. Appl. Opt. 2012, 51, 3214–3223. [CrossRef] [PubMed]
© 2018 by the authors. Licensee MDPI, Basel, Switzerland. This article is an open access
article distributed under the terms and conditions of the Creative Commons Attribution
(CC BY) license (http://creativecommons.org/licenses/by/4.0/).You can also read