Monthly water situation report - GOV.UK
←
→
Page content transcription
If your browser does not render page correctly, please read the page content below
Monthly water situation report
England

Summary – March 2021
March was the first month with below average rainfall for most of England since November 2020, apart from the
north-west where it was another wet month. However rainfall totals for the 6 month period from October to March
were exceptionally or notably high compared to the historic record for many parts of England. After a very wet
winter the low rainfall in March meant soils were drier than the previous month by the end of March. Monthly mean
river flows were lower than in February but remain normal or higher for the time of year at nearly all reported sites.
Groundwater levels at many reported sites peaked and started to decrease although some slower responding
aquifers maintained historically high levels. Some reservoir stocks increased while some decreased, however total
stocks for England remain above average for the time of year.

Rainfall
The March rainfall total for England was 50mm, which represents 75% of the 1961 to 1990 long term average
(LTA) (78% of the 1981 to 2010 LTA). For most of England this is the first month with below average rainfall since
November 2020. Only north-west England recorded widespread above LTA March rainfall totals (Figure 1.1 and
Figure 1.3).

Monthly rainfall totals were classed as normal across two thirds of all catchments in England and below normal
across just under a quarter of catchments. The lowest rainfall total as a proportion of the LTA was over the
Sussex coast where the rainfall total was less than 25mm, representing 39% of the March LTA. Exceptionally
high rainfall totals for the time of year were recorded over just one catchment: the Wyre and Lune in Lancashire
(180mm and 165% of the LTA), this was the eighth wettest March on record for the catchment (records since
1891) (Figure 1.2).

The 3, 6 and 12 month cumulative rainfall totals ending in March were classed as normal or higher in every
catchment across England. Rainfall totals for the January to March 3 month period were the wettest on record for
the River Tees catchment in north-east England (records since 1891). The 6 month cumulative rainfall totals were
higher than normal for nearly all of the catchments across England and exceptionally high or notably high at over
half of them (Figure 1.2). A third of catchments have recorded rainfall totals ranked within the top ten wettest on
record for the October to March 6 month period, these were mainly across northern and eastern England. Rainfall
totals for the April to March 12 month period were the wettest on record for the Esk catchment in Cumbria.

At a regional scale, March rainfall totals ranged from 54% of the LTA in south-west England, to 134% of the LTA
in north-west England (Figure 1.3). North-east and north-west England have recorded rainfall totals for the
October to March 6 month period that rank within the top ten wettest on record (records since 1891). For England
as a whole it has been the 11th wettest October to March 6 month period on record. This is now the fourth
October to March period within the last 8 years to fall within the top 11 wettest periods in 130 years of record.

Soil moisture deficit
Compared to the end of February, soils at the end of March were drier in almost all reported grid-squares across
England. However soil moisture deficits (SMD) remain smaller than 30mm and the difference compared to the
March LTA was in the range +/-15mm. (Figure 2.1)

At a regional scale, the end of month SMD values were slightly larger (drier) than the end of March LTA in all
regions and larger than at the end of February (Figure 2.2)

River flows
Monthly mean flows for March were classed as normal for the time of year at over two-thirds of the reported
gauging stations; flows were classed as higher than normal at a quarter of the indicator sites – mainly in north-
west England.

All data are provisional and may be subject to revision. The views expressed in this document are not necessarily those of the
Environment Agency. Its officers, servants or agents accept no liability for any loss or damage arising from the interpretation or
use of the information, or reliance upon views contained herein.

  www.gov.uk/environment-agency                                       © Environment Agency 2021                      1
River flows decreased at almost all reported flow indicator sites compared to February which was a much wetter
month. The only site where reported river flows increased compared to February was the River Lune at Caton in
Lancashire where flows were 172% of the March LTA. In north-east England the River Derwent in North
Yorkshire and the River Till in Northumberland changed from having flows classed as exceptionally high in
February to normal in March; a similar change was also seen on the River Yare in Norfolk. Rivers with a high
groundwater contribution to flow were better able to maintain sustained high flows despite the relatively low
March rainfall; for example the River Burn in north Norfolk and the River Ver in Hertfordshire had flows that were
classed as exceptionally high in both February and March. (Figure 3.1)

At the regional index sites monthly mean flows were classed as normal at all sites apart from the River Lune
(north-west England) where flows were notably high and the River Great Stour (south-east England) where flows
were above normal. (Figure 3.2)

Groundwater levels
Groundwater levels decreased at slightly more of the indicator sites we report on than the number of sites where
levels increased during March. The end of month groundwater levels were classed as normal or higher for the
time of year at nearly all sites, with exceptionally high groundwater levels recorded at 6 out of 26 sites (down from
10 sites at the end of February).

Aycliffe (Wear Magnesian Limestone), Washpit Farm (north-west Norfolk chalk), Weir Farm (Bridgnorth
sandstone) and Priors Heyes (West Cheshire sandstone) recorded the highest end of March levels on record
(records go back to 1979, 1950, 1983 and 1972 respectively). Levels at Priors Heyes remain high compared to
historic levels because the aquifer is recovering from the effects of historic abstraction. For all these indicator
sites apart from Aycliffe this is the third consecutive month with the highest levels on record for the time of year.

End of month groundwater levels at the major aquifer index sites ranged from below normal at Jackaments
Bottom (Jurassic limestone) to exceptionally high at Weir Farm (Bridgnorth sandstone) and Skirwith (Carlisle
Basin and Eden Valley sandstone). End of March levels changed to a lower class compared to the end of
February at half of the major aquifer index sites; these were the faster responding chalk and limestone aquifers
rather than slower responding sandstone (Figures 4.1 and 4.2)

Reservoir storage
Reservoir stocks increased at the same number of the reservoirs and reservoir groups we report on as saw
decreases during March. The biggest decreases between the end of February and the end of March as a
proportion of total capacity were in central England at Blithfield (99% to 94%), north-east England at Kielder (99%
to 94%) and north-west England at the Haweswater/Thirlmere group (100% to 95%). The biggest increases in
stocks were in east England at Abberton (83% to 93%) and Grafham (82% to 92%).

Reservoir stocks in only three of the reservoirs and reservoir groups we report on were classed as below normal,
the rest were classed as normal or higher for the time of year. (Figure 5.1)

Total reservoir stocks for England were at 95% of total capacity at the end of March (a decrease from 96% at the
end of February), this is 4% above the LTA for the time of year. At a regional scale, total reservoir stocks were all
greater than the LTA and ranged from 93% in north-east England to 97% in central, south-east and south-west
England. (Figure 5.2)

Forward look
After a warm and bright start for much of England during the first few days of April, conditions will turn colder and
more unsettled, with wintry showers of snow and sleet affecting most areas. Towards the middle of April most
places will be mainly dry with settled conditions as high pressure dominates, particularly in the south-east.
Temperatures will likely remain at or slightly below average at first, before recovering to potentially slightly above
average at times, although temperatures could be suppressed in wetter areas. Confidence is low for the end of
April, however mixed and slowly evolving weather patterns, typical of spring, are most likely. Fine and dry
weather is likely to be more prevalent overall, although all areas are likely to see some showers or longer spells
of rain at times. Temperatures probably close to average with some warmer spells possible at times.

For the 3 month period April to June, there is a higher than typical chance of near average precipitation across
the UK, and half the normal chance of dry conditions1.

1   Source: Met Office

www.gov.uk/environment-agency                                                    © Environment Agency 2021          2
Projections for river flows at key sites2
Two-thirds of the modelled sites have a greater than expected chance of cumulative river flows being normal or
higher for the time of year by the end of September 2021. By the end of March 2022, half of the modelled sites
have a greater than expected chance of cumulative river flows being above normal or higher for the time of year.

For scenario based projections of cumulative river flows at key sites by September 2021 see Figure 6.1
For scenario based projections of cumulative river flows at key sites by March 2022 see Figure 6.2
For probabilistic ensemble projections of cumulative river flows at key sites by September 2021 see Figure 6.3
For probabilistic ensemble projections of cumulative river flows at key sites by March 2022 see Figure 6.4

Projections for groundwater levels in key aquifers2
By the end of September 2021, more than 90% of the modelled sites have a greater than expected chance of
groundwater levels being normal or higher for the time of year. By the end of March 2022, two-thirds of the
modelled sites have a greater than expected chance of groundwater levels being above normal or higher for the
time of year.

For scenario based projections of groundwater levels in key aquifers in September 2021 see Figure 6.5
For scenario based projections of groundwater levels in key aquifers in March 2022 see Figure 6.6
For probabilistic ensemble projections of groundwater levels in key aquifers in September 2021 see Figure 6.7
For probabilistic ensemble projections of groundwater levels in key aquifers in March 2022 see Figure 6.8

Authors:        National Water Resources Hydrology Team

2
    Information produced by the Water Situation Forward Look group led by Environment Agency in partnership with the
    Centre for Ecology and Hydrology, British Geological Survey, Met Office (www.hydoutuk.net).

www.gov.uk/environment-agency                                                      © Environment Agency 2021           3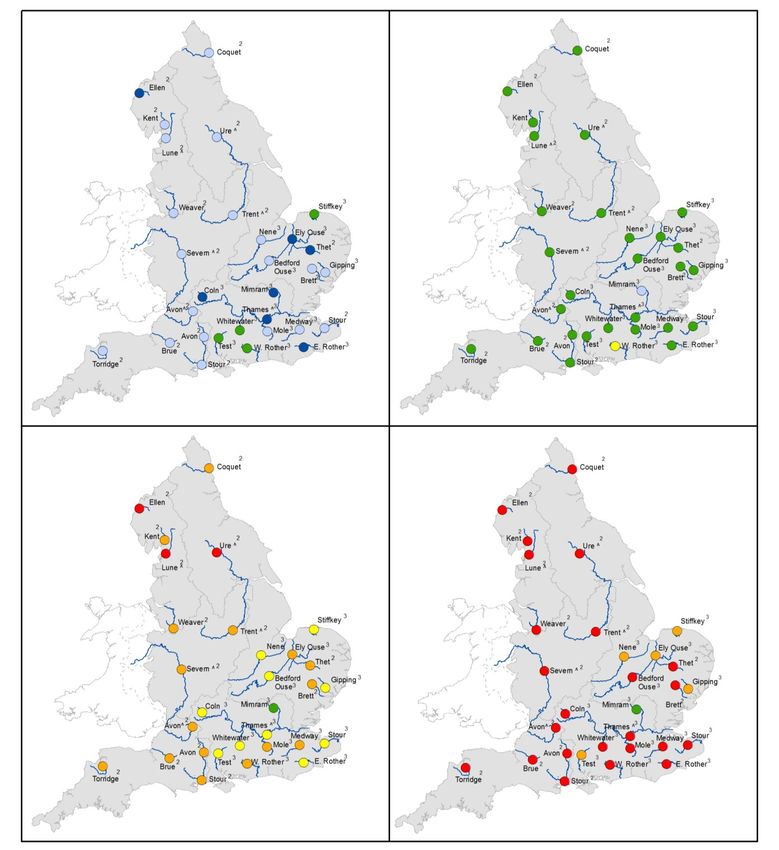
Rainfall

       April 2020                 May 2020                   June 2020                  July 2020

      August 2020              September 2020              October 2020               November 2020

     December 2020              January 2021               February 2021               March 2021

Figure 1.1: Monthly rainfall across England and Wales for the past 12 months.
UKPP radar data (Source: Met Office © Crown Copyright, 2021). Note: Radar beam
blockages in some regions may give anomalous totals in some areas. Crown
copyright. All rights reserved. Environment Agency, 100024198, 2021.

www.gov.uk/environment-agency                                            © Environment Agency 2021    4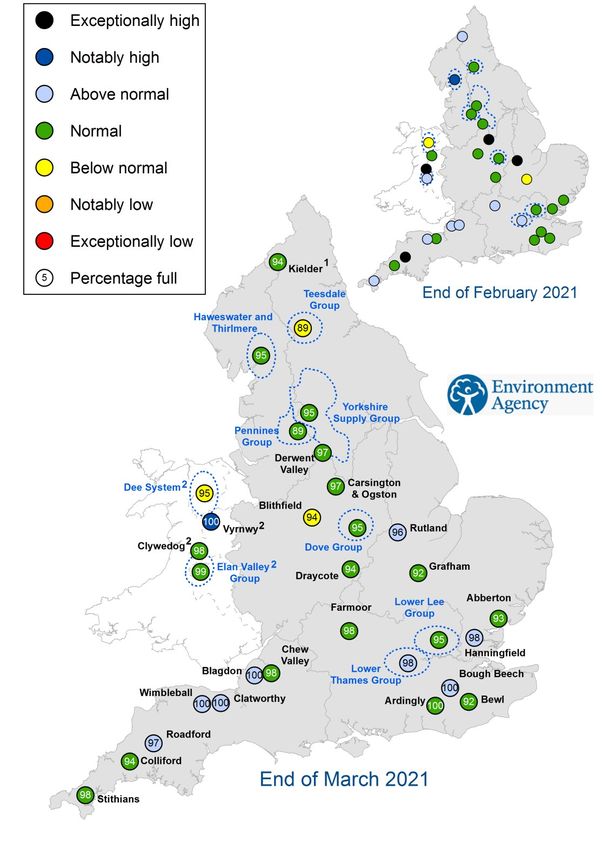
Figure 1.2: Total rainfall for hydrological areas across England for the current month (up to 31 March), the last 3
months, the last 6 months, and the last 12 months, classed relative to an analysis of respective historic totals.
HadUK data based on the Met Office 1km gridded rainfall dataset derived from rain gauges (Source: Met Office
© Crown Copyright, 2021). Provisional data based on Environment Agency 1km gridded rainfall dataset derived
from Environment Agency intensity rain gauges. Crown copyright. All rights reserved. Environment Agency,
100024198, 2021.

www.gov.uk/environment-agency                                                 © Environment Agency 2021         5
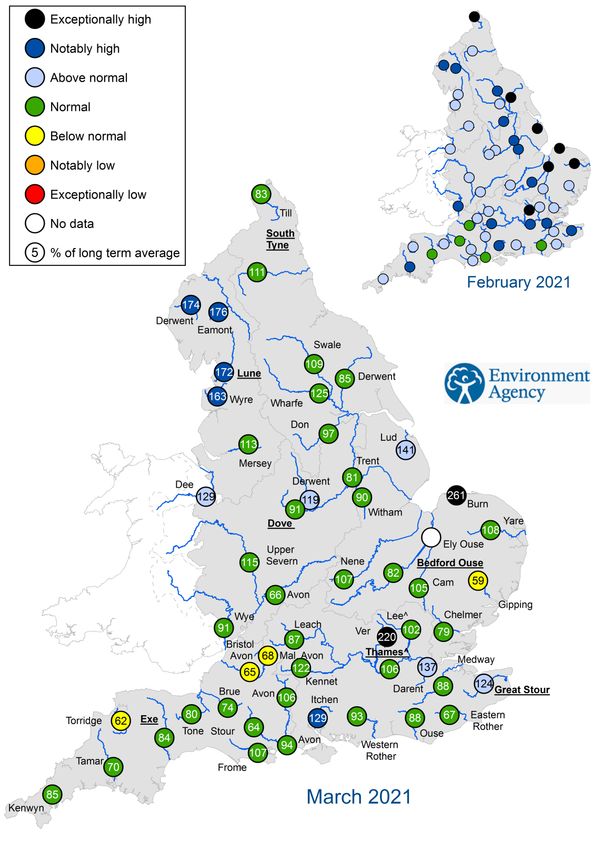
Figure 1.3: Monthly rainfall totals for the past 24 months as a percentage of the 1961 to 1990 long term average
6
Mar-21 Mar-21 Mar-21
Feb-21 Feb-21 Feb-21
© Environment Agency 2021
Jan-21 Jan-21 Jan-21
Dec-20 Dec-20 Dec-20
for each region and for England. HadUK rainfall data. (Source: Met Office © Crown Copyright, 2021).
Nov-20 Nov-20 Nov-20
Oct-20 Oct-20 Oct-20
Sep-20 Sep-20 Sep-20
Aug-20 Aug-20 Aug-20
Jul-20 Jul-20 Jul-20
South-west England
North-west England
Jun-20 Jun-20 Jun-20
Central England
May-20 May-20 May-20
Below average rainfall
Apr-20 Apr-20 Apr-20
Mar-20 Mar-20 Mar-20
Feb-20 Feb-20 Feb-20
Mar-21
Jan-20 Jan-20 Jan-20
Feb-21
Dec-19 Dec-19 Dec-19
Jan-21
Nov-19 Nov-19 Nov-19
Dec-20
Oct-19 Oct-19 Oct-19
Nov-20
Sep-19 Sep-19 Sep-19
Oct-20
Aug-19 Aug-19 Aug-19
Sep-20
Jul-19 Jul-19 Jul-19
Aug-20
Jun-19 Jun-19 Jun-19
Jul-20
May-19 May-19 May-19
Jun-20
Apr-19 Apr-19 Apr-19
May-20
0%
0%
0%
300%
250%
200%
150%
100%
400%
350%
300%
250%
200%
150%
100%
250%
200%
150%
100%
50%
50%
50%
England
Apr-20
Mar-20
Feb-20
Mar-21 Mar-21 Mar-21
Jan-20
Feb-21 Feb-21 Feb-21
Dec-19
Jan-21 Jan-21 Jan-21
Nov-19
Dec-20 Dec-20 Dec-20
Oct-19
Nov-20 Nov-20 Nov-20
Sep-19
Oct-20 Oct-20 Oct-20
Aug-19
Sep-20 Sep-20 Sep-20
Jul-19
Aug-20 Aug-20 Aug-20
Jun-19
Jul-20 Jul-20 Jul-20
South-east England
May-19
North-east England
Jun-20 Jun-20 Jun-20
www.gov.uk/environment-agency
Apr-19
East England
May-20 May-20 May-20
Above average rainfall
0%
300%
250%
200%
150%
100%
50%
Apr-20 Apr-20 Apr-20
Mar-20 Mar-20 Mar-20
Feb-20 Feb-20 Feb-20
Jan-20 Jan-20 Jan-20
Rainfall charts
Dec-19 Dec-19 Dec-19
Nov-19 Nov-19 Nov-19
Oct-19 Oct-19 Oct-19
Sep-19 Sep-19 Sep-19
Aug-19 Aug-19 Aug-19
Jul-19 Jul-19 Jul-19
Jun-19 Jun-19 Jun-19
May-19 May-19 May-19
Apr-19 Apr-19 Apr-19
0%
0%
0%
300%
250%
200%
150%
100%
350%
300%
250%
200%
150%
100%
300%
250%
200%
150%
100%
50%
50%
50%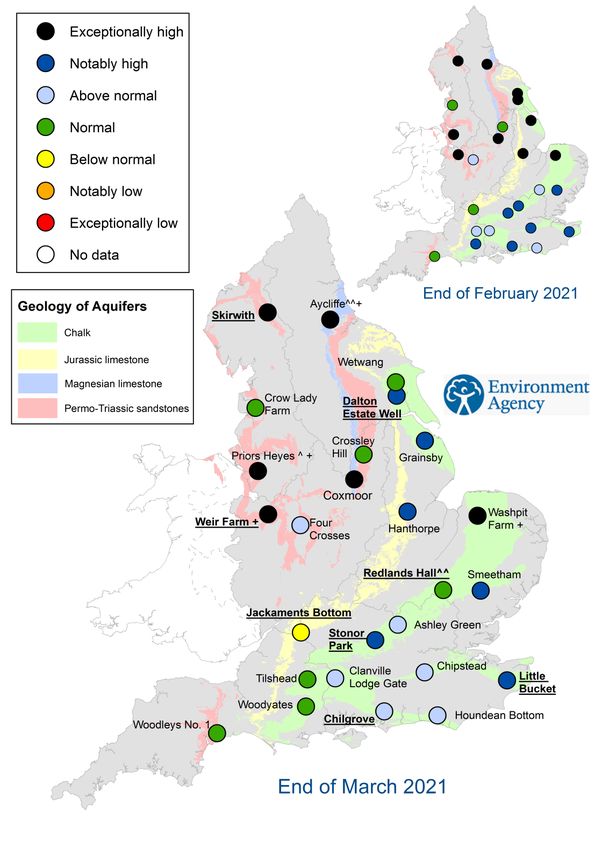
Soil moisture deficit
             End of February 20211                                     End of March 20212

Figure 2.1: Soil moisture deficits for weeks ending 02 March 2021 1 (left panel) and 30 March 2021 2 (right
panel). Top row shows actual soil moisture deficits (mm) and bottom row shows the difference (mm) of the actual
from the 1961 to 90 long term average soil moisture deficits. MORECS data for real land use (Source: Met Office
© Crown Copyright, 2021). Crown copyright. All rights reserved. Environment Agency, 100024198, 2021

www.gov.uk/environment-agency                                              © Environment Agency 2021        7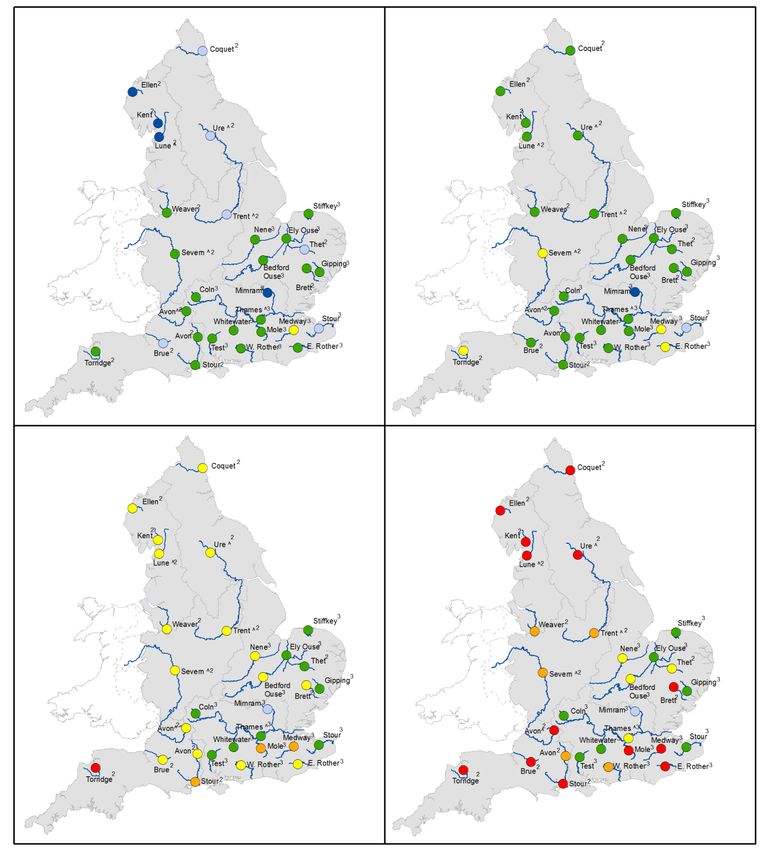
Soil moisture deficit charts
East England Central England
0 0
10 10
20 20
Soil moisture deficit (mm)
Soil moisture deficit (mm)
30 30
40 40
50 50
60 60
70 70
80 80
90 90
100 100
110 110
120 120
130 130
140 140
Apr-19 Jun-19 Aug-19 Oct-19 Dec-19 Feb-20 Apr-20 Jun-20 Aug-20 Oct-20 Dec-20 Feb-21 Apr-21 Apr-19 Jun-19 Aug-19 Oct-19 Dec-19 Feb-20 Apr-20 Jun-20 Aug-20 Oct-20 Dec-20 Feb-21 Apr-21
North-east England North-west England
0 0
10 10
20 20
Soil moisture deficit (mm)
Soil moisture deficit (mm)
30
30
40
40
50
50
60
60
70
70
80
80
90
90
100
110 100
120 110
130 120
Apr-19 Jun-19 Aug-19 Oct-19 Dec-19 Feb-20 Apr-20 Jun-20 Aug-20 Oct-20 Dec-20 Feb-21 Apr-21 Apr-19 Jun-19 Aug-19 Oct-19 Dec-19 Feb-20 Apr-20 Jun-20 Aug-20 Oct-20 Dec-20 Feb-21 Apr-21
South-east England South-west England
0 0
10 10
20
20
30
Soil moisture deficit (mm)
Soil moisture deficit (mm)
30
40
40
50
50
60
70 60
80 70
90 80
100
90
110
100
120
110
130
120
140
150 130
160 140
Apr-19 Jun-19 Aug-19 Oct-19 Dec-19 Feb-20 Apr-20 Jun-20 Aug-20 Oct-20 Dec-20 Feb-21 Apr-21 Apr-19 Jun-19 Aug-19 Oct-19 Dec-19 Feb-20 Apr-20 Jun-20 Aug-20 Oct-20 Dec-20 Feb-21 Apr-21
Below minimum Above maximum
monthly level monthly level ──── Average ──── Latest data
Figure 2.2: Latest soil moisture deficits for all geographic regions compared to maximum, minimum and 1961 to
90 long term average. Weekly MORECS data for real land use. (Source: Met Office © Crown Copyright, 2021).
www.gov.uk/environment-agency © Environment Agency 2021 8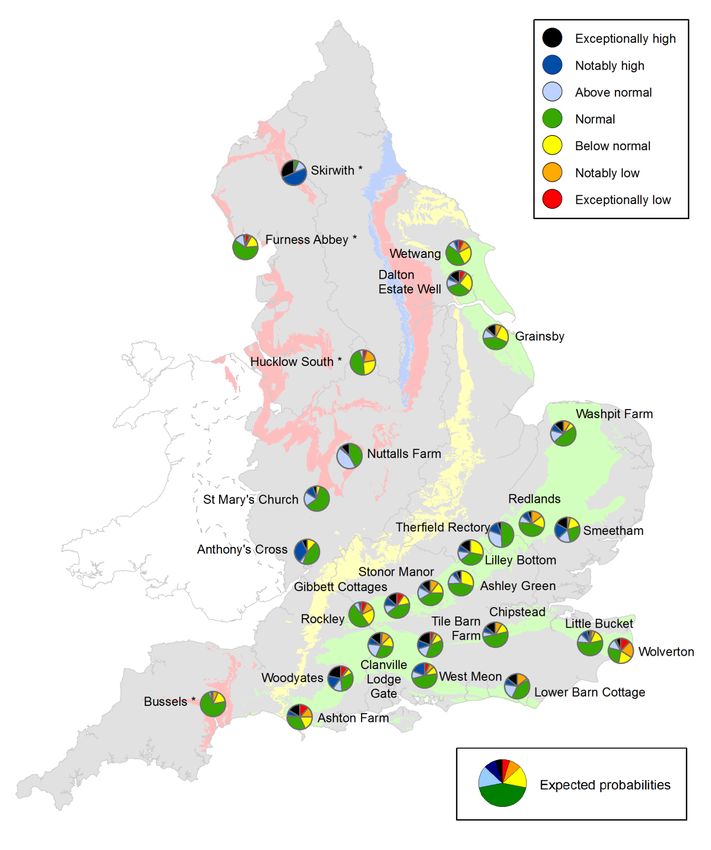
River flows

^   “Naturalised” flows are provided for the River Thames at Kingston and the River Lee at Feildes Weir
+/- Monthly mean flow is the highest/lowest on record for the current month (note that record length varies between sites)
    Underlined sites are regional index sites and are shown on the hydrographs in Figure 3.2

Figure 3.1: Monthly mean river flow for indicator sites for February and March 2021, expressed as a percentage
of the respective long term average and classed relative to an analysis of historic February and March monthly
means (Source: Environment Agency). Crown copyright. All rights reserved. Environment Agency, 100024198,
2021.

www.gov.uk/environment-agency                                                                  © Environment Agency 2021     9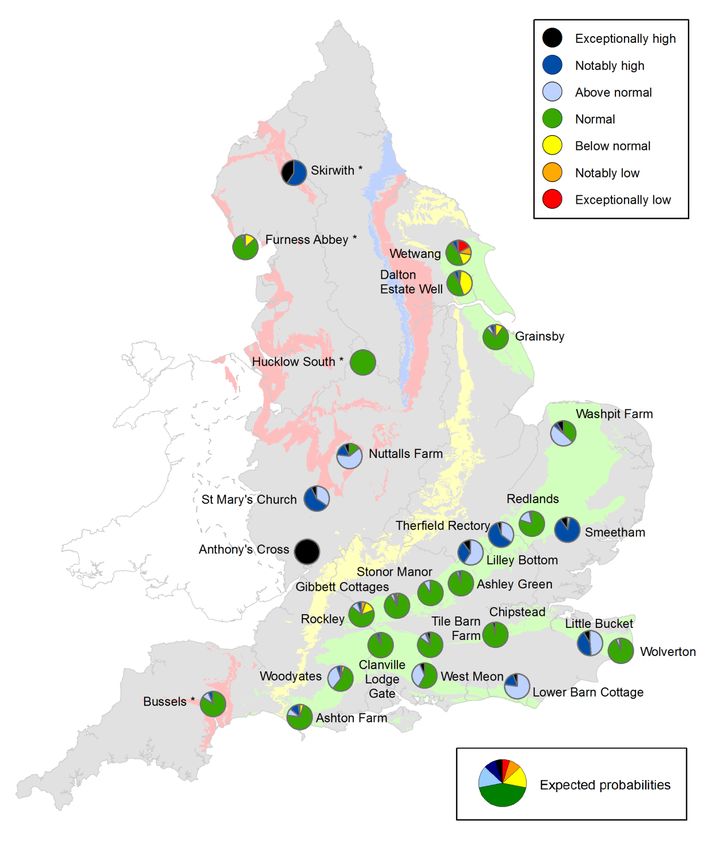
River flow charts
Exceptionally high Notably high Above normal Normal
Below normal Notably low Exceptionally low
─ ─ ─ Monthly maximum ─── Latest data ─ ─ ─ Monthly minimum
Offord, BEDFORD OUSE Marston-on-Dove, DOVE
Ranking derived from data for the period Jan-1972 to Dec-2017 Ranking derived from data for the period Jul-1965 to Dec-2017
70
50
60
40
Flow (cumecs)
Flow (cumecs)
50
40 30
30
20
20
10
10
0 0
Jun-20 Aug-20 Oct-20 Dec-20 Feb-21 Apr-21 Jun-20 Aug-20 Oct-20 Dec-20 Feb-21 Apr-21
Haydon Bridge, SOUTH TYNE Caton, LUNE
Ranking derived from data for the period Oct-1974 to Dec-2017 Ranking derived from data for the period Jan-1959 to Dec-2017
100
200
90
80
70 150
Flow (cumecs)
Flow (cumecs)
60
50
100
40
30
50
20
10
0 0
Jun-20 Aug-20 Oct-20 Dec-20 Feb-21 Apr-21 Jun-20 Aug-20 Oct-20 Dec-20 Feb-21 Apr-21
Horton, GREAT STOUR Kingston, THAMES
Ranking derived from data for the period Oct-1964 to Dec-2017 Ranking derived from data for the period Jan-1883 to Dec-2017
16 400
14 350
12 300
Flow (cumecs)
Flow (cumecs)
10 250
8 200
6 150
4 100
2 50
0 0
Jun-20 Aug-20 Oct-20 Dec-20 Feb-21 Apr-21 Jun-20 Aug-20 Oct-20 Dec-20 Feb-21 Apr-21
Thorverton, EXE
Ranking derived from data for the period Apr-1956 to Dec-2017
60
50
Flow (cumecs)
40
30
20
10
0
Jun-20 Aug-20 Oct-20 Dec-20 Feb-21 Apr-21
Figure 3.2: Index river flow sites for each geographic region. Monthly mean flow compared to an analysis of
historic monthly mean flows, long term maximum and minimum flows. (Source: Environment Agency).
www.gov.uk/environment-agency © Environment Agency 2021 10Groundwater levels
^ The level at Priors Heyes remains high compared to historic levels because the aquifer is recovering from the effects of historic abstraction
^^ Sites are manually dipped at different times during the month. They may not be fully representative of levels at the month end
+/- End of month groundwater level is the highest/lowest on record for the current month (note that record length varies between sites).
Underlined sites are major aquifer index sites and are shown in the groundwater level charts in Figure 4.2
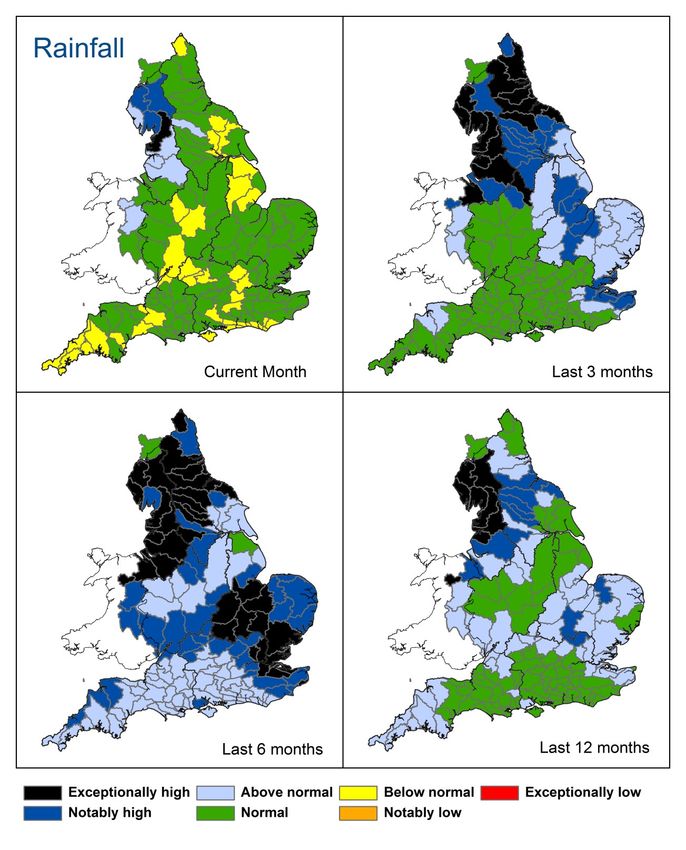
Figure 4.1: Groundwater levels for indicator sites at the end of February and March 2021, classed relative to an
analysis of respective historic February and March levels (Source: Environment Agency). Geological map
reproduced with kind permission from UK Groundwater Forum, BGS © NERC. Crown copyright. All rights
reserved. Environment Agency, 100024198, 2021.
www.gov.uk/environment-agency © Environment Agency 2021 11Groundwater level charts
Exceptionally high Notably high Above normal Normal
Below normal Notably low Exceptionally low
─ ─ ─ Monthly maximum ─── Latest data ─ ─ ─ Monthly minimum
Redlands Hall (Chalk) Weir Farm (Sandstone)
Ranking derived from data for the period Aug-1963 to Dec-2017 Ranking derived from data for the period Feb-1983 to Dec-2017
57
56
56
51
Level (mAOD)
Level (mAOD)
46 55
41 54
36 53
31 52
Jun-20 Aug-20 Oct-20 Dec-20 Feb-21 Apr-21 Jun-20 Aug-20 Oct-20 Dec-20 Feb-21 Apr-21
Dalton Holme (Chalk) Skirwith (Sandstone)
Ranking derived from data for the period Jan-1889 to Nov-2017 Ranking derived from data for the period Oct-1978 to Dec-2017
25 134
23
133
21
Level (mAOD)
Level (mAOD)
132
19
17 131
15
130
13
129
11
9 128
Jun-20 Aug-20 Oct-20 Dec-20 Feb-21 Apr-21 Jun-20 Aug-20 Oct-20 Dec-20 Feb-21 Apr-21
Chilgrove (Chalk) Little Bucket (Chalk)
Ranking derived from data for the period Feb-1836 to Dec-2017 Ranking derived from data for the period Jan-1971 to Dec-2017
77
85
72
67 80
Level (mAOD)
Level (mAOD)
62
75
57
52 70
47 65
42
60
37
32 55
Jun-20 Aug-20 Oct-20 Dec-20 Feb-21 Apr-21 Jun-20 Aug-20 Oct-20 Dec-20 Feb-21 Apr-21
Jackaments Bottom (Jurassic Limestone) Stonor Park (Chalk)
Ranking derived from data for the period Jan-1974 to Dec-2017 Ranking derived from data for the period May-1961 to Dec-2017
107
90
105
103 85
Level (mAOD)
Level (mAOD)
101 80
99 75
97
70
95
93 65
91 60
Jun-20 Aug-20 Oct-20 Dec-20 Feb-21 Apr-21 Jun-20 Aug-20 Oct-20 Dec-20 Feb-21 Apr-21
Figure 4.2: Index groundwater level sites for major aquifers. End of month groundwater levels months compared
to an analysis of historic end of month levels and long term maximum and minimum levels. (Source: Environment
Agency, 2021).
www.gov.uk/environment-agency © Environment Agency 2021 12Reservoir storage 1. Current levels at Kielder are lower than historical levels due to the implementation of a new flood alleviation control curve 2. Vyrnwy, Clywedog and Elan Valley reservoirs are located in Wales but provide a water resource to Central and north-west England Figure 5.1: Reservoir stocks at key individual and groups of reservoirs at the end of February and March 2021 as a percentage of total capacity and classed relative to an analysis of historic February and March values respectively (Source: Water Companies). Note: Classes shown may not necessarily relate to control curves or triggers for drought actions. As well as for public water supply, some reservoirs are drawn down to provide flood storage, river compensation flows or for reservoir safety inspections. In some cases current reservoir operating rules may differ from historic ones. Crown copyright. All rights reserved. Environment Agency, 100024198, 2021. www.gov.uk/environment-agency © Environment Agency 2021 13
Reservoir storage charts
East England Central England
Based on storage in Abberton, Grafham, Hanningfield, Rutland reservoirs Based on storage in Clywedog, Blithfield, Carsington and Ogston, Derwent Valley, Dove (Foremark &
Staunton), Draycote, Elan Valley Group reservoirs
100 100
90 90
Percentage of total capacity
Percentage of total capacity
80 80
70 70
60 60
50 50
40 40
30 30
20 20
10 10
0 0
Sep-19 Nov-19 Jan-20 Mar-20 May-20 Jul-20 Sep-20 Nov-20 Jan-21 Mar-21 Sep-19 Nov-19 Jan-20 Mar-20 May-20 Jul-20 Sep-20 Nov-20 Jan-21 Mar-21
North-east England North-west England
Based on storage in Kielder, Teesdale Group, Yorkshire Supply Group reservoirs Based on storage in Haweswater&Thirlmere, Pennines Combined, Vyrnwy, Dee System reservoirs
100 100
90 90
Percentage of total capacity
Percentage of total capacity
80 80
70 70
60 60
50 50
40 40
30 30
20 20
10 10
0 0
Sep-19 Nov-19 Jan-20 Mar-20 May-20 Jul-20 Sep-20 Nov-20 Jan-21 Mar-21 Sep-19 Nov-19 Jan-20 Mar-20 May-20 Jul-20 Sep-20 Nov-20 Jan-21 Mar-21
South-east England South-west England
Based on storage in Ardingly, Bewl, Bough Beech, Farmoor, Lower Lee Group, Lower Thames Group Based on storage in Blagdon, Chew Valley, Clatworthy, Colliford, Roadford, Stithians, Wimbleball
reservoirs reservoirs
100 100
90 90
Percentage of total capacity
Percentage of total capacity
80 80
70 70
60 60
50 50
40 40
30 30
20 20
10 10
0 0
Sep-19 Nov-19 Jan-20 Mar-20 May-20 Jul-20 Sep-20 Nov-20 Jan-21 Mar-21 Sep-19 Nov-19 Jan-20 Mar-20 May-20 Jul-20 Sep-20 Nov-20 Jan-21 Mar-21
England
Based on combined regional storage
100
90
Percentage of total capacity
80
70
60
50
40
30
20
10
0
Sep-19 Nov-19 Jan-20 Mar-20 May-20 Jul-20 Sep-20 Nov-20 Jan-21 Mar-21
Below minimum Above maximum
monthly level monthly level ──── Average ──── Latest data
Figure 5.2: Regional reservoir stocks. End of month reservoir stocks compared to long term maximum, minimum
and average stocks (Source: Water Companies). Note: Historic records of individual reservoirs/reservoir groups
making up the regional values vary in length.
www.gov.uk/environment-agency © Environment Agency 2021 14Forward look: river flow
Rainfall greater than Rainfall greater than
120% LTA during 100% LTA during
Apr to Sep has Apr to Sep has
occurred in 17 to occurred in 50 to
24% of years1 in the 54% of years1 in the
historic record (since historic record (since
1891) 1891)
(a) (b)
Rainfall less than Rainfall less than
80% LTA during Apr 60% LTA during Apr
to Sep has occurred to Sep has occurred
in 13 to 20% of in 0 to 2% of years1
years1 in the historic in the historic record
record (since 1891) (since 1891)
(d)
(c)
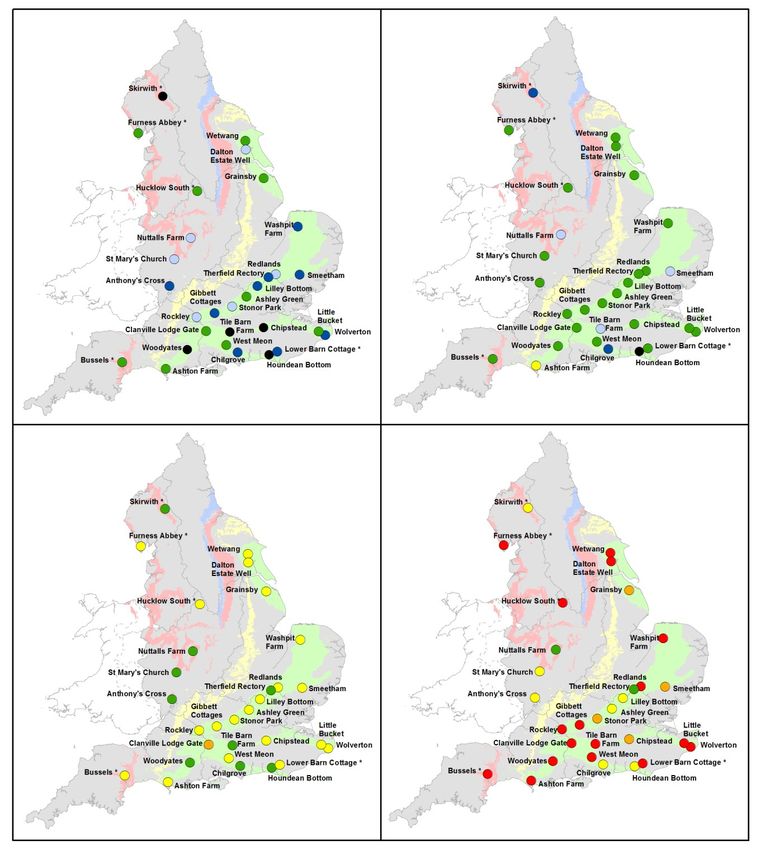
Figure 6.1: Projected river flows at key indicator sites up until the end of September 2021. Projections based on four
scenarios: 120% (a), 100% (b), 80% (c) and 60% (d) of long term average rainfall between April 2021 and September
2021 (Source: Centre for Ecology and Hydrology, Environment Agency)
1
This range of probabilities is a regional analysis
2
Projections for these sites are produced by CEH
3
Projections for these sites are produced by the Environment Agency
^ “Naturalised” flows are projected for these sites
www.gov.uk/environment-agency © Environment Agency 2021 15Rainfall greater than Rainfall greater than
120% LTA during 100% LTA during
Apr to Mar has Apr to Mar has
occurred in 8 to 16% occurred in 53 to
of years1 in the 60% of years1 in the
historic record (since historic record (since
1891) 1891)
(a) (b)
Rainfall less than Rainfall less than
80% LTA during Apr 60% LTA during Apr
to Mar has occurred to Mar has occurred
in 4 to 10% of years1 in 0% of years1 in
in the historic record the historic record
(since 1891) (since 1891)
(d)
(c)
Figure 6.2: Projected river flows at key indicator sites up until the end of March 2022. Projections based on four
scenarios: 120% (a), 100% (b), 80% (c) and 60% (d) of long term average rainfall between April 2021 and March 2022
(Source: Centre for Ecology and Hydrology, Environment Agency)
1
This range of probabilities is a regional analysis
2
Projections for these sites are produced by CEH
3
Projections for these sites are produced by the Environment Agency
^ “Naturalised” flows are projected for these sites
www.gov.uk/environment-agency © Environment Agency 2021 16Exceptionally high or low levels are those which would typically occur 5% of the time within the historic record. Notably high or low levels are those which would typically occur 8% of the time. Above normal or below normal levels are those which would typically occur 15% of the time. Normal levels are those which would typically occur 44% of the time within the historic record. Figure 6.3: Probabilistic ensemble projections of river flows at key indicator sites up until the end of September 2021. Pie charts indicate probability, based on climatology, of the surface water flow at each site being e.g. exceptionally low for the time of year. (Source: Centre for Ecology and Hydrology, Environment Agency). 1 Projections for these sites are produced by the Environment Agency 2 Projections for these sites are produced by CEH ^“Naturalised” flows are projected for these sites www.gov.uk/environment-agency © Environment Agency 2021 17
Exceptionally high or low levels are those which would typically occur 5% of the time within the historic record. Notably high or low levels are those
which would typically occur 8% of the time. Above normal or below normal levels are those which would typically occur 15% of the time. Normal
levels are those which would typically occur 44% of the time within the historic record.

Figure 6.4: Probabilistic ensemble projections of river flows at key indicator sites up until the end of March 2022. Pie
charts indicate probability, based on climatology, of the surface water flow at each site being e.g. exceptionally low for
the time of year. (Source: Centre for Ecology and Hydrology, Environment Agency).

1
  Projections for these sites are produced by the Environment Agency
2
  Projections for these sites are produced by CEH
^“Naturalised” flows are projected for these sites

www.gov.uk/environment-agency                                                                     © Environment Agency 2021                 18
Forward look: groundwater
Rainfall greater than Rainfall greater than
120% LTA during 100% LTA during
Apr to Sep has Apr to Sep has
occurred in 17 to occurred in 50 to
24% of years1 in the 54% of years1 in the
historic record (since historic record (since
1891) 1891)
(b)
(a)
Rainfall less than Rainfall less than
80% LTA during Apr 60% LTA during Apr
to Sep has occurred to Sep has occurred
in 13 to 20% of in 0 to 2% of years1
years1 in the historic in the historic record
record (since 1891) (since 1891)
(c) (d)
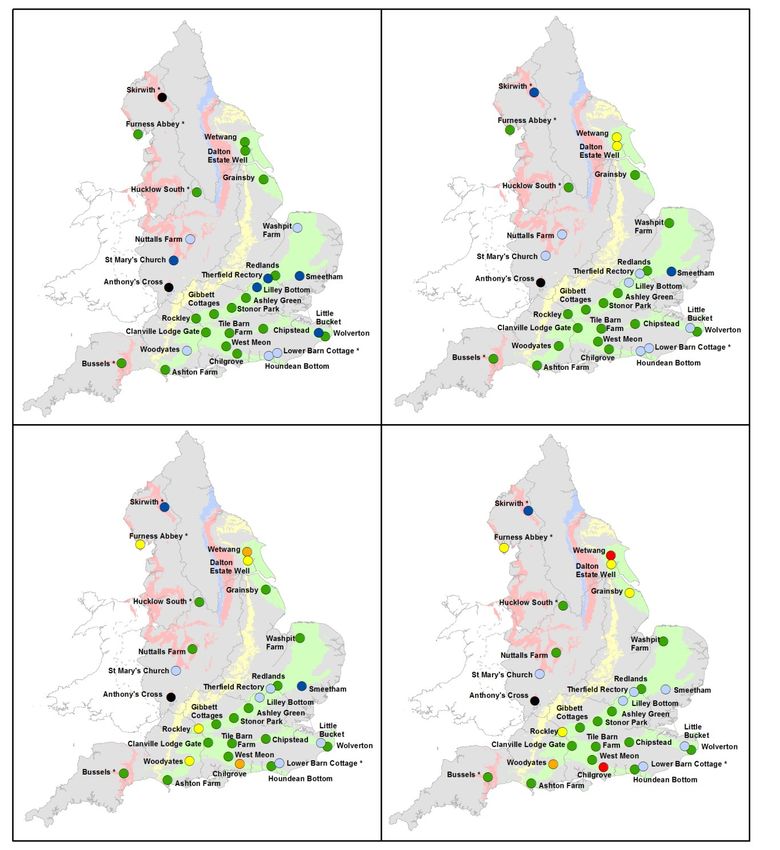
Figure 6.5: Projected groundwater levels at key indicator sites at the end of September 2021. Projections based on
four scenarios: 120% (a), 100% (b), 80% (c) and 60% (d) of long term average rainfall between April 2021 and
September 2021 (Source: Environment Agency) Geological map reproduced with kind permission from UK
Groundwater Forum BGS © NERC. Crown copyright all rights reserved. Environment Agency 100024198, 2021.
* Projections for these sites are produced by BGS
1
This range of probabilities is a regional analysis
www.gov.uk/environment-agency © Environment Agency 2021 19Rainfall greater than Rainfall greater than
120% LTA during 100% LTA during
Apr to Mar has Apr to Mar has
occurred in 8 to 16% occurred in 53 to
of years1 in the 60% of years1 in the
historic record (since historic record (since
1891) 1891)
(a) (b)
Rainfall less than Rainfall less than
80% LTA during Apr 60% LTA during Apr
to Mar has occurred to Mar has occurred
in 4 to 10% of years1 in 0% of years1 in
in the historic record the historic record
(since 1891) (since 1891)
(c) (d)
Figure 6.6: Projected groundwater levels at key indicator sites at the end of March 2022. Projections based on four
scenarios: 120% (a), 100% (b), 80% (c) and 60% (d) of long term average rainfall between April 2021 and March
2022 (Source: Environment Agency) Geological map reproduced with kind permission from UK Groundwater Forum
BGS © NERC Crown copyright. All rights reserved. Environment Agency 100024198 2021.
* Projections for these sites are produced by BGS
1
This range of probabilities is a regional analysis
www.gov.uk/environment-agency © Environment Agency 2021 20Exceptionally high or low levels are those which would typically occur 5% of the time within the historic record. Notably high or low levels are those which would typically occur 8% of the time. Above normal or below normal levels are those which would typically occur 15% of the time. Normal levels are those which would typically occur 44% of the time within the historic record. Figure 6.7: Probabilistic ensemble projections of groundwater levels at key indicator sites at the end of September 2021. Pie charts indicate probability, based on climatology, of the groundwater level at each site being e.g. exceptionally low for the time of year. (Source: Environment Agency) Geological map reproduced with kind permission from UK Groundwater Forum, BGS © NERC. Crown copyright. All rights reserved. Environment Agency, 100024198, 2021. * Projections for these sites are produced by BGS www.gov.uk/environment-agency © Environment Agency 2021 21
Exceptionally high or low levels are those which would typically occur 5% of the time within the historic record. Notably high or low levels are those
which would typically occur 8% of the time. Above normal or below normal levels are those which would typically occur 15% of the time. Normal
levels are those which would typically occur 44% of the time within the historic record.

Figure 6.8: Probabilistic ensemble projections of groundwater levels at key indicator sites at the end of March 2022.
Pie charts indicate probability, based on climatology, of the groundwater level at each site being e.g. exceptionally
low for the time of year. (Source: Environment Agency) Geological map reproduced with kind permission from UK
Groundwater Forum, BGS © NERC. Crown copyright. All rights reserved. Environment Agency, 100024198, 2021.

* Projections for these sites are produced by BGS

www.gov.uk/environment-agency                                                                     © Environment Agency 2021                 22
Figure 7.1: Geographic regions

Crown copyright. All rights reserved. Environment Agency, 100024198, 2021.

www.gov.uk/environment-agency                                            © Environment Agency 2021   23
Glossary
     Term                          Definition
     Aquifer                       A geological formation able to store and transmit water.
     Areal average rainfall        The estimated average depth of rainfall over a defined area. Expressed in
                                   depth of water (mm).
     Artesian                      The condition where the groundwater level is above ground surface but is
                                   prevented from rising to this level by an overlying continuous low
                                   permeability layer, such as clay.
     Artesian borehole             Borehole where the level of groundwater is above the top of the borehole
                                   and groundwater flows out of the borehole when unsealed.
     Cumecs                        Cubic metres per second (m 3s-1)
     Effective rainfall            The rainfall available to percolate into the soil or produce river flow.
                                   Expressed in depth of water (mm).
     Flood Alert/Flood Warning     Three levels of warnings may be issued by the Environment Agency. Flood
                                   Alerts indicate flooding is possible. Flood Warnings indicate flooding is
                                   expected. Severe Flood Warnings indicate severe flooding.
     Groundwater                   The water found in an aquifer.
     Long term average (LTA)       The arithmetic mean, calculated from the historic record. For rainfall and
                                   soil moisture deficit, the period refers to 1961 to 1990, unless otherwise
                                   stated. For other parameters, the period may vary according to data
                                   availability
     mAOD                          Metres Above Ordnance Datum (mean sea level at Newlyn Cornwall).
     MORECS                        Met Office Rainfall and Evaporation Calculation System. Met Office service
                                   providing real time calculation of evapotranspiration, soil moisture deficit
                                   and effective rainfall on a 40 x 40 km grid.
     Naturalised flow              River flow with the impacts of artificial influences removed. Artificial
                                   influences may include abstractions, discharges, transfers, augmentation
                                   and impoundments.
     NCIC                          National Climate Information Centre. NCIC area monthly rainfall totals are
                                   derived using the Met Office 5 km gridded dataset, which uses rain gauge
                                   observations.
     Recharge                      The process of increasing the water stored in the saturated zone of an
                                   aquifer. Expressed in depth of water (mm).
     Reservoir gross capacity      The total capacity of a reservoir.
     Reservoir live capacity       The capacity of the reservoir that is normally usable for storage to meet
                                   established reservoir operating requirements. This excludes any capacity
                                   not available for use (e.g. storage held back for emergency services,
                                   operating agreements or physical restrictions). May also be referred to as
                                   ‘net’ or ‘deployable’ capacity.
     Soil moisture deficit (SMD)   The difference between the amount of water actually in the soil and the
                                   amount of water the soil can hold. Expressed in depth of water (mm).
     Categories
     Exceptionally high            Value likely to fall within this band 5% of the time
     Notably high                  Value likely to fall within this band 8% of the time
     Above normal                  Value likely to fall within this band 15% of the time
     Normal                        Value likely to fall within this band 44% of the time
     Below normal                  Value likely to fall within this band 15% of the time
     Notably low                   Value likely to fall within this band 8% of the time
     Exceptionally low             Value likely to fall within this band 5% of the time

www.gov.uk/environment-agency
You can also read