2018: The Year of Toxic Algal Blooms - Karl Morgenstern, Eugene Water & Electric Board
←
→
Page content transcription
If your browser does not render page correctly, please read the page content below
2018: The Year of Toxic Algal Blooms
Karl Morgenstern, Eugene Water & Electric Board

McKenzie Watershed Council Meeting, September 13, 2018

Discussion Summary
• Background on Harmful Algal Blooms &
  Cyanotoxins
• What Happened in 2018
  – Salem/North Santiam River
  – McKenzie River
• Factors that will influence toxic blooms in
  future
• What is being done to prepare and respond
  to future blooms

Harmful Algal Blooms
“Blue-green algae” are actually
not algae at all but single-celled
organisms called cyanobacteria.
Cyanobacteria are
photosynthetic bacteria that
share some properties with algae
and are found naturally in
freshwater and saltwater. Some
species of cyanobacteria can
produce toxins, which are known
to be harmful to human health
above a certain level.
Light Intensity & Total Sunlight Duration
Nutrient Availability (especially Phosphorus)
Warmer Water Temps
Higher pH
Precipitation Events
Slow Moving & Stratified Water
Low Zooplankton Grazing Pressure
Algal Toxins A New and Emerging Problem
              Philosophical Transactions of the Royal Society
                                       No. 83 pg 4069
                   Letter to the Editor, December 19, 1671

           “Account of an Inland Sea (or Lake) near Dantzick,
           yielding at certain season of the year a green
           substance, which causes certain death”
                                                         - Mr. Christopher Kirkby

           …The water sweet and wholesome; but only in the three summer months,
           June, July, and August, it becomes every year, during the dry weather,
           green in the middle, with a hairy efflorescence, which green substance,
           being by some violent wind forced ashore, and with the water drunk by
           any cattle, dog, or poultry, causes certain and sudden death; whereas at the
           same time, that a knowing and ingenuous person saw three dogs killed
           with this…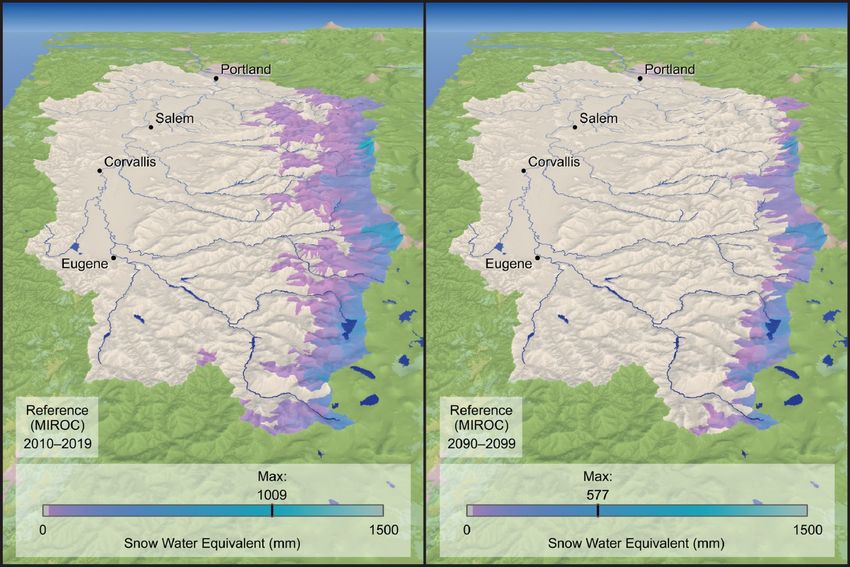
Cyanobacteria Facts
• One of the oldest life forms on earth, 3+ billion years old.
• Occur naturally in both terrestrial and aquatic environments.
• Several thousand species have been identified, but estimates
  suggest this represents less than half of all living species.
• Although commonly referred to as blue-green algae,
  cyanobacteria are actually photosynthetic bacteria.
   – Created earth’s O2 atmosphere
• Some species capable of producing toxins.
• Many species can fix nitrogen.
• All need a source of phosphorus
• Can regulate buoyancy
Cyanobacteria Morphology
    Cyanobacteria can be unicellular, colonial or
    filamentous.
Suspended Phytoplankton         Benthic Periphyton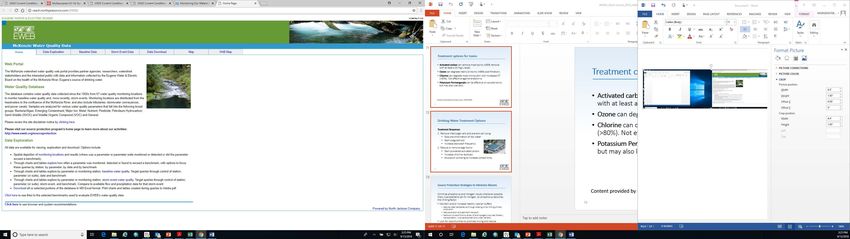
Cell Structure – Dolichospermum
            Example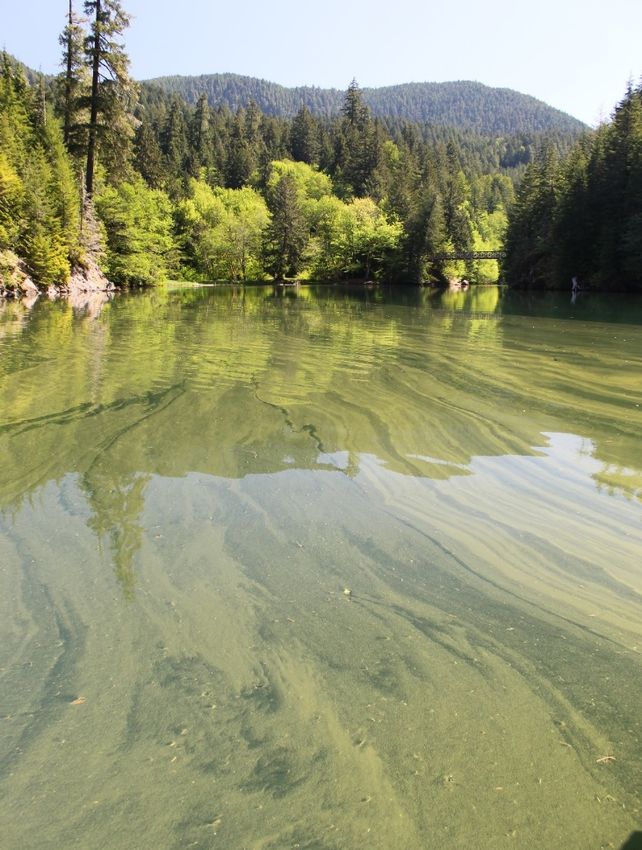
Life Cycle – Dolichospermum
          Example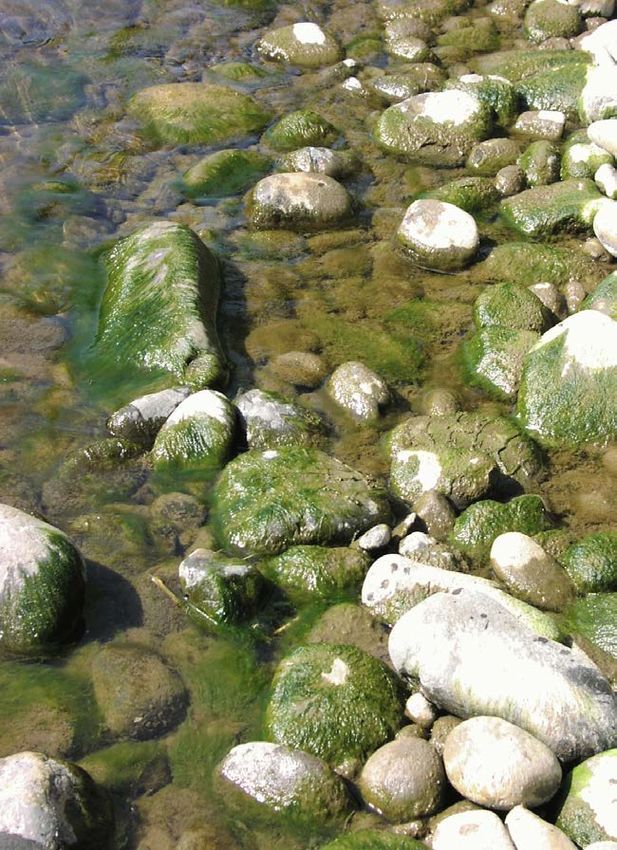
Potentially Toxic Suspended
    Planktonic Cyanobacteria

  Dolichospermum        Aphanizomenon      Gloeotrichia
(formerly Anabaena)

          Microcystis               Cylindrospermopsis

   Photos by Kurt Carpenter and Barry Rosen, USGS
Potentially Toxic Benthic
Cyanobacteria
Oscillatoria Nostoc
Photos by Kurt Carpenter, USGS
11Potential drinking water impacts
from HABs
• Cyanotoxins – hard to treat
• Dissolved Organic Matter
– Precursor to disinfection by-products
(DBPs)
• Taste and odor issues
• Turbidity & intake clogging
• Increased diurnal pH/DO cyclesToxins associated with various
Cyanobacteria
Genus of Algae Toxin Produced Toxin Type
Dolichospermum Anatoxin, Saxitoxin Neurotoxin
(Anabaena) Microcystin, Cylindrospermopsin Hepatotoxin
Anatoxin, Saxitoxin Neurotoxin
Aphanizomenon
Cylindrospermopsin Hepatotoxin
Planktothrix Anatoxin Neurotoxin
(Oscillatoria) Cylindrospermopsin, Microcystin Hepatotoxin
Cylindrospermopsis Cylindrospermopsin Hepatotoxin
Gloeotrichia Microcystin Hepatotoxin
Microcystis Microcystin Hepatotoxin
Slide content provided by OHA
All species produce Lipopolysaccharides that can cause
skin irritation.Cyanotoxin Challenges • Toxins can potentially pass through treatment systems. • Toxin levels don’t often correlate with cell counts. • Toxin sources may be located a considerable distance upstream of drinking water intakes. • Oxidation and other treatment processes can lyse cells and potentially release toxins.
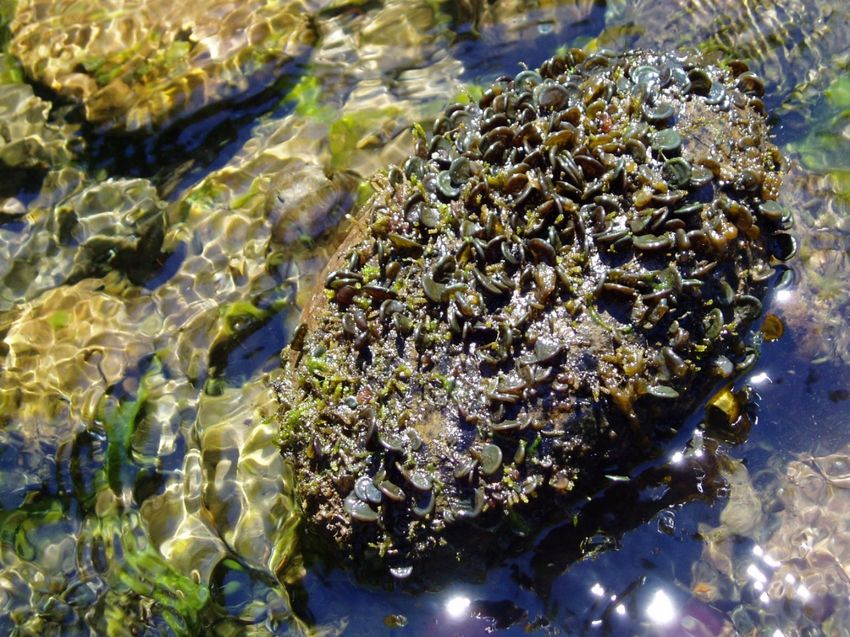
How Can You Tell if Toxins are
Present?
http://www.wunderground.com/wximage/avtanski/7 http://www.pressdemocrat.com/news/4605806-181/mystery-fish-deaths-in-clear
Not This One Not This One
http://images.fineartamerica.com/images-medium-large/1-clearlake-california-tomiko-saji.jpg
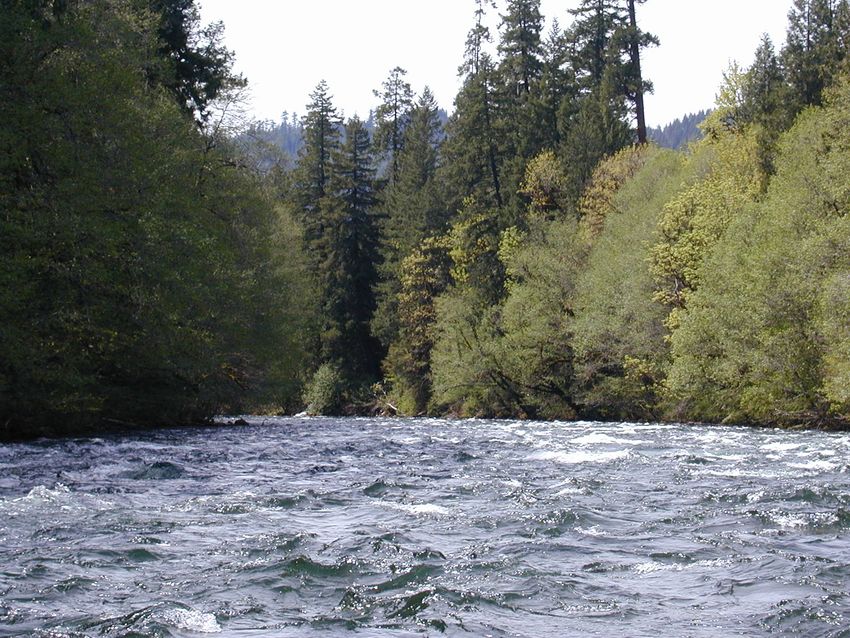
Which one of these contain 72 ug/L of Microcystin-LR?Salem’s Drinking Water Source and System
Near Log Boom – May 14, 2018

                             Heater Arm – May 14, 2018

Blowout Arm – May 14, 2018
What Happened in Salem?
• May 8, 2018 - Staff noticed an algal bloom on Detroit Lake
– Staff increased sampling efforts and began toxin sampling
• On May 25 - Staff received data that indicated detection above Health Advisory
levels
– Staff held conference call with OHA; received information that EPA
guidelines allow for 10-day “cushion” so utilities can make treatment
adjustments and resample.
– Operational changes made on May 25 and May 26 – switch to well water at
Geren Island, activate ASR wells, activate Salem-Keizer intertie.
• May 27 – Large leak on Transmission Line #2 – went back to surface water to
keep up with demand; daily sampling started.
• May 28 – Staff repairing Transmission Line #2
• May 29 – Conference call with OHA, EPA – Vulnerable Population Health
Advisory issued in late afternoonSalem’s Water System
1- River 2- Pre-treatment 3-Filtration
Intake
4- Disinfection & Fluoridation 5- Corrosion Control 6- DeliveryChallenges • EPA Guidelines for two different groups with a 10-day exposure • Communication with critical customers • Emergency alerts and Public Notification Issues • Water Distribution Sites • Run on bottled water supplies • Internal communications – arming staff with critical information • Messaging for internal and external customers • ELISA vs. LCMSMS • Delay in receipt of data from contracted labs
Raw Water Results for Cylindrospermopsin
                                      Raw Water Sample Result
                                                                   Result
                 0.16
                                                                   MDL

                                         ?                         MRL
                 0.14

                 0.12

                  0.1
Result in ug/L

                 0.08

                 0.06

                 0.04

                 0.02

                   0

                                          Date Sampled
EWEB Treatment Response • Turn off pre-chlorination • Feed carbon into raw water basins • Increase post filter chlorination
Warmer winters reduce snowpacks by 63-95%

                          Courtesy WW2100; do not cite
Climate Change Impacts to SWE
• Loss of snow pack in 3,000’ to 4,500’ zone
• 56% of volume of water currently stored as snow
• Equivalent of two Cougar Reservoirs, or ~ 400,000
acre feet
• More rain on snow events
• Peak spring snow melt/runoff happens 12 days
earlier
Higher temps/longer dry
Season = Increased HABs
(Sproles et. al., 2013)Frequency of Occurrence
Standard Deviation – Extreme Hot Weather
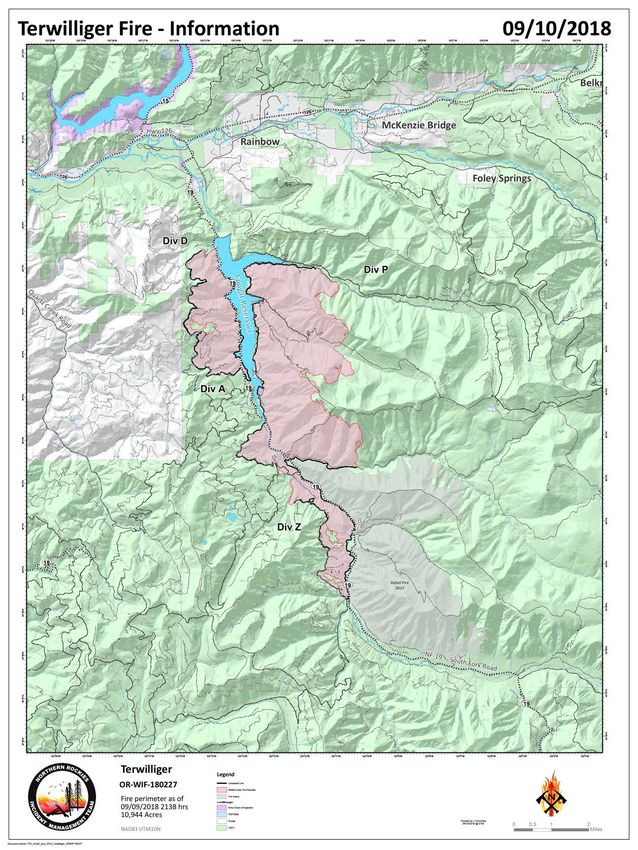
(Hansen et. al., 2012)Increasing frequency & scale of wildfires across the west Wildfires appear to provide nutrient loads during winter flushing from storms. Increased nutrients mean increased blooms
What Are We Doing?
• Research to increase understanding
• Multi-Faceted Monitoring Approach
  – New OHA rules = more data across OR

• Real-Time Assessment Tools
• Increasing Analytical Lab Capabilities
• Increasing Treatment Capabilities
• Interagency Coordination & Response
OSU/EWEB research project
To assess nutrient, carbon,
Metals, bacteria loads.

Focusing on fall/early winter
Storms

Require USFS assistance to
gain access to areas for study
Harmful Algal Bloom Sampling – every 2 weeks
Multi-Faceted Monitoring
• Sample every 2 weeks at Cougar/Blue River
reservoir & outfall, and EWEB intake
– For nutrients, cell counts, cyanotoxins, organic
carbon, and general WQ parameters
– Toxin hits increase to weekly
• USGS SPATT deployments (leave in water
for 30 days)
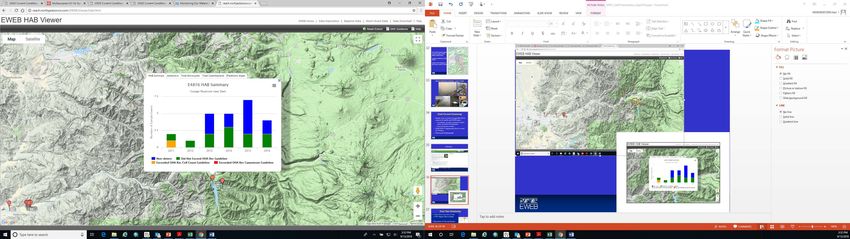
• Microscope ID/photographEWEB.ORG
Real-Time Monitoring
• % flow from reservoirs at Vida
  (>30% triggers alarm at plant)

• WQ sondes at Vida and Hayden
  Bridge

• Future: Add floating WQ sonde in
  Cougar Reservoir for vertical
  monitoring
39
Fluorescence

Example EEM showing       Emission (nm)
fDOM region and
selected fluorescence
peaks                                     Excitation (nm)

        Content provided by Kurt Carpenter, USGS
Organic Carbon Study
Excitation-
Emission
Matrices
(EEMs) of 5
C1 C2 C3
types of
McKenzie
River Basin
carbon sources
C4 C5
Content provided by Kurt Carpenter, USGSIncreased Analytical Capabilities
• EWEB WQ Lab increased its capabilities
– Currently: bacteria, nutrients, UV254
– Purchased ELISA equipment to analyze for
cyanotoxins
– Future: TOC & DOC
• Quick turnaround, ability to handle samples
at moments notice, significantly reduced
cost, good QA/QCEWEB Water Treatment Options
Treatment Responses
1.Remove intact algal cells and prevent cell
lysing
– Stop pre-chlorination of raw water
– Start coagulant aid
– Increase backwash frequency
2.Reduce or remove algal toxins
– Start powdered activated carbon
– Increase chlorine residuals
– Slowdown pumping to increase contact time
Piloting biofilter approach with U of TInteragency Coordination
Preliminary thoughts around increased
EWEB/ACOE Coordination:
• Weekly prediction on dam operations
• When algal blooms are occurring in reservoirs
• When blooms are producing cyanotoxins
• Reduce quantity
• Increase physical release point in Cougar
• EWEB access for more efficient monitoring
• Share data via web-based toolswww.eweb.org/sourceprotection
Contact Karl Morgenstern at:
(541) 685-7365 or via e-mail Karl.morgenstern@eweb.orgYou can also read