Estimation of winter soil cover by vegetation before spring-sown crops for mainland France using multispectral satellite imagery - IOPscience
←
→
Page content transcription
If your browser does not render page correctly, please read the page content below
LETTER • OPEN ACCESS

Estimation of winter soil cover by vegetation before spring-sown crops
for mainland France using multispectral satellite imagery
To cite this article: Benjamin Nowak et al 2021 Environ. Res. Lett. 16 064024

View the article online for updates and enhancements.

                               This content was downloaded from IP address 46.4.80.155 on 16/08/2021 at 08:27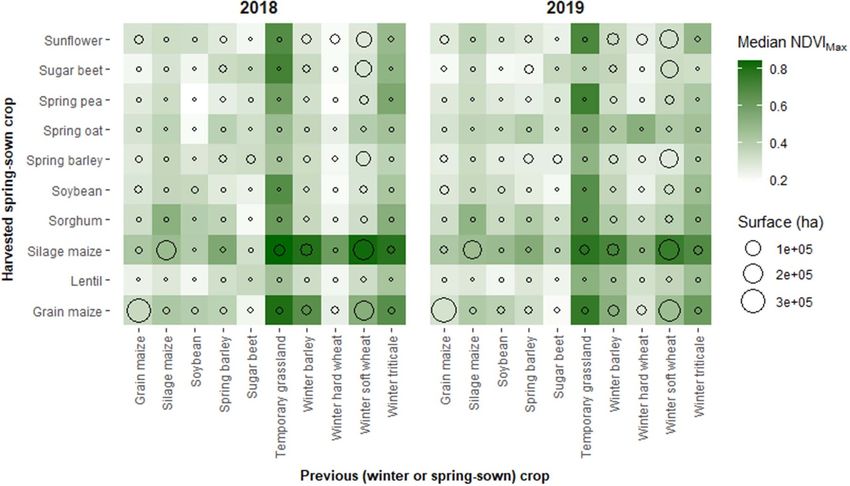
Environ. Res. Lett. 16 (2021) 064024                                                    https://doi.org/10.1088/1748-9326/ac007c

                              LETTER

                              Estimation of winter soil cover by vegetation before spring-sown
OPEN ACCESS
                              crops for mainland France using multispectral satellite imagery
RECEIVED
25 January 2021               Benjamin Nowak1,∗, Gaëlle Marliac2 and Audrey Michaud3
REVISED                       1
11 May 2021                       Université Clermont Auvergne, AgroParisTech, INRAE, VetAgro Sup, UMR Territoires, F-63370 Lempdes, France
                              2
                                  Université Clermont Auvergne, INRAE, UMR GDEC, F-63000 Clermont-Ferrand, France
ACCEPTED FOR PUBLICATION      3
12 May 2021
                                  Université Clermont Auvergne, INRAE, VetAgro Sup, UMR Herbivores, 63122 Saint-Genès-Champanelle, France
                              ∗
                                  Author to whom any correspondence should be addressed.
PUBLISHED
24 May 2021                   E-mail: bjn.nowak@gmail.com

                              Keywords: agriculture, remote sensing, cover crops, cropping systems, global agronomy
Original content from
this work may be used
under the terms of the
Creative Commons
Attribution 4.0 licence.      Abstract
Any further distribution      Winter soil cover by vegetation is associated with multiple benefits. In this study, winter soil cover
of this work must
maintain attribution to
                              rate before spring-sown crops was estimated for mainland France from multispectral imagery. For
the author(s) and the title   67% and 84% of the area under spring-sown crops for years 2018 and 2019, soil cover during the
of the work, journal
citation and DOI.             previous winter was estimated through the computation of the Normalized Difference Vegetation
                              Index (NDVI), using Sentinel-2 multispectral images. At country scale, winter soil cover rate
                              before spring-sown crops was estimated between 37% and 48% for 2018 and between 31% and
                              43% for 2019, depending on the NDVI threshold for a soil to be considered covered by at least 50%
                              of vegetation. Spatial patterns were relatively similar between the two years studied, highlighting
                              strong heterogeneities between French departments. Cropping systems may explain some of these
                              heterogeneities, as it has been shown that there is a large variability in the soil cover rate between
                              spring-sown crops, but also depending on the previous crop. Winter soil cover rate was higher for
                              crops associated with livestock production, such as maize silage (between 59% and 74% of plots
                              covered before this crop). It was also shown that winter soil cover could be ensured by other means
                              than cover crops: temporary grasslands were the previous crop with the highest soil cover, probably
                              due to late ploughing. For these reasons, mixed systems combining livestock and crop productions
                              may be a solution to increase winter soil cover before spring-sown crops.

                              1. Introduction                                                         Assessing soil cover by vegetation before spring-
                                                                                                 sown crops is a necessary step in order to define effect-
                              Bare soils during winter can result in environmental               ive policies to promote the adoption of cover crops.
                              damage while the introduction of cover crops before                Satellite-based methods offer new possibilities to
                              spring-sown crops has the potential to increase the                monitor crop development on a large scale [7], in par-
                              ecosystem services provided by agricultural systems                ticular through the computation of the Normalized
                              [1]. Nutrient uptake by plants reduces losses related              Difference Vegetation Index (NDVI) from multi-
                              to leaching during the winter period, when soils are               spectral images [8]. This index is especially appropri-
                              frequently saturated with water [2]. In this regard,               ate for monitoring winter soil cover because, contrary
                              winter soil cover is one of the good agricultural prac-            to biomass, soil cover has a linear relationship with
                              tices promoted by the European Nitrate Directive to                NDVI [9]. Several studies have therefore used remote
                              reduce water pollution by nitrates in sensitive zones              sensing data to evaluate soil cover during winter, as
                              [3]. Winter soil cover also slows down surface run-                discussed below.
                              off, thus limiting erosion [4]. Moreover, it provides an                Concerning recent trends, winter soil cover
                              opportunity to increase soil carbon storage [5]. Des-              before maize increased between 2009 and 2013 in
                              pite these advantages, the adoption of cover crops is              Pennsylvania (USA), likely associated with increased
                              commonly considered to be low to moderate [6].                     adoption of cover crops [10]. For the same country,

                              © 2021 The Author(s). Published by IOP Publishing Ltd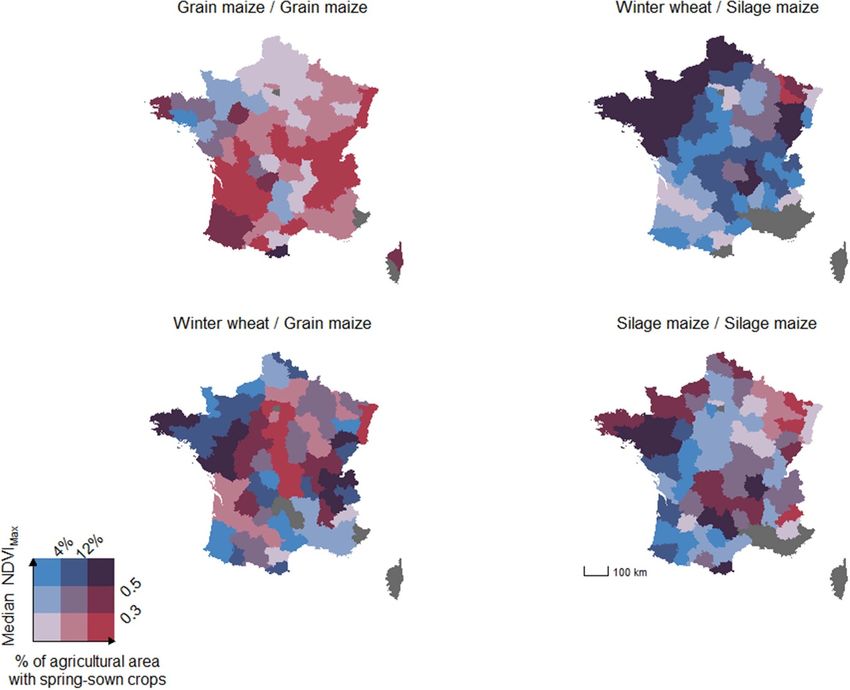
Environ. Res. Lett. 16 (2021) 064024                                                                           B Nowak et al

                           Figure 1. Workflow to set the maximum value of NDVI (NDVIMax ) for each plot.

but in the Midwest, an increase in winter soil cover               two years: 2018 and 2019. For each plot reported
for maize and soybean acreage has also been reported,              as seeded with a spring-sown crop, the soil cover
with more than doubling of cover crop acres planted                rate during the previous winter was estimated from
from 2008 to 2016 [11]. Despite this increase, winter              NDVI. The geographical distribution of winter soil
soil cover remained low in this study (less than 10%               cover, as well as the influence of the previous and fol-
of maize and soybean acreage in 2016).                             lowing crop, is investigated.
    These studies have also highlighted the influ-
ence of soil and climatic conditions on the adop-                  2. Methods
tion of cover crops by farmers. Cover crop adoption
appeared to be more frequent for low-potential soils               2.1. Spatial plot register pre-processing
[11]. In the Netherlands, where cover crops are imple-             This study focuses on all plots with spring-sown
mented on nearly all maize fields due to regulatory                crops in France, declared within the context of the
requirements, a hot and dry summer led to earlier                  European Common Agricultural Policy. These plots
harvest dates, hence earlier sowing dates and greater              are mapped in a file known as the Registre Parcellaire
development of winter cover crops in the eastern part              Graphique in France [13], which covers 99% of the
of the country [12]. Regarding the influence of crop-              French arable crop area [14]. In this file, a plot cor-
ping systems, in the USA, it has been shown that cover             responds to an area cultivated with one main crop
crops were predominantly grown after silage maize,                 (or a crop mixture) in a given year. Two years of cul-
rather than grain maize, which is harvested later [10].            tivation have been taken into account for the study:
For the same country, winter soil coverage resulted in             2018 and 2019 harvests. For these two years, plots
a modest yield gain (less than 1%) for the following               with spring-sown crops were selected from the plot
crop [11].                                                         register (figure 1). In addition, the previous crops for
    The objective of this study is to provide an estim-            the year 2018 and 2019 were defined with the 2017
ate of winter soil cover in a large territory (France)             and 2018 register, respectively. A 20 m negative buf-
prior to the establishment of a spring-sown crop for               fer was applied to the borders of each plot to avoid
                                                     2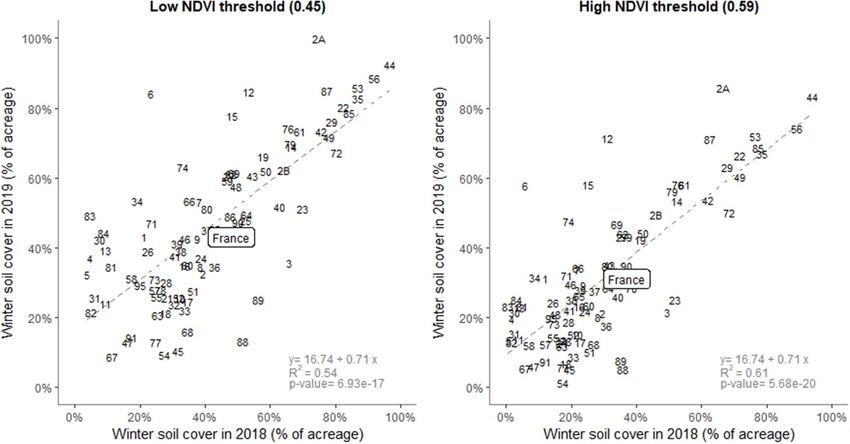
Environ. Res. Lett. 16 (2021) 064024                                                                                B Nowak et al

                     Table 1. Summary of data extraction for the ten main spring-sown crops cultivated in France.

                                                                                                    NDVI extraction and
                                                              NDVI extraction                   information about previous
                           Total acreage (kha)               (% of total acreage)                 crop (% of total acreage)
Crop                      2018             2019              2018              2019               2018               2019

Grain maize               1536             1620              67%               83%                43%                54%
Silage maize              1274             1286              76%               79%                47%                49%
Sunflower                  548              593              60%               94%                39%                65%
Sugar beet                 496              455              70%               91%                35%                46%
Spring barley              481              634              54%               80%                32%                51%
Soybean                    154              162              62%               87%                38%                55%
Spring pea                 103              108              59%               91%                32%                56%
Sorghum                     61               83              66%               95%                39%                64%
Lentil                      37               37              22%              100%                38%                70%
Spring oat                  31               37              65%               84%                39%                49%
Total                     4721             5015              67%               84%                41%                53%

edge effects due to sensor resolution or ground geo-                cloudier winter [17], fewer satellite images could be
location uncertainty.                                               exploited. This corresponds to 776 242 plots mon-
                                                                    itored in 2018, 907 473 plots in 2019. NDVIMax was
2.2. Sentinel-2 images pre-processing                               then defined as the maximum NDVI value among the
Vegetation monitoring was carried out using                         average NDVI values calculated for each plot for the
Sentinel-2 multispectral images at 10 m spatial res-                December–January period. The plot was considered
olution [15], corrected to surface reflectance using                covered if NDVIMax exceeded a given threshold. Soil
Sen2Cor [16]. For each year, winter soil cover monit-               characteristics, such as colour or moisture, and crop
oring was carried out for two months (December and                  residues influence NDVI measurements, especially in
January) during the winter before sowing the spring-                the early stages of crop development, when the soil
sown crop. December was chosen as the beginning of                  is still poorly covered [18]. In order to limit these
the study period to limit the risk of detecting unhar-              effects, it was therefore considered that soil cover had
vested spring-sown crops on the plots, such as grain                to exceed 50% for a plot to be considered as covered by
maize or sugar beet that can be harvested late in                   vegetation. Based on the literature [19–26], this cor-
the year. January was chosen as the end of the study                responds to a threshold NDVI value between 0.45 and
period because some spring-sown crops, such as peas,                0.59 (table 2). These two low and high thresholds were
can be sown as early as February. Furthermore, if a                 used in this study to assess the uncertainty associated
cover crop was present on the plot, it must have been               with the threshold selection.
already detected in December or January.                                Finally, the plot register from the previous year
    Two levels of filters were applied to remove invalid            was used to evaluate the effect of the previous crop.
observations. First, for the study period, only the least           This association could only be carried out for part of
cloudy images (20% threshold) were selected. Then, a                the plots because the borders of some of them were
second filter at the pixel scale was applied to remove              modified from one year to the next. Approximately
observations identified as clouds, shadows or snow                  50% of the plots had both winter NDVI value and pre-
(using the Scene Classification map provided with                   vious crop information (table 1).
Sentinel 2 observations).                                               NDVI calculation was realized through the
                                                                    Google Earth Engine platform [27]. Analysis was
                                                                    conducted in R [28] and figures were produced using
2.3. Definition of the occurrence of vegetative cover
                                                                    the package ggplot2 [29].
for each plot
The spatial average NDVI of each plot that will be
sown with a spring-sown crop at the end of the                      3. Results
winter was calculated for each satellite acquisition
date that was available over the study period. Follow-              3.1. Spatial heterogeneities
ing this protocol, part of the plots could not be mon-              For France, global winter soil cover rate before spring-
itored (e.g. 16% of the plots without NDVI extrac-                  sown crops was estimated between 37% and 48% for
tion in 2019, as shown on table 1) for three main                   2018 and between 31% and 43% for 2019, depend-
reasons: topological error in the original shapefile                ing on the threshold NDVI value for a soil to be con-
delimiting the plots, plot too small after applica-                 sidered covered (figure 2). Spatial patterns are rel-
tion of the negative buffer or no cloud-free pixel for              atively similar between the two years studied. Yet,
the period considered. The coverage rate was lower                  strong disparities are observed between departments.
in 2018 than in 2019 because, due to a wetter and                   For instance, soil cover rate exceeds 80% for the

                                                      3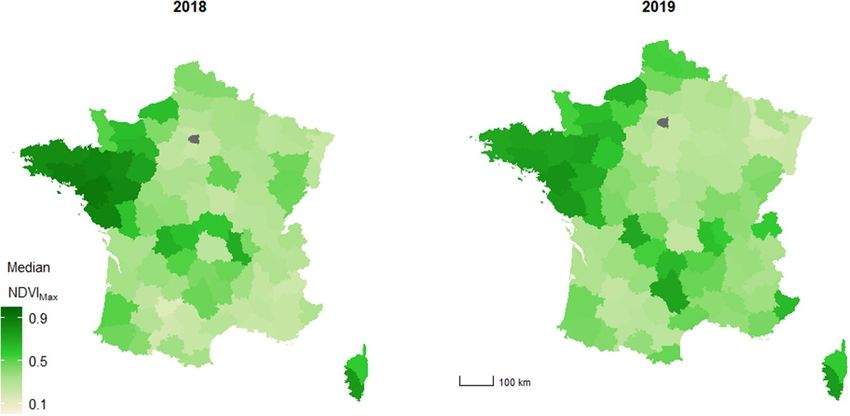
Environ. Res. Lett. 16 (2021) 064024 B Nowak et al
Table 2. Estimation of soil cover rate from NDVI.
NDVI value for 50% soil Date source for
Authors Year Crop Country cover with vegetation NDVI calculation
de la Casa et al 2018 Soybean Argentina 0.45 Landsat satellite
images
Er-Raki et al 2007 Wheat Morocco 0.54 CROPSCAN field
sensor
Imukova et al 2015 Multiple crops Germany 0.57 RapidEye satellite
images
Jimenez-Munoz et al 2009 Multiple crops Spain 0.53 PROBA/CHRIS
satellite images
Johnson and Trout 2012 Multiple crops USA 0.54 Landsat satellite
images
Lopez-Urrea et al 2009 Wheat Spain 0.55 GER3700 field
sensor
Prabhakara et al 2015 Multiple crops USA 0.56 CROPSCAN field
sensor
Trout et al 2008 Multiple crops USA 0.59 TetraCam field
sensor
Figure 2. Estimation of the winter land cover rate by French department for the years 2018 and 2019, according to the NDVI
threshold chosen to consider a soil as covered. Numbers represent the codes of the different departments. ‘France’ label represents
the estimate for mainland France.
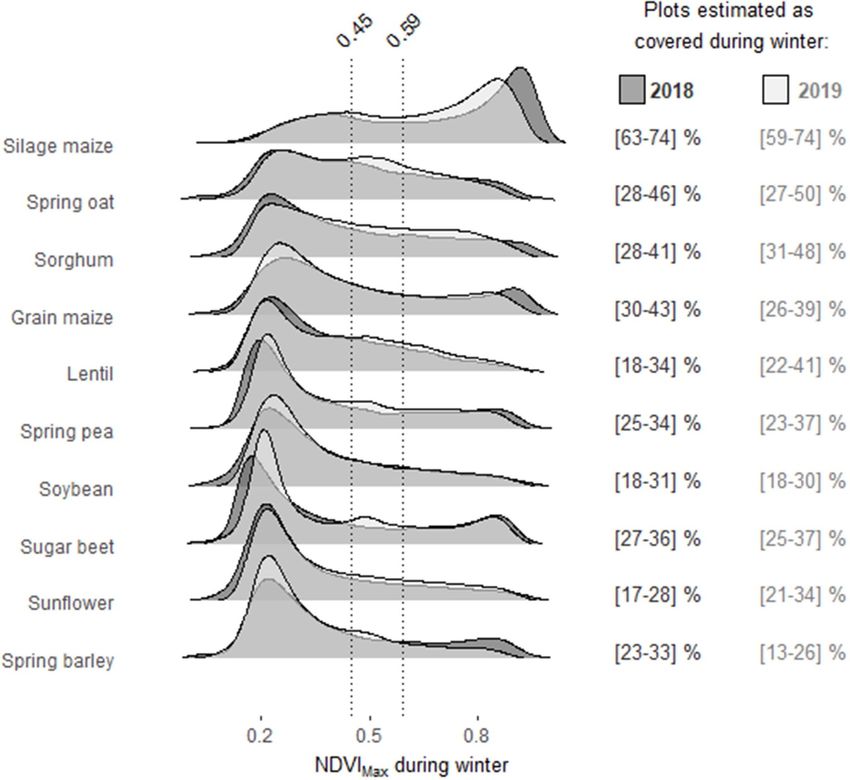
department of Loire Atlantique (44), in the west of has a strong association with winter soil cover. For
France, while it is close to 10% for the Bas-Rhin instance, the results show that plots sown with maize
department (67), in the east of France. Overall, based silage are more often covered during the winter than
on winter NDVIMax values, soils of the western part plots sown with sunflowers (figure 4). As shown on
of the country are frequently covered whereas, in the this figure, the distribution curve of winter NDVIMax
East, soils are most often left bare before sowing a values for maize silage shows a peak close to 0.8 for
spring-sown crop (figure 3). The cereal plain around 2019 and slightly higher for 2018. These spectral sig-
Paris has relatively low NDVIMax values, also indicat- natures correspond to well-developed plant cover.
ing predominantly bare soils. Like those of the West, Moreover, depending on the threshold values for a
the soils of the Massif Central, in the center of the soil to be considered covered, between two-thirds
country, are estimated as mostly covered, with the and three-quarters of the plots could be considered
exception of the Puy-de-Dôme department (63). covered prior to the seeding of maize silage.
Conversely, for both years, the distribution curve
3.2. Following spring-sown crop of winter NDVIMax values for sunflower shows a
Cropping systems have an impact on winter soil single peak at 0.2, a value within the range of spectral
cover rate. First, the upcoming spring-sown crop signatures of bare soils [30]. About a quarter of the
4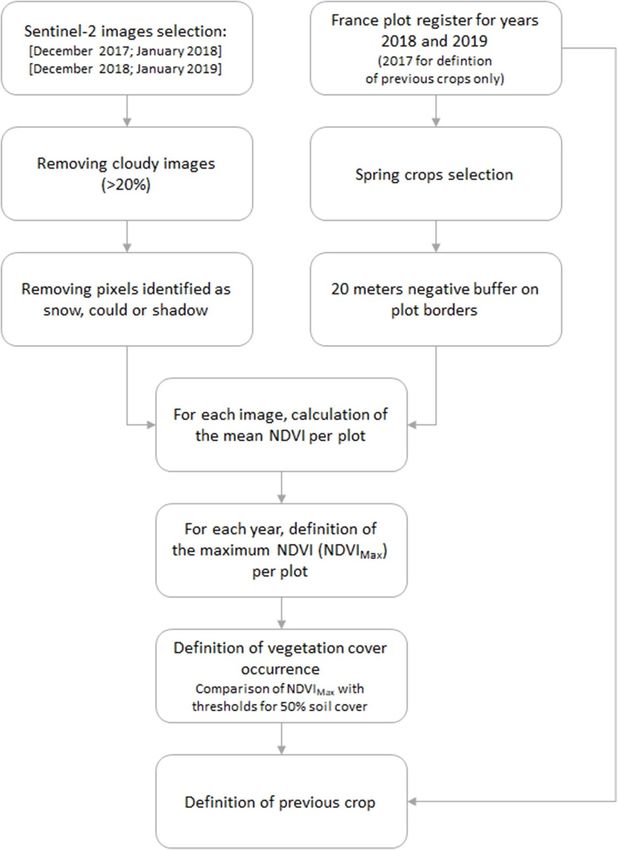
Environ. Res. Lett. 16 (2021) 064024                                                                                    B Nowak et al

   Figure 3. Map of median winter NDVIMax preceding spring-sown crops by French department (all spring-sown crops combined).
   The department in grey corresponds to the Paris area, where no crops are grown.

   Figure 4. Distribution curves of winter NDVIMax by plot depending on the crops sown the following spring for years 2018 (dark
   colored) and 2019 (light colored). The estimate of the percentage of plots with winter soil coverage is given according to two
   NDVI thresholds for a plot to be considered covered (0.45 and 0.59).

                                                      5
Environ. Res. Lett. 16 (2021) 064024 B Nowak et al
Figure 5. Median winter NDVIMax by previously harvested crop (in column) and next spring seeded crop (in row) for the years
2018 and 2019. The colour intensity represents the NDVIMax value, the shape size represents the scale of each crop succession (in
hectares).
plots could be considered covered before sowing this In general, winter soil cover was higher when the pre-
crop. Finally, the winter NDVIMax distribution curve vious crop was a winter crop, given that its earlier har-
of some crops, such as grain maize, shows two peaks: vest gave ample time for cover crop growth.
one at 0.2 and one at 0.8. Such a distribution illus- As detailed previously, figure 5 confirms that the
trates the difference between plots with bare soils dur- highest winter NDVIMax values are associated with
ing winter and those with covered soils. For the year acreage that will be seeded with maize silage.
2018, it was estimated that between 30% and 43%
of the plots were covered before sowing grain maize, 3.4. Interactions between cropping system
depending on the threshold NDVI value selected. distribution and spatial heterogeneities of winter
soil cover
3.3. Previous crop The distribution of crop rotations across France par-
The previous crop also has an influence on the winter tially explains the spatial heterogeneities in winter soil
soil cover (figure 5). Surface previously established cover highlighted in figure 3. Of the four main crop
with temporary grassland, which is cultivated for a sequences investigated (grain maize followed by grain
maximum of five consecutive years with grass or maize, winter wheat followed by silage maize or grain
legumes species, pure or mixed, shows higher winter maize and silage maize followed by silage maize), the
NDVIMax values than other previous crops, and is period between the harvest of winter wheat and the
thus more likely to be covered during the winter sowing of maize silage is the one during which the soil
period due to late ploughing of grassland. This may is most likely to be covered during winter (figure 5).
partially explain the high soil cover rates shown for As this crop sequence is mainly found in the West of
maize silage, as it is the crop that most often follows France (figure 6), this may explain the patterns pre-
grassland. But there is also an interaction between the viously observed in figure 3. However, crop rotation
previous and the next crop. For example, a plot cul- is not sufficient to explain these spatial heterogen-
tivated with winter soft wheat is more likely to be eities as different trends can be observed between
covered during the winter when it is followed by corn departments for the same crop sequence. As shown
silage as compared to any other spring crop. In par- in figure 6, the median winter NDVI values between
ticular, the soil is frequently bare during winter for two maize grains are higher in western France, indic-
crop rotations of soft winter wheat followed by beet, ating that the soil is more frequently covered in this
or soft winter wheat followed by sunflower, which are region. Similarly, the soil appears to be more fre-
common patterns in France. quently covered in the West between the harvesting
Among cereal crops, winter triticale was the pre- of winter wheat and the sowing of grain maize, par-
vious crop with the highest winter NDVIMax values. ticularly in comparison with Central France.
6Environ. Res. Lett. 16 (2021) 064024 B Nowak et al
Figure 6. Maps of median winter NDVIMax values and percentage of area occupied by each crop rotation for the four main crop
sequences ending with a spring-sown crops (grain maize followed by grain maize, winter wheat followed by silage maize or grain
maize and silage maize followed by silage maize). Percentage of area occupied by each sequence is calculated from the total area of
spring-sown crops with information about preceding crop (table 1). Classes in the legend correspond to the one-third and
two-third quantiles of the variables. Values are calculated for both study years (2018 and 2019) together. For the departments
coloured in grey, the corresponding crop sequence was not present in the dataset.
4. Discussion it was estimated for France that between one-third
and one-half of the acreage could be considered as
4.1. Evaluation of winter soil cover before covered during the winter preceding the sowing of
spring-sown crops in France a spring-sown crop, depending on the year and the
Areas under spring-sown crops account for slightly NDVI threshold used to consider a plot as covered
more than a quarter of the total arable land in France (figure 2). Winter soil cover was slightly lower in 2019
[31]. It is roughly equivalent to that of winter soft than in 2018, probably due to a drier autumn [17]
wheat alone, which is the main cereal crop grown which hindered the establishment and development
in the country [32]. If it is considered that winter- of cover crops. Winter soil cover rate estimated in this
sown crops are sufficiently developed to ensure soil study is higher than that estimated for Midwestern
cover, the winter soil cover rate for the total French United States, where cover crops were detected on 9%
agricultural area is therefore higher than the figures of maize and soybean acreage in 2016 [11], but lower
presented here. Yet, multiple environmental issues than that estimated for Pennsylvania, where 52% to
are related to the agricultural practices implemen- 75% of maize acreage was covered in winter, depend-
ted prior to sowing spring crops. On these areas, ing on the county [10].
winter soil cover can both reduce the negative impacts For France, based on a farm structure survey in
of agricultural systems, for example by limiting soil 2016, it was estimated that before spring-sown crops,
erosion [33], and improve the services provided by about 55% of the soils were covered by cover crops,
agriculture, such as soil carbon storage [34]. 21% by crop residues and 24% of the soils were left
Several studies have already assessed winter soil bare in winter [31]. Crop residues cannot be detec-
cover before spring-sown crop using satellite imagery ted with the methodology used in this study, which
on a regional scale [10–12], but this study is the first to is based on NDVI monitoring. Furthermore, some
propose such an assessment on a national scale. Here, plots declared as sown with cover crops may not have
7Environ. Res. Lett. 16 (2021) 064024 B Nowak et al
sufficient vegetative development to be considered characterized by an oceanic climate, with mild winters
covered with the NDVI thresholds used here, whereas and high annual rainfall. This region had indeed the
some plots with heavy weed infestation could be con- highest soil cover rates of the country (figure 3). In
sidered as covered. Nevertheless, the proportion of the east of France, the continental climate can hinder
cover crops previously reported in the survey men- the adoption of cover crops, as cooler soil temperature
tioned above is relatively similar to the areas estimated under crop residues may retard the growth of the next
to be covered here with reference to the low NDVI crop in a cold climate. In the south of France, with a
threshold (48% in 2018 and 43% in 2019). Mediterranean climate and low rainfall, water used by
The method proposed in this study, with the cal- cover crops can have a negative impact on the yields of
culation for each plot of the maximum NDVI during the following crops. In addition, under these climates,
the winter, is relatively simple. Unlike other methods the droughts which can occur during the sowing of
based on the analysis of vegetation index time series, cover crops, is a barrier to the success of these crops. A
it does not allow a precise analysis of the agricultural study based on French case studies has shown that the
practices, such as the estimation of the sowing date number of consecutive days without significant water
[35], crop identification [36], or the determination input after sowing is the most significant variable to
of the amount of biomass produced [37]. However, predict cover crop emergence [40].
these methods may be difficult to apply for mon- Thirdly, the agricultural production of each ter-
itoring cover crops, which are planted over a short ritory can also influence winter soil cover rate. Here,
period of time that is generally very cloudy, with few it has been shown that crops most frequently related
reliable satellite images. Moreover, the method pro- to livestock production, such as temporary grassland
posed here could easily be applied to other case stud- or maize silage, are more likely to be associated
ies provided that a spatialized plot register is available. with winter cover soils (figure 4). Potential nutri-
Among the potential applications, it could be used to ent excesses resulting from manure application could
monitor changes in winter soil cover over years or to explain the high winter soil cover in some livestock
compare cover crop adoption in different countries regions such as western France [3]. Higher winter
for example. Concerning the avenues for improve- soil cover in livestock regions may also be partially
ment, the integration of synthetic aperture radar data explained by the use of cover crops to produce addi-
such as Sentinel-1 could be relevant for monitoring tional fodder resources in livestock systems, as previ-
of winter soil cover, as these data are not sensitive to ously highlighted in the literature [41]. Here, grass-
cloud cover and could be used to identify crops or to lands alternating with spring-sown crops have also
monitor agricultural practices [38], especially when been pointed out as another way to provide winter
combined with multispectral images [39]. soil cover in mixed crop-livestock systems, due to
their late destruction date. Agricultural systems com-
4.2. Spatial heterogeneities regarding winter soil bining livestock and crop productions may provide
cover rate before spring-sown crops multiple benefits, such as improving nutrient cycling
There was little difference between the two years stud- [42]. These mixed systems can also provide alternat-
ied, but strong spatial heterogeneities in winter soil ives to cover crops for winter soil cover, by fostering
cover were highlighted in figures 2 and 3. Based on the integration of grasslands into crop rotations, as a
the results obtained in this study, several factors may primary crop or as an intermediate crop between two
explain these heterogeneities. primary crops.
First of all, the results of this study showed that Further work is needed to test the hypotheses for-
crop rotation has a strong influence on winter soil mulated here. For example, since the type of agri-
cover. Previous crops such as winter triticale or winter cultural production (i.e. crop or livestock) seems to
wheat had a higher winter soil cover than some spring influence the adoption of cover crops, it would be
crops such as sugar beet or soybean (figure 5) which, interesting to allocate each of the plots monitored in
harvested later, leave less time for the establishment of this study to the farm to which it belongs in order to
cover crops. Thus the greater occurrence of the crop study the effect of farm structure on winter soil cover.
sequence of winter wheat followed by silage maize in This could be achieved through the unique identifier
western France partly explains the greater winter soil that characterizes each plot in the register, provided
cover in this region (figure 6). However, as different that confidentiality can be waived for such a study. In
trends can be observed between departments for the addition, the influence of weather data and soil types
same crop sequence, other factors than crop rotation on winter soil cover has not been fully investigated
must therefore be considered to explain the adoption here but, thanks to the data sets that are now available
of winter cover crops. for France, it could also be possible to characterise the
Secondly, the pedoclimatic conditions may influ- pedoclimatic factors of each plot. The work initiated
ence the development of plant cover. Cover crops are in this study can therefore be further extended to bet-
better suited to warm regions with abundant precip- ter understand the drivers of winter soil cover before
itation [4], which is the case of Western France, that is spring-sown crops.
8Environ. Res. Lett. 16 (2021) 064024 B Nowak et al
Data availability statement [16] Louis J, Debaecker V, Pflug B, Main-Knorn M, Bieniarz J,
Mueller-Wilm U, Cadau E and Gascon F 2016 Sentinel-2
Sen2Cor: L2A processor for users Proc. Living Planet Symp.
The data that support the findings of this study are
2016 ESA Living Planet Symp. 2016 vol SP-740, ed
available upon reasonable request from the authors. L Ouwehand (Prague: Spacebooks Online) pp 1–8
[17] Météo France Bilans climatiques (available at: www.
meteofrance.fr/climat-passe-et-futur/bilans-climatiques)
[18] Jones J R, Fleming C S, Pavuluri K, Alley M M, Reiter M S
Acknowledgments and Thomason W E 2015 Influence of soil, crop residue, and
sensor orientations on NDVI readings Precis. Agric.
We would like to thank Julie Billon for improving the 16 690–704
English. The publication of this article was financed [19] Johnson L F and Trout T J 2012 Satellite NDVI assisted
by the French government IDEX-ISITE initiative 16- monitoring of vegetable crop evapotranspiration in
California’s San Joaquin Valley Remote Sens. 4 439–55
IDEX-0001 (CAP 20-25), I-SITE project (CAP 2025) [20] Trout T J, Johnson L F and Gartung J 2008 Remote sensing
of the University of Clermont Auvergne. of canopy cover in horticultural crops HortScience
43 333–7
[21] López-Urrea R, Montoro A, González-Piqueras J,
López-Fuster P and Fereres E 2009 Water use of
References spring wheat to raise water productivity Agric. Water Manag.
96 1305–10
[1] Schipanski M E et al 2014 A framework for evaluating [22] Jiménez-Muñoz J C, Sobrino J A, Plaza A, Guanter L,
ecosystem services provided by cover crops in Moreno J and Martinez P 2009 Comparison between
agroecosystems Agric. Syst. 125 12–22 fractional vegetation cover retrievals from vegetation indices
[2] Thapa R, Mirsky S B and Tully K L 2018 Cover crops reduce and spectral mixture analysis: case study of PROBA/CHRIS
nitrate leaching in agroecosystems: a global meta-analysis data over an agricultural area Sensors 9 768–93
J. Environ. Qual. 47 1400–11 [23] De La Casa A, Ovando G, Bressanini L, Martínez J, Díaz G
[3] European Commission 2021 The nitrates directive and Miranda C 2018 Soybean crop coverage estimation from
[4] Dabney S M, Delgado J A and Reeves D W 2001 Using NDVI images with different spatial resolution to evaluate
winter cover crops to improve soil and water quality yield variability in a plot ISPRS J. Photogramm. Remote Sens.
Commun. Soil Sci. Plant Anal. 32 1221–50 146 531–47
[5] Nowak B, Marliac G and Hou D 2020 Optimization of [24] Er-Raki S, Chehbouni A, Guemouria N, Duchemin B,
carbon stock models to local conditions using farmers’ soil Ezzahar J and Hadria R 2007 Combining FAO-56 model and
tests: a case study with AMGv2 for a cereal plain in central ground-based remote sensing to estimate water
France Soil Use Manage. 36 633–45 consumptions of wheat crops in a semi-arid region Agric.
[6] Singer J W, Nusser S M and Alf C J 2007 Are cover crops Water Manage. 87 41–54
being used in the US corn belt? J. Soil Water Conserv. [25] Imukova K, Ingwersen J and Streck T 2015 Determining the
62 353–8 spatial and temporal dynamics of the green vegetation
[7] Ndikumana E, Ho Tong Minh D, Dang Nguyen H, fraction of croplands using high-resolution RapidEye
Baghdadi N, Courault D, Hossard L and El Moussawi I 2018 satellite images Agric. For. Meteorol. 206 113–23
Estimation of rice height and biomass using multitemporal [26] Prabhakara K, Hively W D and McCarty G W 2015
SAR Sentinel-1 for Camargue, Southern France Remote Sens. Evaluating the relationship between biomass, percent
10 1394 groundcover and remote sensing indices across six winter
[8] Pan Z, Huang J, Zhou Q, Wang L, Cheng Y, Zhang H, cover crop fields in Maryland, United States Int. J. Appl.
Blackburn G A, Yan J and Liu J 2015 Mapping crop Earth Obs. Geoinf. 39 88–102
phenology using NDVI time-series derived from HJ-1 A/B [27] Gorelick N, Hancher M, Dixon M, Ilyushchenko S, Thau D
data Int. J. Appl. Earth Obs. Geoinf. 34 188–97 and Moore R 2017 Google Earth Engine: planetary-scale
[9] Thieme A, Yadav S, Oddo P C, Fitz J M, McCartney S, geospatial analysis for everyone Remote Sens. Environ.
King L, Keppler J, McCarty G W and Hively W D 2020 Using 202 18–27
NASA Earth observations and Google Earth Engine to map [28] R Development Core Team 2009 R: A Language and
winter cover crop conservation performance in the Environment for Statistical Computing (Vienna: R
Chesapeake Bay watershed Remote Sens. Environ. Foundation for Statistical Computing)
248 111943 [29] Wickham H 2016 Ggplot2: Elegant Graphics for Data Analysis
[10] Hively W D, Duiker S, McCarty G and Prabhakara K 2015 (Cham: Springer)
Remote sensing to monitor cover crop adoption in [30] Ding Y, Zheng X, Zhao K, Xin X and Liu H 2016 Quantifying
southeastern Pennsylvania J. Soil Water Conserv. 70 340–52 the impact of NDVIsoil determination methods and
[11] Seifert C A, Azzari G and Lobell D B 2018 Satellite detection NDVIsoil variability on the estimation of fractional
of cover crops and their effects on crop yield in the vegetation cover in Northeast China Remote Sens.
Midwestern United States Environ. Res. Lett. 13 064033 8 29
[12] Fan X, Vrieling A, Muller B and Nelson A 2020 Winter cover [31] Eurostat 2016 Agri-environmental indicator—soil
crops in Dutch maize fields: variability in quality and its cover—statistics explained
drivers assessed from multi-temporal Sentinel-2 imagery Int. [32] Agreste 2019 Surfaces, rendements et productivités des
J. Appl. Earth Obs. Geoinf. 91 102139 productions végétales
[13] Géoservices IGN Accéder au téléchargement des données [33] Aryal N, Reba M L, Straitt N, Teague T G, Bouldin J and
libres IGN (available at: https://geoservices.ign.fr/ Dabney S 2018 Impact of cover crop and season on nutrients
documentation/diffusion/telechargement-donnees- and sediment in runoff water measured at the edge of fields
libres.html#rpg) in the Mississippi Delta of Arkansas J. Soil Water Conserv.
[14] Cantelaube P and Carles M 2014 Le registre parcellaire 73 24–34
graphique: des données géographiques pour décrire la [34] Ruis S J and Blanco-Canqui H 2017 Cover crops could offset
couverture du sol agricole Cah. Tech. INRA 58 58–64 crop residue removal effects on soil carbon and other
[15] Drusch M et al 2012 Sentinel-2: ESA’s optical properties: a review Agron. J. 109 1785
high-resolution mission for GMES operational services [35] Urban D, Guan K and Jain M 2018 Estimating sowing dates
Remote Sens. Environ. 120 25–36 from satellite data over the U.S. Midwest: a comparison of
9Environ. Res. Lett. 16 (2021) 064024 B Nowak et al
multiple sensors and metrics Remote Sens. Environ. as derived from SAR and multispectral data of Sentinel-1
211 400–12 and -2 Remote Sens. Environ. 253 112232
[36] Schmedtmann J and Campagnolo M L 2015 Reliable crop [40] Tribouillois H, Constantin J and Justes E 2018 Analysis and
identification with satellite imagery in the context of modeling of cover crop emergence: accuracy of a static
common agriculture policy subsidy control Remote Sens. model and the dynamic STICS soil-crop model Eur. J. Agron.
7 9325–46 93 73–81
[37] Edirisinghe A, Hill M J, Donald G E and Hyder M 2011 [41] Drewnoski M, Parsons J, Blanco H, Redfearn D, Hales K and
Quantitative mapping of pasture biomass using satellite MacDonald J 2018 Forages and pastures symposium: cover
imagery Int. J. Remote Sens. 32 2699–724 crops in livestock production: whole-system approach. Can
[38] Shang J et al 2020 Detection of crop seeding and harvest cover crops pull double duty: conservation and profitable
through analysis of time-series Sentinel-1 interferometric forage production in the Midwestern United States? J. Anim.
SAR data Remote Sens. 12 1551 Sci. 96 3503–12
[39] Meroni M, d’Andrimont R, Vrieling A, Fasbender D, [42] Nowak B, Nesme T, David C and Pellerin S 2015 Nutrient
Lemoine G, Rembold F, Seguini L and Verhegghen A 2021 recycling in organic farming is related to diversity in farm
Comparing land surface phenology of major European crops types at the local level Agric. Ecosyst. Environ. 204 17–26
10You can also read