Nitrogen Management Guidelines for Corn in Indiana
←
→
Page content transcription
If your browser does not render page correctly, please read the page content below
Purdue University Department of Agronomy

                                                  Applied Crop Research Update
                                                                             Updated February 2015
                                       URL: http://www.kingcorn.org/news/timeless/NitrogenMgmt.pdf

Nitrogen Management Guidelines for Corn in Indiana
Jim Camberato1 and RL (Bob) Nielsen
Agronomy Department, Purdue Univ., West Lafayette, IN

    9-YEAR SUMMARY OF CORN RESPONSE TO NITROGEN FERTILIZER
This report summarizes the yield response to fertilizer nitrogen (N) rate of corn grown in
rotation with soybean (corn/soy) in field-scale trials conducted around the state of Indiana
since 2006. These results are applicable to situations that use efficient methods and
timings of N fertilizer application. The average Agronomic Optimum N Rate (AONR) for
38 trials conducted on medium- and fine-textured soils in westcentral and southwest
Indiana was 183 lbs N / ac. The average AONR for 26 trials conducted on medium- and
fine-textured soils in northwest and northcentral Indiana was 191 lbs N / ac. The average
AONR for trials conducted on medium- and fine-textured soils in other regions of the
state were 196, 221, 226, and 233 lbs N / ac for southeast (11 trials), central (23 trials),
northeast (10 trials), and eastcentral (25 trials) Indiana, respectively. The average AONR
for 14 trials on non-irrigated sandy soils was 184 lbs N / ac. At the five Purdue locations
where we conducted paired trials of corn/soy and corn following corn (corn/corn) in
2007-2010, the average AONR for corn/corn was 44 lbs greater than for corn/soy while
average corn/corn yields were 18 bu/ac less than the corn/soy yields.
Economic Optimum N Rates (EONR) for various combinations of N cost and grain price
are listed in Tables 2 - 8 for regions of the state.
Nitrogen fertilizer costs continue to be one of the most expensive variable production
costs for corn. Applying “more than enough N” is no longer cheap “insurance” as it once
was many years ago. Applying “more than enough N” is also not environmentally
friendly. High N fertilizer costs and environmental impacts should encourage growers to
critically evaluate their N management program, including application rate, fertilizer
material, and timing.
Nitrogen rate recommendations for a given field were traditionally linked to its historical
yield levels (Camberato, 2012). For corn/soybean, the traditional rule of thumb was an N
rate equal to about 1 lb of N per bushel of expected yield. For corn following either corn
or wheat, the recommendation was equal to about 1.2 lbs of N per bushel.

1
 For more information, contact Jim Camberato (765-496-9338, jcambera@purdue.edu) or Bob Nielsen
(765-494-4802, rnielsen@purdue.edu). Also available online in HTML format at
http://www.kingcorn.org/news/timeless/NitrogenMgmt.html.
Purdue Nitrogen Management Update, pg 2 of 10
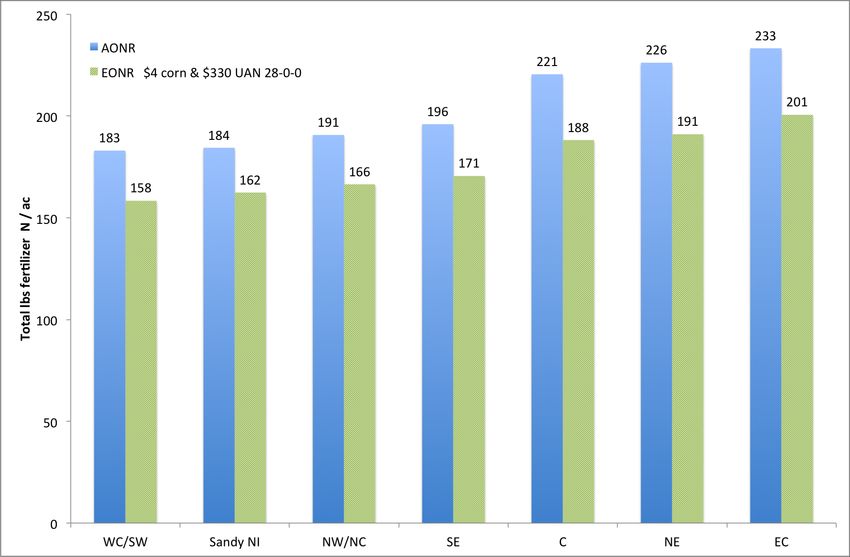
These rules of thumb implied there was a straight-
line relationship between yield and N rate; such
that the more N you apply, the more grain you
harvest. In reality, the relationship is curvilinear;
meaning that the first pounds of applied N
typically return the greatest number of bushels
and the last pounds of applied N typically return
the fewest number of bushels (figure to right). At
some level of N, grain yield stops increasing with
more N. Consequently, applying more N than the
crop requires is dollar wasteful and
environmentally distasteful.
Throughout the Midwest, most land-grant universities have moved away from yield-
based N rate recommendations toward data-driven recommendations that are sensitive to
N and grain prices (Sawyer et al., 2006). This approach to N rate recommendations links
documented yield responses to N with the relative economics of grain price and N cost.
A couple of new terms or acronyms have developed from this approach. The term
“Agronomic Optimum N Rate” or AONR defines the N rate that will produce
maximum grain yield, regardless of cost. The term “Economic Optimum N Rate” or
EONR defines the N rate that will result in the maximum dollar return to N. The EONR
is usually less than the AONR, will usually decrease as N prices increase, will usually
increase as grain prices increase, or may remain the same if the ratio between nitrogen
cost and grain price (N:G) remains the same.
The “new” approach requires yield data from numerous field trials documenting corn
yield responses to N fertilizer rates across a range of growing conditions. We began our
current N rate trials in 2006. To date, 240 field-scale trials have been conducted around
the state. About 76% of them have been with corn grown in rotation with soybean and the
rest primarily continuous corn. About 60% of the trials have been conducted on farmers’
fields and the remainder has been trials at Purdue research centers around the state2.
The N rate treatments have ranged from nothing but starter N to as much as 286 lbs/ac
applied N. Most of the trials used sidedress liquid UAN simply to facilitate trial logistics.
Similar results would be expected from late pre-plant or sidedress anhydrous, but not
necessarily from early pre-plant anhydrous ammonia, early pre-plant liquid UAN, or fall-
applied anhydrous. Most of the trials were conducted on medium- and fine-textured soils: silt
loams, silty clay loams, and the like. Almost all of the trials have been field-scale; meaning
that the individual N rate “plots” are usually field length by some multiple of the combine
header width. Most of the trials have been harvested with the aid of GPS-enabled yield
monitors.
2
We gratefully acknowledge the support provided for these trials by the Indiana Corn Marketing Council,
Pioneer Hi-Bred Int’l and LG Seeds (seed contribution for Purdue trial sites), Beck’s Hybrids (additional
trial data), A&L Great Lakes Labs (discounted analysis costs), individual farmers and crop consultants,
Purdue Univ. Office of Ag Research Programs, and all of the Purdue Ag Center staff.
© 2014, Purdue Univ.Purdue Nitrogen Management Update, pg 3 of 10
Regional and Soil Differences for Optimum N Rate
Nitrogen used by the corn crop originates from soil organic matter and crop residues as
well as from applied fertilizer. Some soils provide as little as 25% of the crop N
requirement, the remainder coming from fertilizer N. Other soils provide in excess of
50% of the crop N demand, with a lesser amount needed from applied N. The N supply
and N loss potential of a soil are related to soil properties and, of course, soils vary
geographically around the state. In general, soils with higher organic matter and better
drainage provide more N to the crop and retain more fertilizer N than lower organic
matter, more poorly drained soils. As we conduct more and more trials, we are
identifying regional differences in AONR and EONR that make sense as we consider the
soils in those regions. It is important to note that most of our trials employed efficient
fertilizer application methods and timings. Less efficient N management would likely
require higher fertilizer N rates in response to the greater risk of N loss.
For now, we have grouped the N guidelines according to Indiana Crop Reporting
Districts (Fig. 1). The average AONR for 38 trials conducted on medium- and fine-
textured soils in westcentral and southwest Indiana was 183 lbs N / ac. The average
AONR for 26 trials conducted on medium- and fine-textured soils in northwest and
northcentral Indiana was approximately 191 lbs N / ac. The average AONR for trials
conducted on medium- and fine-textured soils in other regions of the state were 196, 221,
226, and 233 lbs N / ac for southeast (11 trials), central (23 trials), northeast (10 trials),
and eastcentral (25 trials) Indiana, respectively. The average AONR for 14 trials
conducted on non-irrigated sandy soils was 184 lbs N / ac.
The EONR is less than the AONR, based on the relative cost of N and value of grain.
Economically optimum N rates can be found in Tables 2 - 8.
More field research is needed in southcentral Indiana in general, on sandy soils (irrigated
and non-irrigated), and on muck fields to develop more reliable guidelines for those
regions or situations. Please consider collaborating with us in conducting on-farm
research N rate trials (see pg. 4 for more information).
More Discussion on N Management
Although we report a single AONR for a region, specific AONR values often vary from
field to field and from year to year for a single field. For example, the average AONR for
corn grown in rotation with soybean at our research site near West Lafayette is 184 lbs N
/ ac, but the AONR for individual years (2006 - 2014) has ranged from 130 to 262 lbs N /
ac. This variation in optimum N rate is not particularly surprising given the difficulty of
predicting soil N supply, fertilizer N loss, and growing season weather. Weather
influences both soil N supply and fertilizer N efficiency. Crop health, N uptake, and N
use efficiency are also weather- and soil-dependent.
Soil or fertilizer N lost to leaching, denitrification, or volatilization is N no longer
available to the plant (Nielsen, 2006). The most effective N application method and
timing for minimizing N loss is to inject N prior to the beginning of rapid crop N uptake
at roughly growth stage V6 (six leaves with visible leaf collars, approximately 18 inches
tall). If making fall or early-spring applications, anhydrous ammonia is the least risky of
the N sources because it is the slowest to convert to the nitrate form that is susceptible to
© 2014, Purdue Univ.Purdue Nitrogen Management Update, pg 4 of 10
leaching or denitrification losses. Urea-containing fertilizers should be incorporated to
eliminate volatilization losses or a urease inhibitor can be used to delay the initial
conversion of urea to ammonia (reducing the risk of volatilization loss). Nitrification
inhibitors can be used with anhydrous, urea, or liquid N to delay the conversion of
ammonium to nitrate. In most situations proper placement and timing are more effective
than inhibitors in preventing N loss. NOTE: Practices such as fall-applied or early-
spring applied N or surface-applied urea provide a larger “window of opportunity”
for N loss and therefore would require higher N rates than our results would suggest
to achieve optimum yield.
Even if you take steps to minimize the risk of N loss, predicting the optimum N rate for a
particular field in a particular year remains a challenge. Several tools exist that may
improve N management. These include: the Pre-Sidedress Nitrate Test (Brouder &
Mengel, 2003b) which can be used to estimate soil N supply in manured fields or soils
with very high organic matter content, a chlorophyll meter (Brouder & Mengel, 2003a) or
active sensor in conjunction with a high-N reference strip which can be utilized during
the growing season to evaluate crop N status, and the end-of-season stalk nitrate test
(Brouder, 2003; Camberato & Nielsen, 2014) which can serve as a “report card” to
determine whether N was over-applied.
The bottom line on N use in corn is that it is part of a complex biological system that
interacts with everything under the sun, including the sun. We cannot accurately predict
the weather. We cannot accurately predict soil N supply throughout the year. Yet, we
cannot afford (financially or environmentally) to simply apply “more than enough” N.
We can minimize the risk of fertilizer N loss by understanding the processes and
matching N source with placement and timing. We can develop average N rate
recommendations that will work to optimize profit over several years. We can attempt to
fine-tune those recommendations with tests, models, optical sensors, or simply educated
guesses.
We Are Looking for On-Farm Trial Cooperators
Our long-term objective is to develop soil-specific N rate guidelines. Conducting N rate
trials on farmer’s fields is the best way for us to expand our efforts and increase the
database for making regional recommendations. The general protocol for such trials is to
sidedress-apply strips of five or six N rates (for example: 70, 110, 150, 190, and 230 lbs
N per acre), repeated at least three times across a field. Size of individual plots (a single
N rate strip) can be length of field by some multiple of combine header width. If you use
a variable rate controller that accepts prescription N rate files, we can create and provide
a prescription file that essentially eliminates the logistics of implementing the replicated
N rate treatments. Use of combine yield monitors is strongly encouraged primarily
because they greatly reduce the harvesting logistics of such a trial.
The general protocol for our N rate trials can be downloaded at
http://www.agry.purdue.edu/ext/ofr/protocols/PurdueNTrialProtocol.pdf.
If you are interested in conducting on-farm N rate trials, contact Jim Camberato (765-
496-9338 or jcambera@purdue.edu) or Bob Nielsen (765-494-4802 or
rnielsen@purdue.edu). We will work with you to come up with the best compromise
between our desires for statistical soundness and your desire for logistical simplicity.
© 2014, Purdue Univ.Purdue Nitrogen Management Update, pg 5 of 10
Cited references
Brouder, Sylvie. 2003. Cornstalk Testing to Evaluate the Nitrogen Status of Mature Corn.
Purdue Extension publication AY-322-W. Online at
http://www.agry.purdue.edu/ext/pubs/AY-322-W.pdf. [URL accessed Feb 2015].
Brouder, Sylvie and David Mengel. 2003a. Determining Nitrogen Fertilizer Sidedress
Application Needs in Corn Using a Chlorophyll Meter. Purdue Extension publication
AY-317-W. Online at http://www.agry.purdue.edu/ext/pubs/AY-317-W.pdf [URL
accessed Feb 2015].
Brouder, Sylvie and David Mengel. 2003b. The Presidedress Soil Nitrate Test for
Improving N Management in Corn. Purdue Extension publication AY-314-W. Online
at http://www.agry.purdue.edu/ext/pubs/AY-314-W.pdf. . [URL accessed Feb 2015]
Camberato, Jim. 2012. A Historical Perspective on Nitrogen Fertilizer Rate
Recommendations for Corn in Indiana (1953-2011). Purdue Extension. On-line at
http://www.extension.purdue.edu/extmedia/AY/AY-335-W.pdf [URL accessed Feb
2015].
Camberato, Jim and RL (Bob) Nielsen. 2014. Corn Stalk Nitrate Tests – Research and
Recommendation Update. Purdue Extension. Online at
http://www.soilfertility.info/news/cornstalknitrate.pdf [URL accessed Feb 2015].
Nielsen, RL (Bob). 2006. N Loss Mechanisms and Nitrogen Use Efficiency. Handout for
2006 Purdue Nitrogen Management Workshops. Purdue Extension. Online at
http://www.agry.purdue.edu/ext/pubs/2006NLossMechanisms.pdf. [URL accessed Feb
2015].
Sawyer, John & multiple co-authors. 2006. Concepts and Rationale for Regional
Nitrogen Rate Guidelines for Corn (PM-2015). Iowa State Univ. Extension. On-line at
http://www.extension.iastate.edu/Publications/PM2015.pdf [URL accessed Feb 2015].
Don’t forget, this and other timely information about corn can be viewed at the Chat ‘n Chew Café on the
Web at http://www.kingcorn.org/cafe.
It is the policy of the Purdue University that all persons shall have equal opportunity and access to its
programs and facilities without regard to race, color, sex, religion, national origin, age, or disability. Purdue
University is an Affirmative Action employer. This material may be available in alternative formats.
Figures & tables on following pages...
© 2014, Purdue Univ.Purdue Nitrogen Management Update, pg 6 of 10
Fig. 1. Indiana crop reporting districts as identified by USDA-NASS.
Table 1. Costs per lb. of actual N for varying costs per ton of product for three fertilizer
sources of N commonly used in Indiana.
© 2014, Purdue Univ.Purdue Nitrogen Management Update, pg 7 of 10
Fig. 2. Average agronomic optimum N rates (AONR) and economic optimum N rates (EONR)
for corn following soybean on sandy non-irrigated (Sandy NI) soils and medium- and fine-
textured soils in selected geographic regions in Indiana (see Fig. 1). See Tables 2 - 8 for EONR
calculated with other corn prices and N costs.
Table 2. Range of economic optimum N rate (EONR) values (lbs/ac applied N) for corn
following soybean as influenced by nitrogen cost per lb. N (Table 8) and grain price per
bushel based on yield response data summarized over westcentral and southwest
Indiana on medium- and fine-textured soils. The average agronomic optimum N rate
for these regions of Indiana is approximately 183 lbs N/ac.
Based on 38 field-scale trials conducted 2006-2014. These rates assume N management practices that
minimize the risk of N loss prior to plant uptake.
© 2014, Purdue Univ.Purdue Nitrogen Management Update, pg 8 of 10
Table 3. Range of economic optimum N rate (EONR) values (lbs/ac applied N) for corn
following soybean as influenced by nitrogen cost per lb. N (Table 8) and grain price per
bushel based on yield response data summarized throughout Indiana on sandy, non-
irrigated soils. The average agronomic optimum N rate for these sandy, non-irrigated
soils is approximately 184 lbs N/ac.
Based on 14 field-scale trials conducted 2006-2014. These rates assume N management practices that
minimize the risk of N loss prior to plant uptake.
Table 4. Range of economic optimum N rate (EONR) values (lbs/ac applied N) for corn
following soybean as influenced by nitrogen cost per lb. N (Table 8) and grain price per
bushel based on yield response data summarized over northwest and northcentral
Indiana on medium- and fine-textured soils. The average agronomic optimum N rate
for these regions of Indiana is approximately 191 lbs N/ac.
Based on 26 field-scale trials conducted 2006-2014. These rates assume N management practices that
minimize the risk of N loss prior to plant uptake.
© 2014, Purdue Univ.Purdue Nitrogen Management Update, pg 9 of 10
Table 5. Range of economic optimum N rate (EONR) values (lbs/ac applied N) for corn
following soybean as influenced by nitrogen cost per lb. N (Table 8) and grain price per
bushel based on yield response data summarized over southeast Indiana on medium-
and fine-textured soils. The average agronomic optimum N rate for this region of
Indiana is approximately 196 lbs N/ac.
Based on 11 field-scale trials conducted 2006-2014. These rates assume N management practices that
minimize the risk of N loss prior to plant uptake.
Table 6. Range of economic optimum N rate (EONR) values (lbs/ac applied N) for corn
following soybean as influenced by nitrogen cost per lb. N (Table 8) and grain price per
bushel based on yield response data summarized over central Indiana on medium- and
fine-textured soils. The average agronomic optimum N rate for this region of Indiana is
approximately 221 lbs N/ac.
Based on 23 field-scale trials conducted 2006-2014. These rates assume N management practices that
minimize the risk of N loss prior to plant uptake.
© 2014, Purdue Univ.Purdue Nitrogen Management Update, pg 10 of 10
Table 7. Range of economic optimum N rate (EONR) values (lbs/ac applied N) for corn
following soybean as influenced by nitrogen cost per lb. N (Table 8) and grain price per
bushel based on yield response data summarized over northeast Indiana on medium-
and fine-textured soils. The average agronomic optimum N rate for this region of
Indiana is approximately 226 lbs N/ac.
Based on 10 field-scale trials conducted 2006-2014. These rates assume N management practices that
minimize the risk of N loss prior to plant uptake.
Table 8. Range of economic optimum N rate (EONR) values (lbs/ac applied N) for corn
following soybean as influenced by nitrogen cost per lb. N (Table 8) and grain price per
bushel based on yield response data summarized over eastcentral Indiana on medium-
and fine-textured soils. The average agronomic optimum N rate for this region of
Indiana is approximately 233 lbs N/ac.
Based on 25 field-scale trials conducted 2006-2014. These rates assume N management practices that
minimize the risk of N loss prior to plant uptake.
End of document.
© 2014, Purdue Univ.You can also read