Hyperspectral Image Classification using Convolutional Neural Networks
←
→
Page content transcription
If your browser does not render page correctly, please read the page content below
(IJACSA) International Journal of Advanced Computer Science and Applications,
                                                                                                                     Vol. 12, No. 6, 2021

                Hyperspectral Image Classification using
                   Convolutional Neural Networks
                                                Shambulinga M1, G. Sadashivappa2
                                      Dept. of Electronics and Telecommunication Engineering
                                               RV College of Engineering, Bengaluru

    Abstract—Hyperspectral image is well-known for the                 the large dimension complexity and small training samples of
identification of the objects on the earth's surface. Most of the      hyperspectral data. Band selection and transformation are the
classifier uses the spectral features and does not consider the        other methods available to deal with dimensionality. In
spatial features to perform the classification and to recognize the    general, statistical learning techniques have been used to solve
various objects on the image. In this paper, the hyperspectral         the large dimensionality and variability of high dimensional
image is classified based on spectral and spatial features using a     hyperspectral data and when few training samples are
convolutional neural network (CNN). The hyperspectral image is         accessible.
divided into a small number of patches. CNN constructs the high
level spectral and spatial features of each patch, and the multi-          Support vector machine, a popular classification method for
layer perceptron helps in the classification of image features into    hyperspectral data classification, is presented in [7]. SVM is
different classes. Simulation results show that CNN archives the       resistant to the Hughes phenomena and has poor sensitivity to
highest classification accuracy of the hyperspectral image             high dimensionality. In certain situations, SVM-based
compared with other classifiers.                                       classifiers perform better compared to other commonly used
                                                                       pattern recognition strategies in terms of classification
   Keywords—Convolutional       neural   network;    hyperspectral     accuracy. These classifiers were cutting edge technological
image; classification                                                  tools for a long time.
                        I.   INTRODUCTION                                  In recent years, spatial information has become highly
    Latest developments in optics and photonics have made a            relevant for hyperspectral data classification. In terms of
hyperspectral imaging sensor with better spectral and spatial          efficiency, spatial-spectral classification methods provide
resolution. The spatial and spectral information is efficiently        substantial benefits. Many new methods aim to bring spatial
exploited to identify the materials and objects on the earth           information into account to deal with spectral signature spatial
surface. The spectral signatures are modelled in such a way            variability. In [8], applying SVM and a guided image filter, a
that they will differentiate the various objects and materials. It     technique for classifying hyperspectral images has been
is possible to see the identification of different materials,          presented. The guided image filter is used to incorporate the
objects and surface ground cover classes based on their                spatial features into the SVM classifier. In [9], the edge-
reflectance properties as a classification task, i.e. the              preserving filters such as bilateral filter and guided image filter
classification of image pixels based on their spectral                 are included to incorporate the spatial features to the SVM
characteristics. Classification of hyperspectral imaging has           classifier.
been used in a broad range of applications, such as agriculture,           However, it is essential to know which features are most
environmental science, astronomy, surveillance, astronomy and          relevant for the classification algorithms due to the high
biomedical imaging. However, the classification of the                 diversity of represented materials. The various deep learning
hyperspectral images has its own particular problems, in               models [10,11] have been developed for classification
addition to (i) high dimensionality, (ii) the small number of          purposes. These models are trained from various levels of
samples which have been labelled, and (iii) significant spatial        features. The high levels features required for training the
variation of spectral signatures.                                      model are obtained from low-level features. These models
    Much of the recent work on hyperspectral data                      automate the extraction of features for any problem compared
classification follows the traditional pattern recognition             with any convolutional pattern recognition technique. In
method, which comprises of two distinct steps: first, detailed         addition, deep learning systems tend to match and resolve the
handcrafted features are obtained from the original data input,        classification issue more efficiently with wider datasets and
and secondly, classifiers like Support Vector Machines (SVM),          large images with high spatial and spectral resolution. Deep
Neural Networks (NN) [1], maximum likelihood [2],                      learning approaches have already shown promising results for
parallelepiped classification, k nearest neighbours [3],               detecting real artefacts, such as man-made objects or vehicles,
minimum distance [4], and logistic regression [5] have been            as well as for classifying hyperspectral data.
used to learn the extracted features. The “curse of                        More precisely, a deep learning system for the
dimensionality” affects the majority of the algorithms                 classification of hyperspectral data with accurate results was
mentioned above. Any dimensionality reduction-based                    used in [12].
classification approaches [6] have been suggested to manage

                                                                                                                           702 | P a g e
                                                              www.ijacsa.thesai.org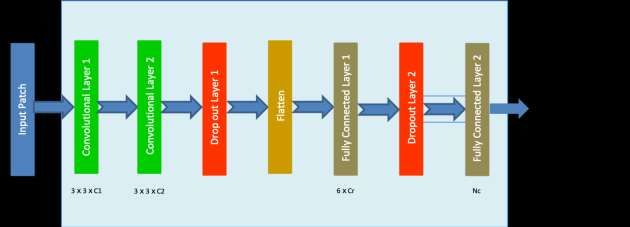
(IJACSA) International Journal of Advanced Computer Science and Applications,
                                                                                                                    Vol. 12, No. 6, 2021

    In precise, the auto encoder’s helps in the design of the          categories. The algorithm sees the input image as an array of a
deep architecture, which hierarchically extracts the high-level        matrix              and it will depend on the image resolution.
spectral features required for the classification of each pixel in     CNN consider the                matrix for the RGB image and
the image. Spectral features were coupled with spatial-                             for the grayscale image. In principle, create the
dominated information in a separate stage and fed to a logistic        CNN model bypassing the input image series through various
regression classifier as input.                                        convolution layers with filters or kernels to extract features,
                                                                       pooling, fully connected layers, and finally applying the
    In the same way, for the classification of hyperspectral data
                                                                       softmax function to detect the objects probabilistic value
into various classes, we suggest a deep learning system. Our
                                                                       between 0 and 1. Fig. 1 shows the entire CNN follow diagram
method, however, is based on a coherent structure that
                                                                       process.
incorporates spectral and spatial information in a single stage,
creating high-level spectral-spatial characteristics at the same       A. Convolution Layer
time.                                                                      The features existing in the input images are extracted
    In specifically, we suggest the use of a Modified                  through a convolution layer. The relationship that exists
Convolutional Neural Network (CNN) that performs the                   between the image's pixels is preserved by taking a small
operation of constructing large-level features and a Multi-            square of input data at the learning phase. The convolution is
Layer Perceptron (MLP) which is used for the classification of         the mathematical operation given by the multiplication of an
the image. The evolved framework builds spectral-spatial               image matrix and a filter or kernel. The convolution operation
characteristics at once under this kind of design and, at a            of the image is shown in Fig. 2.
similar time, performs real-time predictions of the various               Consider an example of an image pixel whose matrix is 5 x
classes in the image because of the existence of feed forward          5 with values 0 and 1 and the filter matrix or kernel 3 x 3. The
network in CNNs and MLPs.                                              convolution layer multiplies the image matrix with a filter
    This paper is organized into five sections: Section II gives a     matrix to provides the convolved feature or feature map. The
brief introduction and background of the convolution neural            same convolved operations are shown in Fig. 3 and Fig. 4.
network. Section III presents the implementation methodology               Use the various types of filters or kernel listed in the
of the convolution neural network for hyperspectral image              Table I for convolution operation. These filters can also
classification. Sections IV and V discuss the results and              perform different mathematical calculations like sharpening of
discussion of the image classification and conclusion.                 the image, blur the image and to detect the edges in the image.
        II. CONVOLUTIONAL NEURAL NETWORK (CNN):                        B. Strides
                     BACKGROUND                                            Strides are used in convolution operation, and it determines
   Convolution neural network (CNN) is the most standard               the shift in the filter kernel matrix by certain number of pixels
deep learning algorithm for image classification and image             on the input image. For example, if stride value is 1 in
recognition problems. Along with these applications, CNN is            convolution operation, then the filter kernel in convolution is
widely used to recognize human faces and classify objects.             shifted by one pixel at a time on the image matrix. If stride
                                                                       value is 2, then a filter kernel is shifted by two pixels at a time
    CNN algorithm takes the input image and extract the
                                                                       on the image matrix. Fig. 5 shows the operation strides by 2
features in the learning phase and classify it to various class or
                                                                       pixels.

                                                        Fig. 1. CNN Flow Diagram.

                                                                                                                           703 | P a g e
                                                             www.ijacsa.thesai.org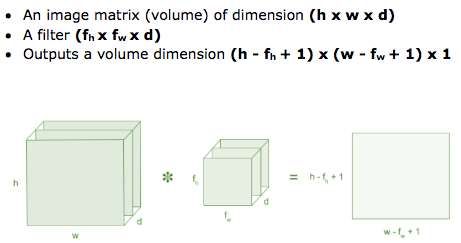
(IJACSA) International Journal of Advanced Computer Science and Applications,
                                                                                                                               Vol. 12, No. 6, 2021

                                                                                           Fig. 5. Stride by 2 Pixels in Convolution Operations.

      Fig. 2. Convolution Operation of the Image using Filter Kernel.
                                                                                 C. Padding
                                                                                      In most of the cases, the chosen filter does not fit to the
                                                                                 input image. In those cases, the following options are used to
                                                                                 fit the input images.
                                                                                     ● Zero paddings: input image is padded with zeros to fit
                                                                                       the input images.
                                                                                     ● Drop a few pixels in the image to fit the input images.
                                                                                 D. Non Linearity (ReLU)
                                                                                    Rectified Linear Unit (ReLU) performs the non-linear
           Fig. 3. Image Matrix Multiplies Kernel or Filter Matrix.              computation in convolution network. The output of ReLU is
                                                                                                   .
                                                                                     The goal of introducing the non-linearity in ReLU is to
                                                                                 learn the non-negative linear values in the convolution
                                                                                 network. Fig. 6 shows the ReLU operation in CNN.

                        Fig. 4. 3 x 3 Output Matrix.

  TABLE I.       FILTERS AND ITS KERNEL FOR CONVOLUTION OPERATIONS

Operation                        Filter

Identity                         [           ]                                                      Fig. 6. ReLU Operation in CNN.

                                                                                    Tanh and sigmoid are the some of the non-linear functions
                                 [                   ]
                                                                                 which can be employed instead of ReLU. But the performance
                                                                                 of ReLU is better compared to the other two non-linear
                                                                                 operations
Edge Detection                   [               ]                               E. Pooling Layer
                                                                                     The pooling layer decreases the output pixels of the
                                 [                       ]                       convolution layer and reduces the complexity of large images.
                                                                                 The spatial pooling is also called subsampling or
                                                                                 downsampling of pixels, and it decreases the spatial dimension
Sharpen                          [                       ]                       of the image by retaining most of the information in the image.
                                                                                 Following are three different categories of spatial poling.
                                                                                     ● Max Pooling
Box blur                             [           ]
                                                                                     ● Average Pooling

Gaussian blur                            [           ]                               ● Sum Pooling

                                                                                                                                           704 | P a g e
                                                                        www.ijacsa.thesai.org
(IJACSA) International Journal of Advanced Computer Science and Applications,
Vol. 12, No. 6, 2021
Max pooling selects the greatest value in the convolved spectral dimensions without losing any image information.
feature value, as shown in Fig. 7. The average pooling selects After dimensionality reduction, split the hyperspectral image
the average pixel value of all the convolved feature value. The into small patches to compatible with CNN's basic nature. Each
sum pooling selects the addition of all the components in created patch contains the spectral and spatial features of a
convolved feature value. single pixel.
More precisely, square patch of dimension centred
at a pixel is used to classify the pixel at location on
the image plane and combine spectral and spatial feature data.
Let us denote the class label of the pixel at the given location
as and patch centred at pixel as . then create a
dataset where and
. The patch is the 3D matrix with size ,
which has spatial and spectral data for each pixel. Furthermore,
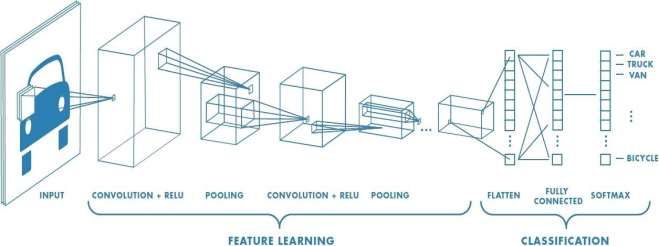
Fig. 7. Max Pooling Operation. this matrix is split into matrixes of size which
are given as an input to the CNN algorithm. This CNN
F. Fully Connected Layer develops the large features that encapsulate the pixel's spectral
The two-dimensional matrix of the pooling layer is and spatial information. The CNN architecture contains many
converted into a single dimension matrix. This single layer layers, as shown in Fig. 10. The first layer in CNN structure is
vector is feed into a fully connected layer similar to a neural the convolution layer with a trainable filter of
network. Fig. 8 shows the operation of a fully connected layer. dimensions 3x3. This layer gives matrices of dimensions 3 x
The output feature matrix is converted to vector as . 3. The second layer is also a convolution layer with
These features are merged to construct a model using a fully trainable filter. The output of the convolution layer is given
connected layer and finally use softmax or sigmoid function to to flatten layer and fully connected layer. The flow chart for the
classify the outputs. implementation of hyperspectral image classification using a
convolutional neural network is shown in Fig. 11.
IV. RESULTS AND DISCUSSIONS
The Hyperspectral image is used to simulate the proposed
algorithm. Indian pines dataset is the hyperspectral image
captured at north western Indiana test site using AVIRIS
sensors, and its specification is shown in Table II. The overall
accuracy, test loss, precision, recall and f1-score are parameters
used to analyze the performance of algorithm.
In the simulation, PCA reduces the spectral bands, and 30
principal components are chosen for the classification. After
Fig. 8. Fully Connected Layer in CNN.
dimensionality reduction, each patch contains
dimensions. During the simulation, the patch size is defined
III. METHODOLOGY
as 5 to consider the nearest 24 neighbours of each pixel. Each
The implementation methodology of hyperspectral image patch is given to the CNN architecture for classification.
classification using the CNN approach is shown in Fig. 9. The
hyperspectral image is defined as a 3-D matrix of size The classification accuracy obtained for the 5 x 5 patch is
, where and represent the image's height and width 84.12%, with a simulation time of 1142.26 seconds. The
and represents the spectral channel in the image. The screenshot of the results and the classified image is shown in
hundreds of channels in the hyperspectral image enhance the Fig. 12. The test loss for the same is 47.33%. The precision,
calculating time and memory resources of the training and recall and f1-score of the individual class is shown in Fig. 12.
prediction process. On the other hand, using statistical analysis, The patch size is increased to 7, 9, 11 and 13 to increase the
it is observed that the spectral response variance is minimal for number of neighbours for each pixel.
the pixel that belongs to each class.
TABLE II. SPECIFICATION OF INDIAN PINES DATASET
It means for every channel, pixels with the same class
labels have related spectral values, and pixels with different Image size 145x145 pixels
class labels have different spectral values. A dimensionality Spectral bands 224
reduction procedure can be used, based on these properties, to Spectral range (0.4-2.5)µm
decrease the dimensionality of the input data, to optimize the
training and classification processes. PCA is the dimensionality No. of Class 16
reduction algorithm that reduces the hyperspectral image's
705 | P a g e
www.ijacsa.thesai.org(IJACSA) International Journal of Advanced Computer Science and Applications,
Vol. 12, No. 6, 2021
Satellite Create CNN Performance
PCA
Image Patches Classifier measures
Fig. 9. Block Diagram of the Implementation of Image Classification using Convolutional Neural Networks.
Fig. 10. CNN Architecture.
Fig. 12. Screenshot of CNN Classification with 5 x 5 Patch Size.
Increasing the patch size enhance the classification
accuracy and increases the simulation time. The results of
CNN classification with different patch size is shown in
Fig. 13. The accuracy and computation time of CNN
classification is given in Table III. From the table, it can be
seen that CNN achieves the highest classification accuracy and
computation time for the patch size 13 x 13. No further
improvements are observed in classification accuracy for the
patch size of more than 13, and in fact, the accuracy of the
classifier deteriorates and increases the computational
resources. The proposed CNN algorithm for the classification
of the hyperspectral image is compared with the Support vector
machine classifier as shown in Table IV. Support vector
machine uses the spectral features for classification and spatial
Fig. 11. Flow Chart of an Implementation of Hyperspectral Image features are add to SVM output by using guided image filter
Classification.
and bilateral filter.
706 | P a g e
www.ijacsa.thesai.org(IJACSA) International Journal of Advanced Computer Science and Applications,
Vol. 12, No. 6, 2021
Patch size 5 x 5 Patch size 7 x 7 Patch size 9 x 9 Patch size 11 x 11 Patch size 13 x 13
Fig. 13. Results of CNN Classification with different Patch Size.
TABLE III. ACCURACY AND COMPUTATION TIME OF CNN CLASSIFICATION WITH DIFFERENT PATCH SIZE
Patch Size 5x5 7x7 9x9 11 x 11 13 x 13
Overall Accuracy(%) 84.12 91.10 95.00 97.42 98.28
Computation time (sec) 1142.26 2111.512 3047.524 4263.925 5002.114
TABLE IV. COMPARISON OF SVM AND CNN CLASSIFICATION METHODS
SVM with SVM with SVM with SVM with
SVM with SVM with SVM with SVM with
Methods SVM [8] PCA & LDA and PCA & BF LDA and BF CNN
PCA [8] LDA [9] GIF [8] BF [9]
GIF [8] GIF [9] [9] [9]
Overall Accuracy
91.28 88.1 86.53 99.04 98.99 96.37 98.89 98.93 96.53 98.28
(%)
Computation
4117.7 568.11 423.58 4118.15 568.25 424.1 4118.03 568.32 424.08 5002.114
Time (sec)
Along with SVM, the dimensions of the spectral features REFERENCES
are reduced using PCA and LDA. The SVM method along [1] S.Li, W.Song, L.Fang, Y.Chen, P.Ghamisi and J.A.Benediktsson, "Deep
with guided image filter and bilateral filter increases the Learning for Hyperspectral Image Classification: An Overview,"
in IEEE Transactions on Geoscience and Remote Sensing, vol. 57(9),
classification accuracy and SVM method along with PCA and pp. 6690-6709, 2019.
LDA decreases the computational time. CNN algorithm [2] D. Saqui, J. H. Saito, L. A. D. C. Jorge, E. J. Ferreira, D. C. Lima and J.
combines both spectral and spatial features at the same time P. Herrera, "Methodology for Band Selection of Hyperspectral Images
without using guided image filter and bilateral filter. CNN Using Genetic Algorithms and Gaussian Maximum Likelihood
algorithm archives the highest classification accuracy Classifier," International Conference on Computational Science and
compared to the SVM classification accuracy with increasing Computational Intelligence (CSCI), Las Vegas, NV, 2016, pp. 733-738.
computation time. SVM algorithm consumes less [3] B. Tu, J. Wang, X. Kang, G. Zhang, X. Ou and L. Guo, "KNN-Based
Representation of Superpixels for Hyperspectral Image Classification,"
computational time compared with CNN algorithm. in IEEE Journal of Selected Topics in Applied Earth Observations and
Remote Sensing, vol. 11, no. 11, pp. 4032-4047, Nov. 2018.
V. CONCLUSION
[4] W. Li, S. Prasad, E. W. Tramel, J. E. Fowler and Q. Du, "Decision
The hyperspectral image is classified using a convolutional fusion for hyperspectral image classification based on minimum-
neural network. Both spectral and spatial features are distance classifiers in thewavelet domain," IEEE China Summit &
considered to classify the image. Spatial features are included International Conference on Signal and Information Processing, Xi'an,
2014, pp. 162-165.
in the classification to improve the classification. CNN
[5] S. Bajpai, H. V. Singh and N. R. Kidwai, "Feature extraction &
archives the highest classification accuracy of 98.28% classification of hyperspectral images using singular spectrum analysis
compared to support vector machine classifier and other & multinomial logistic regression classifiers," 2017 International
methods. CNN accuracy depends on the patch size considered Conference on Multimedia, Signal Processing and Communication
for the classification. Patch size indicates the number of spatial Technologies (IMPACT), Aligarh, 2017, pp. 97-100.
features considered for classification. It is observed that the [6] Q. Sun, X. Liu and M. Fu, "Classification of hyperspectral image based
patch size of 13 x 13 is enough to achieve the highest accuracy. on principal component analysis and deep learning," International
Conference on Electronics Information and Emergency Communication,
CNN consumes more computation time for training and testing 2017, pp. 356-359.
compared with other classifiers. The proposed method avoids [7] S. Zhong, C. Chang and Y. Zhang, "Iterative Support Vector Machine
the usage of an edge-preserving filter to incorporate spatial for Hyperspectral Image Classification," International Conference on
features into the classification. Image Processing, 2018, pp. 3309-3312.
707 | P a g e
www.ijacsa.thesai.org(IJACSA) International Journal of Advanced Computer Science and Applications,
Vol. 12, No. 6, 2021
[8] Shambulinga M and Sadashivappa G., "Hyperspectral Image in Applied Earth Observations and Remote Sensing, vol. 12( 9), pp.
Classification using Support Vector Machine with Guided Image Filter" 3615-3622, 2019.
International Journal of Advanced Computer Science and Applications, [11] I.Bidari, S.Chickerur, H.Ranmale, S.Talawar, H.Ramadurg and
vol. 10(10), 2019. R.Talikoti, "Hyperspectral Imagery Classification Using Deep
[9] Shambulinga M and G. Sadashivappa, "Supervised Hyperspectral Image Learning," Conference on Smart Trends in Systems, Security and
Classification using SVM and Linear Discriminant Analysis" Sustainability, 2020, pp. 672-676.
International Journal of Advanced Computer Science and Applications, [12] S.Liu, Q.Shi and L.Zhang, "Few-Shot Hyperspectral Image
Vol. 11(10), 2020. Classification With Unknown Classes Using Multitask Deep Learning,"
[10] M.S.Aydemir and G.Bilgin, "Semisupervised Hyperspectral Image in IEEE Transactions on Geoscience and Remote Sensing, 2020.
Classification Using Deep Features," in IEEE Journal of Selected Topics
708 | P a g e
www.ijacsa.thesai.orgYou can also read