SPECTRAL DIRECTIONAL FILTER BANK FOR SIDESCAN SONAR SEGMENTATION WITH UNSUPERVISED NEURAL NETWORK APPROACH
←
→
Page content transcription
If your browser does not render page correctly, please read the page content below
1st International Conference and Exhibition on Underwater Acoustics UAM
                                    Island of Corfu, Greece, 23rd-28th June 2013

SPECTRAL DIRECTIONAL FILTER BANK FOR SIDESCAN
SONAR SEGMENTATION WITH UNSUPERVISED NEURAL
NETWORK APPROACH

Ahmed Nait-Chabanea, Benoit Zerrb, Gilles Le Chenadecc.

Lab-STICC, UMR CNRS 6285, Ocean Sensing and Mapping-ENSTA Bretagne-
2, rue François Verny 29806 BREST Cedex 9 France.

a
    ahmed.nait_chabane@ensta-bretagne.fr; bBenoit.Zerr@ensta-bretagne.fr;
c
    Gilles.Le_Chenadec@ensta-bretagne.fr.

Tel: +332.98.34.87.12
Fax: +332.98.34.87.50

Abstract: This paper deals with the unsupervised segmentation of textured seafloors from
sidescan sonar imagery. The classical approaches for texture analysis are based on the
estimation of co-occurrence matrices (which express the distribution of co-occurring
values at a given offset) and the Haralick features derived from. However, the GLCM is
strongly dependant on the parameterization of the offset (e.g. the distance d and the
angular direction θ for the estimation of the number of co-occurring values). In most
cases it is not at all obvious how such a choice should be made for (d, θ) and it is even
more difficult to arrange for it to be made automatically. In this paper, we investigate the
ability of another approach based on spectral features to discriminate between seabed
textures. Spectral features are estimated from directional filter bank (DFB) in the 2D-
Fourier space. A subsequent analysis of the pattern isotropy is conducted by dividing the
medium spectral band into small, overlapped, angular sectors. The unsupervised
segmentation used is a modified version of Kohonen SOFM (Self-Organizing Feature
Maps) with splitting process of images to take into account the grazing angle dependency.
The data used in our tests are sonar images recorded by Klein 5000 sidescan sonar.

Keywords: Sidescan sonar images, texture analysis, spectral analysis, directional filter
bank (DFB), unsupervised segmentation, SOFM (Self-organizing feature maps).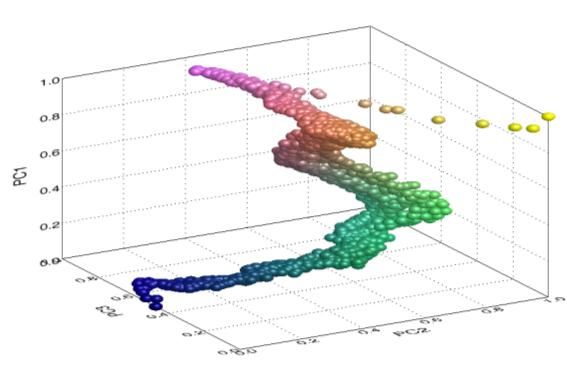
1st International Conference and Exhibition on Underwater Acoustics UAM
                                  Island of Corfu, Greece, 23rd-28th June 2013

1. INTRODUCTION

   Texture analysis is a major stage to accurately classify or segment an image. It refers to
a class of mathematical procedures and models that characterize the spatial variations
within imagery as a mean of extracting information. In image processing and vision, the
notion of texture is often addressed by two approaches according to Haralick [1]. The first
statistical approach analyze the spatial distribution of grey values, by computing local
features at each point in the image, and deriving a set of statistics from the distributions of
the local features. Depending on the number of pixels defining the local feature, statistical
methods can be further classified into first order (one pixel), second-order (two pixels) and
higher-order (three or more pixels) statistics. The second is structural approach and is
suitable for macro-textures in the periodicity of the patterns are evident.
   Several methods of texture analysis are proposed in literature, they are based on first
order statistics derived from image histogram, on second order statistics like Grey Level
Co-occurrence Matrix (GLCM) and methods based on spectral analysis (Gabor filters,
Wavelet, Fourier transform…). The GLCM is a second order statistical tool widely used
for texture analysis of images. The ability of GLCM features to discriminate seabed
textures has been shown in several works [2]-[4]. However, the GLCM is strongly
dependant on the choice of parameter values (e.g. the distance and the angular direction
for the estimation of the number of transitions). Author [5] points out that for the GLCM
estimation in texture recognition, “careful choice of specific sample (d:cooccurence
distance, θ: angle direction) values must be made: in most cases it is not at all obvious
how such a choice should be made, and it is even more difficult to arrange for it to be
made automatically”.
   In this work, a combination of two techniques of texture analysis is used. The first one
is based on GLCM and Haralick features derived from. The second techniques uses a
directional filter bank (DFB) applied on Fourier spectrum of images. The study carried out
in this paper is specially focused on the ability of spectral features to discriminate seabed
textures.
   The spectral features computed for the segmentation step are estimated from a
directional filter bank in the 2D-Fourier space. The directional filter bank (DFB) originally
introduced by [6], has been proven to be effective in processing image with directional
information. The classical DFB shares its properties with the traditional Wavelet transform
(DWT). Non uniform DFB (nuDFB) proposed by [7] divides the spectrum in one low-pass
with one to four decimation factor and six high- pass with one to eight decimation factor.
The nuDFB offers better performances in classifying the classical Brodatz textures than
the traditional DFB [8].
   In this work a new DFB is proposed. Fourier spectrum is separated into three spectral
bands: low-pass, medium-pass and high-pass frequencies. As most of the image patterns
resolved by the sonar are located in the medium frequency band, a subsequent analysis of
the pattern isotropy is conducted by dividing the medium spectral band into small,
overlapped, angular sectors (typically 30 degrees wide with 2/3 overlapping)
   For the sonar images, the statistical description of the backscattering is not constant
over the full swath of the sonar. Thus, the segmentation results of algorithms applied to
sidescan sonar images are non optimal with poor sonar compensation, artifact classes with
borders parallel to the ship track are often seen [4].This artifact is principally due to the
grazing angle dependency of statistical features derived from sonar data. The aim of image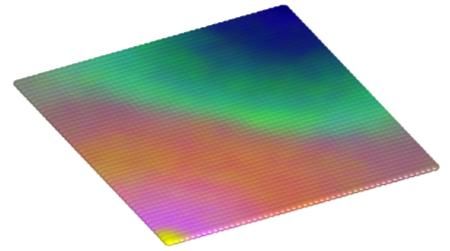
1st International Conference and Exhibition on Underwater Acoustics UAM
                                   Island of Corfu, Greece, 23rd-28th June 2013

compensation for classification is to reduce grazing angle effects on the image. Two
approaches to compensation exist: the first is based on sonar calibration. This approach
needs a strong knowledge on the conditions of acquisition and sonar system
characteristics. The second approach is based on the estimation of a law describing the
change in energy with grazing angle and uses this law to correct each amplitude sample.
The law is either estimated from the data or based on a mathematical or physical model of
backscattering (Lambert, Jackson) whose parameters are estimated from the data. The
authors [4] and [9] specify that the empirical law estimation determine significantly the
quality of the segmentation results, because of assumptions of flat and homogeneous
bottom seafloor.
   To avoid any preprocessing step, we used the algorithm detailed in [10], in which the
sonar slant range is divided into small stripes. In this case, in each stripe the statistics can
be considered homogeneous.
   The unsupervised segmentation used is achieved by a modified version of Kohonen
SOFM (Self-Organizing Feature Maps). The choice of this algorithm is justified by its
ability to preserve the topological properties of the input feature space. In our case, SOFM
algorithm allows better management transition between stripes images for the
segmentation step. Satisfactory results on the application of the SOFM algorithm on sonar
images were presented in our previous work [10].
   The paper is organized as follows. In the second section, the methodology of this work
is presented. Then, classical DFB and the proposed DFB are introduced in section 3. In
section 4, we present feature vector extracted for segmentation. Section 5 presents a color
table created to attribute colors for classes obtained from SOFM algorithm. Then,
unsupervised classification of sonar images data base using three algorithms: K-means,
Hierarchical clustering and SOFM are shown in section 6. Finally, section 7 and 8
respectively conclude with experimental results and conclusion of this paper.

2. METHODOLOGY

   This paper uses an unsupervised segmentation algorithm of sidescan sonar images
without pre-processing stage. The idea is to divide the range into narrow images stripes in
which the statistical analysis of the backscattered signal can be considered in the same
grazing angle range.
   The raw image data is splitted in the direction of the range of the sonar on overlapping
narrow stripes. In each stripe a set of features are computed: Haralick features and spectral
features. Then, the pixels of each stripe are segmented by an unsupervised classifier,
starting with the central stripe (mid range of sonar system). The choice to start with the
central strip is not arbitrary, because in this part of the sonar image called “sweet spot” by
[11], the backscattered signal is considered optimal.
   The adjacent stripes are then sequentially segmented from the central stripe up to the
two sides of the image. The continuity between the stripes is provided by the SOFM
learning algorithm phase. Thus, the learning parameters of a given stripe of the image are
initialized with those of the previous one. The process is repeated until the two limits of
the image. The diagram in Fig. 1 summarizes the methodology followed in this work.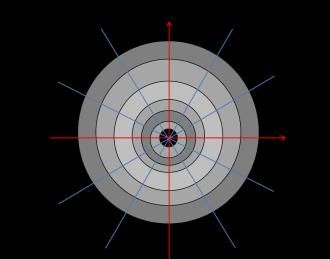
1st International Conference and Exhibition on Underwater Acoustics UAM
                                   Island of Corfu, Greece, 23rd-28th June 2013

                                                        Sonar Image

                                                      Splitting process

                    GLCM features                     Features vector                   Spectral features

                                             Non-supervised classification of
                                             features vector based on SOFM

            Color table creation              Segmentation of Sonar image

                                                      Segmented Image
                      Fig.1: Steps of the unsupervised algorithm process.

3. DIRECTIONAL FILTER BANK (DFB)

   Fourier analysis can be used to study the properties of textured scenes; the power
spectrum reveals information on the periodicity and directionality of a texture. Texture
directionality is preserved in the power spectrum because it allows directional and non-
directional components of the texture to be distinguished.
   The concept of multichannel spectrum of decomposition is introduced by Mallat in his
work on the discrete wavelet transform (DWT) [12]. The classical directional filters
(DFB) based on this concept were introduced first by Bamberger and Smith [6] Fig. 2-(a).
In [7] the non-uniform directional filter bank (nuDFB) is introduced Fig. 2-(b). Our
approach for directional filter bank is similar to that applied by nuDFB which decomposes
into low-pass, medium-pass and high-pass frequency Fig. 2-(c).
   The spectral features used in this work are estimated from directional filter bank in the
2D-Fourier space. First the Fourier spectrum is separated into three spectral bands: low,
medium and high frequency. As most of the image patterns resolved by the sonar are
located in the medium frequency band, a subsequent analysis of the pattern isotropy is
conducted by dividing the medium spectral band into small overlapped angular sectors
(typically 30 degrees wide with 2/3 overlapping) using the proposed DFB presented in the
Fig.2-(c).
1st International Conference and Exhibition on Underwater Acoustics UAM
Island of Corfu, Greece, 23rd-28th June 2013
(a) (b) (c)
Fig.2: Frequency partition of the filters bank: (a) classical DFB, (b) Non-uniform DFB
(nuDFB), (c) proposed DFB with six spectral bands and 12 angular sectors.
Fig.3. column1: ripples, sand and rock, column 2: the Fourier spectrum,
Column 3: low pass frequencies, column 4: medium pass frequencies, column 5: high
pass frequencies, column 6: representation in polar coordinates of the medium pass
frequencies.
4. FEATURES VECTOR CREATION
The features vector calculated for the segmentation combines 57 features computed
from GLCM and spectral analysis: 32 Haralick features using a 64x64 pixels analysis
window with 8x8 overlapping of and 24 Fourier features. For the spectral features six
features are computed directly from the Fourier spectrum: Mean, variance and the power
of magnitude for low-pass, medium-pass and high-pass frequencies. The others spectral
features are computed by proposed DFB presented in Fig. 2. In each angular sector
statistics are computed in six spectral bands (mean, standard deviation and skewness, see
Table.1). To take into account the incidence angles sonar variations, grazing angle of
sonar is added to the features vector. The features computed in this work are listed in the
Table. 1.
5. COLOR TABLE CREATION1st International Conference and Exhibition on Underwater Acoustics UAM
Island of Corfu, Greece, 23rd-28th June 2013
The SOFM algorithm transforms the high dimension feature vector into a two
dimensional discrete map of neurons subject to a topological constraint with particularity
of neighborhood preserving. The adaptation of the SOFM algorithm we previously
proposed [10] is based on the learning of parameters of a series of SOFM algorithm (one
for each stripe). The classification of a given stripe of sonar image by the SOFM algorithm
is initialized by the final values parameters calculated on the previous learning algorithm
stripe. The color of the chosen class is based on the color of the nearest neuron which is
originally chosen randomly. Such a random process does not ensure that from one stripe to
another, the color of classes is the same. To solve this problem, a common color table has
been created from all images recorded by the sonar. The color table is based on the use of
the features vector shown in the Table. 1. For a good human visualization and
comprehension, three RGB colors (Red, Green and Blue) is one of the most appropriate
representations. A principal component analysis (PCA) has been used to reduce the
features space dimensionality from 57 features to the three most important in terms of
variance values. The first three axes of PCA result represent more than of 90 % of total
variance and define the RGB color table. An example of color table of 48x48 sizes is
shown in Fig. 4.
Type of Feature Number of
Features
Texture Analysis
Kurtosis 4 (0°,45°,90°,135)
Elongation Factor 4
Entropy 4
Contrast 4
Heterogeneity 4
Homogeneity 4
Correlation 4
4
Max. of probability
Spectral analysis
Mean of magnitude
1
Variance of magnitude 1
power of magnitude 1
Low pass frequency 1
Medium pass frequency 1
High pass frequency 1
Mean of DFB 6 (six bands)
Standard deviation of DFB 6
Skewness of DFB 6
Grazing angle 1
Total 57 Features
Table 1: Features computed from texture analysis and spectral analysis.1st International Conference and Exhibition on Underwater Acoustics UAM
Island of Corfu, Greece, 23rd-28th June 2013
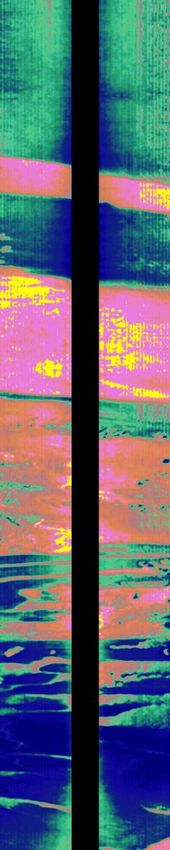
Fig. 4: a) Three axes PCA representation of the Kohonen map of 48x48 neurons size;
b) Color table (RGB) created after PCA reduction of features space dimensionality.
6. UNSUPERVISED SEGMENTATION APPROACH
The approach used in this work does not take into consideration the conditions of
acquisition and the physical properties of the seabed backscattering. The backscattered
energy considered as a textured image. To avoid the definition of a physical law
describing the change in energy with grazing angle, we used the algorithm proposed in
[10]. The principle is to divide the slant range into small stripes, where the statistics can be
considered unaltered by the grazing angle variations. The starting stripe at mid sonar slant
range is segmented with an unsupervised classifier. Then, from the knowledge acquired on
the segmentation of this first stripe, the classifier adapts its segmentation to the
neighboring stripes, allowing slight changes of statistics from one stripe to the other. The
operation is repeated until the beginning and the end of the slant range are reached. The
unsupervised segmentation of a slant range stripe is an adaptation of the Kohonen
algorithm SOFM (Self-Organizing Feature Maps) [13].
7. EXPERIMENTAL RESULTS
The data used for our study were obtained during the BP’02 (Battlespace Preparation)
experiments carried out by the SACLANT Undersea Research Centre in La Spezia, Italy.
The system used is the Klein 5000 sidescan sonar operating at 455 kHz. The sensor can
work on two modes of resolution. In low resolution mode, the along-track resolution is 20
cm and the maximum range is 150m on each side of sonar which gives a swath of 300m.
In high resolution mode, the along-track resolution is 10 cm and the maximum range is
limited to 75m (i.e. a swath of 150m). In both modes, the across-track resolution is 3cm.
In our case we only use images acquired in high resolution mode.
To assess the performances of spectral DFB features on the sidescan sonar images
classifications a data set of 400 images of four (4) types of sediment (Posidonia oceanica,
rock, ripples and Sand) is created from the sonar data images used. The size of each image
is 128x128 pixels. The data base is shown in Fig. 5.1st International Conference and Exhibition on Underwater Acoustics UAM
Island of Corfu, Greece, 23rd-28th June 2013
Fig. 5: Data set of 400 images for 4 types of sediment: Ripples, Posidonia oceanica,
Rock and Sand, for different grazing angles of sonar.
Three approaches are used in this work for the unsupervised classification of the dataset
shown in Fig. 5. The first based on the classical K-mean algorithm and the second one is
based on Hierarchical clustering class and finally the SOFM (Self-Organizing features
maps). The comparison is made on the classification accuracy for each algorithm for three
configurations: the first is to use only Haralick features, the second is to use spectral
features then the last to use the combination all features listed in Table.1.
Correctly Classified Instances (%)
Method of classification K-means Hierarchical Clustering SOFM
Haralick 63.03 36.50 59.00
Features used Spectral 44.00 38.75 51.75
All features 65.19 52.53 65.50
Table 2: Classification accuracy of the data set of Fig.5 in three configurations of
features used: Haralick, spectral and the combination of all feature using three
unsupervised algorithm: K-means, Hierarchical clustering and SOFM.
From the Table.2, the Haralick features used alone gives better classification results
than spectral features in the all cases with best result of 63.03 % given by K-means
algorithm.
The three unsupervised algorithm K-means, Hierarchical Clustering and SOFM give
best results in the case of combination of all features, respectively with classification
accuracy of 65.19 %, 52.53 % and 65.50 %. We also note, that the SOFM classify better
the data base than the K-means algorithm in the case of using spectral and all features.
The segmentation result of an example sonar image with unsupervised SOFM
algorithm using all features and color table of Fig.4 is shown on Fig. 6.1st International Conference and Exhibition on Underwater Acoustics UAM
Island of Corfu, Greece, 23rd-28th June 2013
Fig. 6: Segmentation result of an example of sonar image using SOFM algorithm by
combination of all features and with color table shown in Fig.4
8. CONCLUSION
In this paper, we propose directional filter bank DFB for spectral features analysis. A
combination of the proposed spectral features with the Haralick features derived from
GLCM gives better classification results than the used only of GLCM features.
Unsupervised algorithms tested on the created sonar data base confirm the ability of DFB
features to discriminate of seabed textures. We also note that the grazing angle feature
improves the classification accuracy. The qualitative segmentation of sonar images using
all features with an adaptation SOFM algorithm give god result. However, the
improvement of classification results on combined features show that GLCM and spectral
features provide complementary descriptions of seabed textures. Further study will be
conducted to analyze more deeply this complementarily.
REFERENCES
[1] R.M. Haralick. Statistical and structural approaches to texture”. Proceeding of the
IEEE, vol. 67 no 5, p 786-804.1979.
[2] C. Capus; IT Ruiz; Y. Petillot. Compensating for changing beam pattern and
classfication. In:Proceedings of seventh European on underwater acoutics, Delft, NL;
2004.p. 827-32.
[3] Ph. Blondel, L.M. Parson, V. Robigou. TexAn: Textural Analysis of Sidescan Sonar
Imagery and Generic Seafloor Characterisation. Proc. OCEANS'98, IEEE-OES, 1998.
[4] N. Pican; E. Trucco; M. Ross; D.M. Lane; Y. Petillot; I. Tena Ruiz. Texture
Analysis for Seabed classification: Co-occurrence Matrices vs Self-Organizing Maps.
OCEANS '98 Conference Proceedings, Nice, France, vol.1, no., pp.424-428 vol.1,
1998.
[5] J. Preston. Automated acoustic seabed classification of multibeam images of Stanton
Banks. Applied Acoustics, vol. 70(10), p. 1277 – 1287.2009.1st International Conference and Exhibition on Underwater Acoustics UAM
Island of Corfu, Greece, 23rd-28th June 2013
[6] Davies, ER. Introduction to Texture Analysis. In Handbook of Texture Analysis, (eds.
Mirmehdi et.al.), Word Scientific Publ, 2008.
[7] R. H. Bamberger and M. J. T. Smith. A filter bank for the directional decomposition
of images: Theory and design. IEEE Trans. Signal Proc., vol. 40, no. 4, pp. 882–893,
April 1992
[8] T. T. Nguyen, S. Oraintara. A multiresolution directional filter bank for image
applications. In proceeding of: Acoustics, Speech, and Signal Processing, (ICASSP
'04). IEEE International Conference on, Volume.3,2004.
[9] T. T. Nguyen; S. Oraintara. Texture classification Using Non_uniform Directional
Filter bank. IEEE 11th Digital Processing workshop & IEEE signal processing
Education Workshop.2004.
[10] A. Nait-Chabane; B. Zerr, G. Le Chenadec. Range-independent segmentation of
sidescan sonar images with unsupervised SOFM Algorithm (Self-Organizing Feature
Maps). Proceedings of Meetings on Acoustics; POMA 2012 Oct 15.
[11] P. Chapple. Automated detection and classification in high-resolution sonar
imagery for autonomous underwater vehicle operations. Australian Government
Department of Defence Technical Report, DSTOGD-0537, 2008.
[12] S.G. Mallat. A theory for multiresolution signal decomposition: The wavelet
representation”. IEEE Trans. On Pattern Analysis and Machine Intelligence, 11:674–
693.1989.
[13] T. Kohonen. Self-Organizing Formation of Topologically Correct Feature Maps. In
Proceedings Biological Cybernetics, vol. 46, p. 59-69, 1982.
[14] Haralick. R M. Statistical and Structural Approaches to Texture. Proc. IEEE, Vol.67,
N”5, May 1979.You can also read