First Year Evaluation: Smarter Lunchroom Movement at Rowville Primary School 2019-2020 - EACH
←
→
Page content transcription
If your browser does not render page correctly, please read the page content below
First Year Evaluation:
Smarter Lunchroom Movement
at Rowville Primary School
2019-2020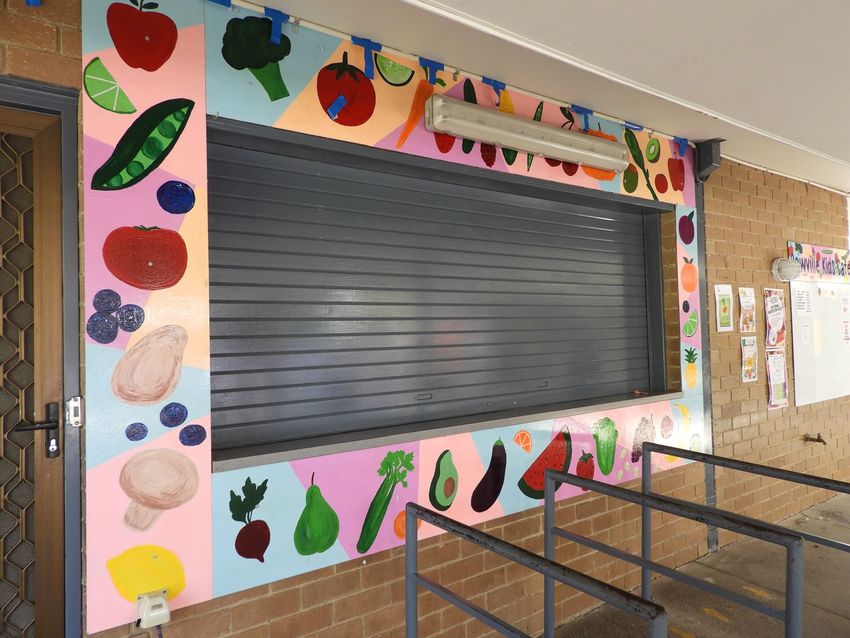
Data collected 2019 & 2020
Canteen sales:
• Manual counting of sales at recess and lunch for 5 typical consecutive school days
• Data taken same week of student survey
• Data taken in term 1 (summer) and repeated in term 3 (winter) each year*
• Some information in this presentation has incorporated other baseline data collected
amongst students and parents in term 1 2019.
Student survey:
• Grade 3 & 4 students surveyed in 2019 and will be followed for the next 2 years;
• 2019 98% response rate (n=135 students) 2020 100% response rate (n=132)
• International students excluded
*Winter data 2020 unable to be collected due to COVID-19 restrictions.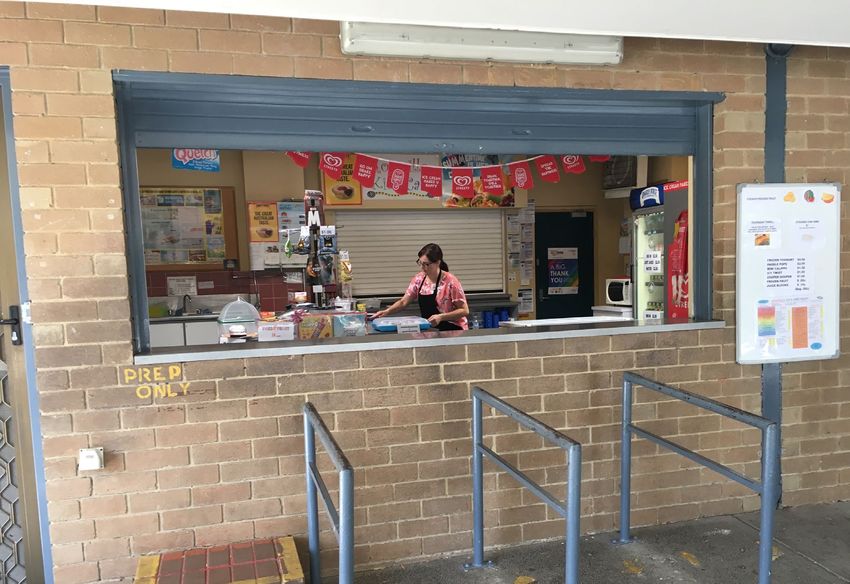
Data collected 2019
Nutrition Week October 2019:
    • Series of questions asked of students in the form of a ‘graffiti wall’ activity to inform
       project actions
    • Data, photo and observations collected from nutrition week activities
    • Staff survey regarding outcome of nutrition week activities, curriculum support and
       investigated staff attitudes toward healthy eating within school responsibilities (n=22
       staff)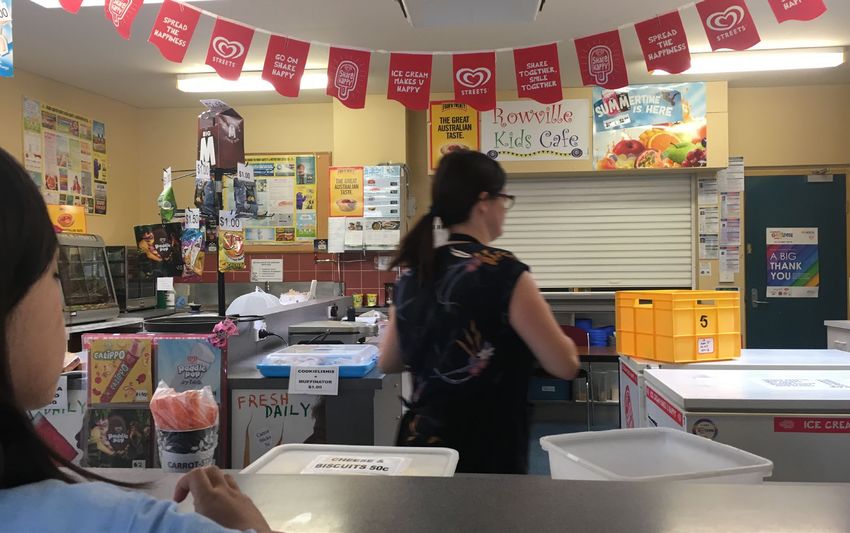
Rowville Health &
 Wellbeing Team
• After one year, membership increased
  116% as we attracted 6 additional
  parent members and 1 additional staff
  member.
• Term 1 2020, 4 working groups formed
  to work on projects concurrently.
• Term 2 2020, working groups on hold
  due to COVID-19 restrictions, instead
  whole team meetings held online with
  increased frequency.

                                          2019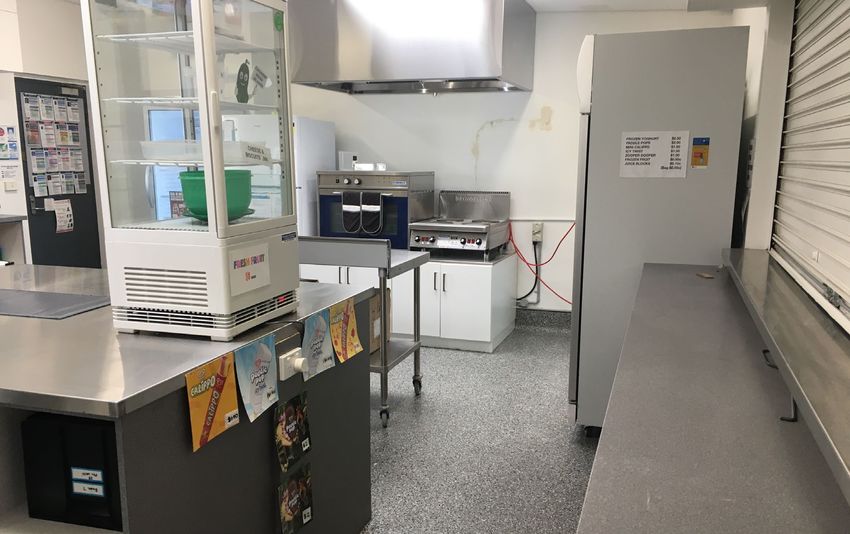
Smarter Lunchroom Strategies
               Implemented;
          Canteen Development
•   Healthy atmosphere
•   Student involvement
•   Product placement and advertising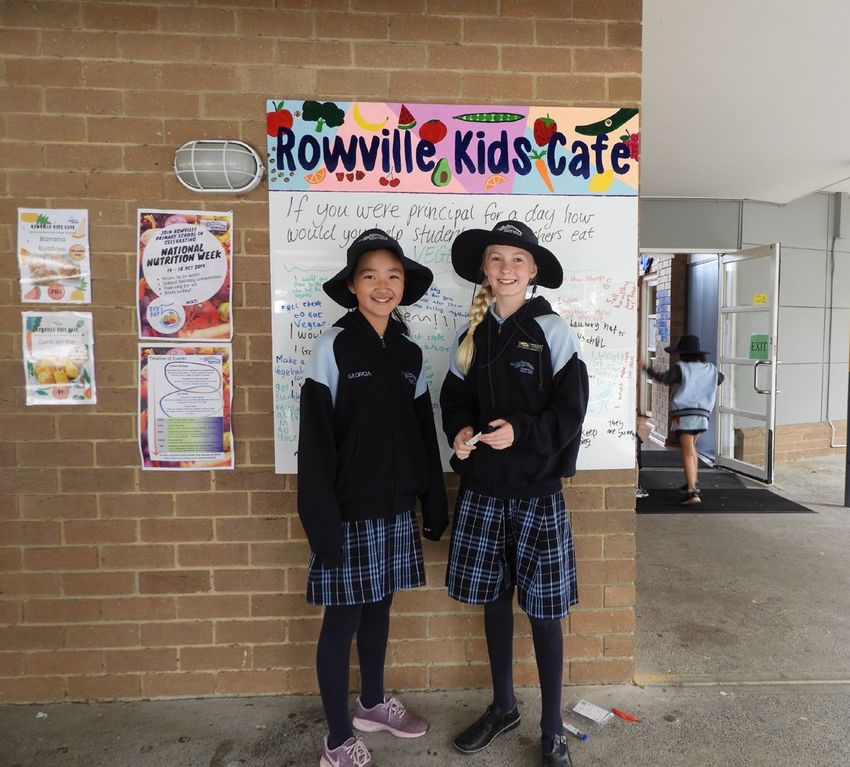
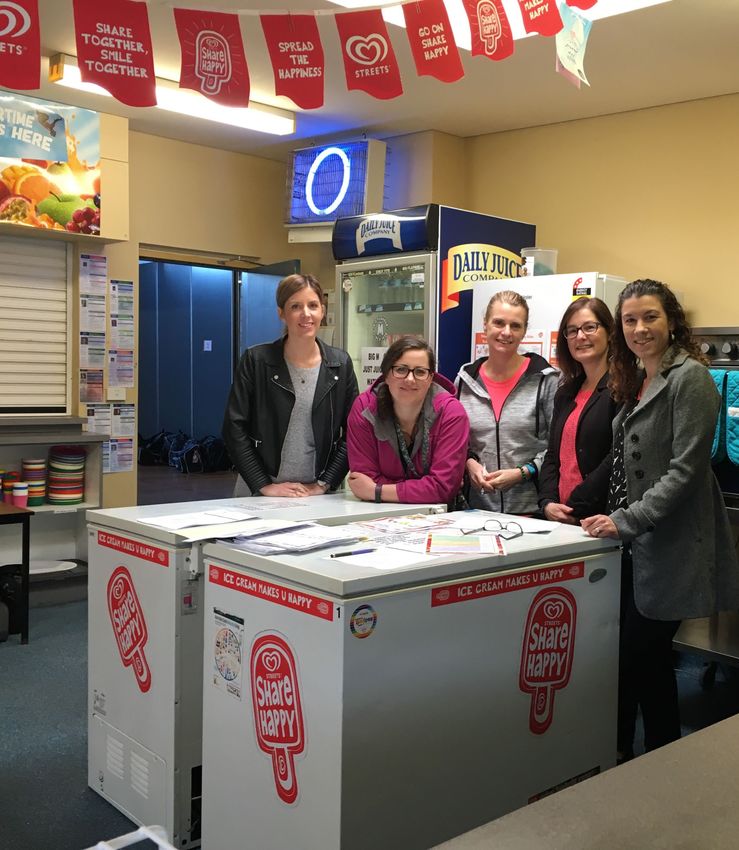
Rowville Kids Café – Smarter Lunchroom
developments; Healthy atmosphere &
student involvement
• Canteen veg art mural created by Art
            Club students

                                                          October 2019

                                         • New specials board
                    January 2019           for ‘green’ item
                                           advertising

                                                                         October 2019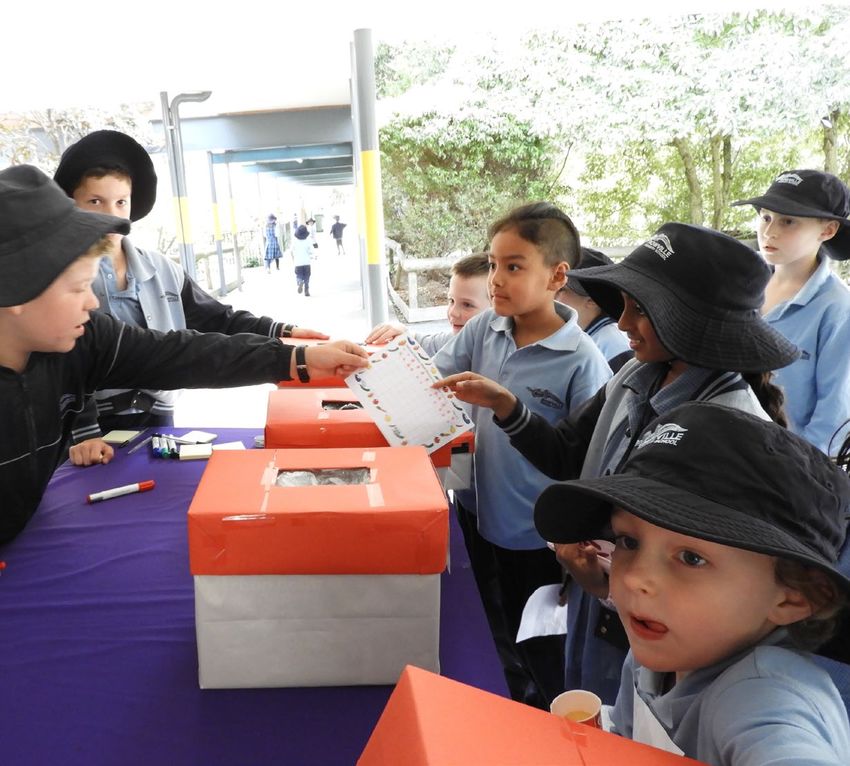
Rowville Kids Café – Smarter Lunchroom
                developments; Product placement and advertising
                        ‘Red’ item advertising removed. Walls repainted and ready
                        for ‘green’ item promotion (student led project).

                        ‘Green’ items moved to the front and up to eye level.
                        Refrigerated glass storage installed for countertop fresh
                        ‘green’ food display.
                                  Cooktop and rangehood installed to accommodate
                                  cooking fresh food.
Baseline 2019

Winter 2019                                      2020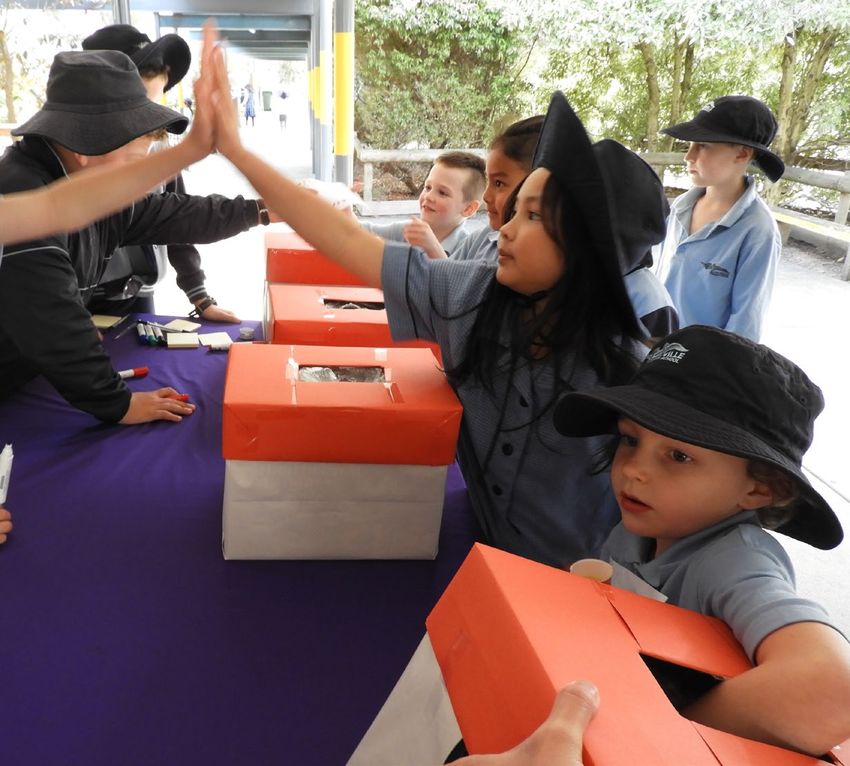
Canteen refurbishment:
  • Pie warmer purchased to replace loaned pie warmer that freed the school from
    being contractually bound to advertise ‘red’ food items
  • Stove top and rangehood to meet Council regulations, now accommodating
    cooking of fresh food.
  • Stainless steel benchtops and food processor to further accommodate food
    processing safely and easily.
  • Stick blender and stock pots to allow for large quantities of soup to be cooked.
  • Repainted blank walls ready for healthy food images and advertising.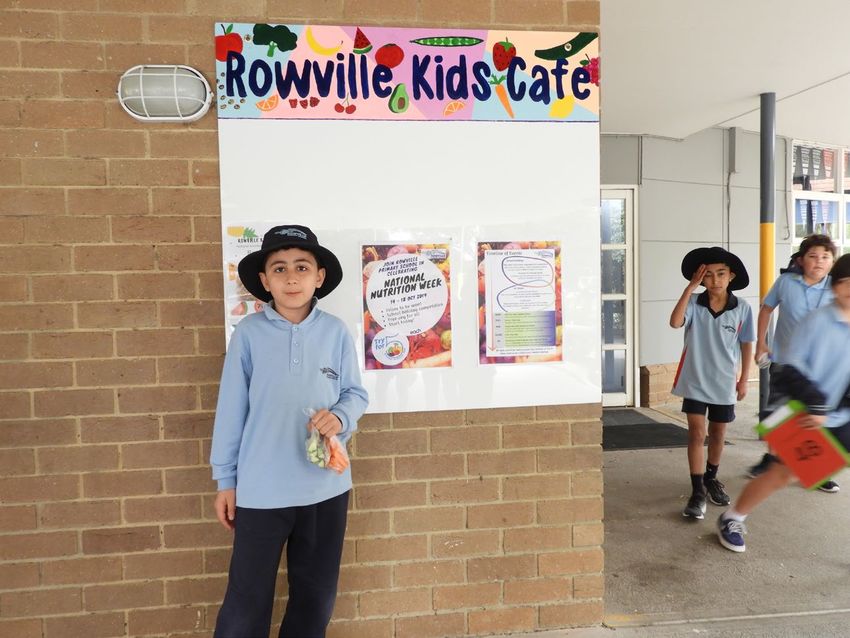
The majority of food available at school
is classified as AMBER (select carefully foods).
     This remains unchanged since
               baseline.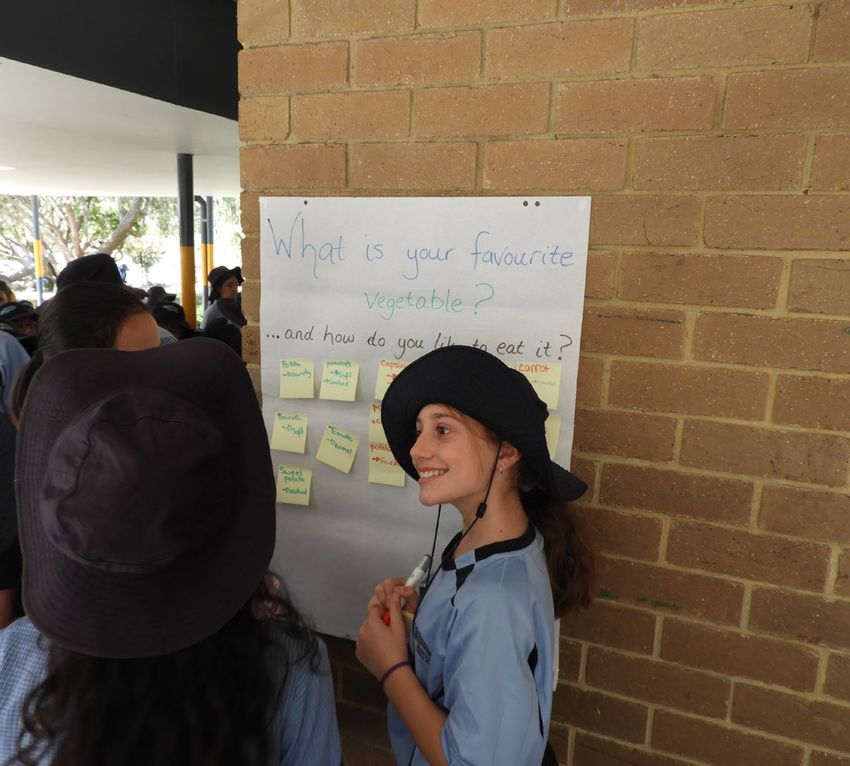
Food available from the canteen Summer 2019           Food available from the canteen Summer 2020
                 1%                                                 1%

           11%                                Green
                                              items
                                              Amber
                                                                11%
                           36%                items
                                                                              38%
                                              Red
                                              items
                                              Black
           52%                                items          50%

             Working toward HEAS guidelines; at least 50% green, less than
                     50% amber, limit red items, no black items.
GREEN food availability increased
slightly (2%) at the expense of AMBER
food.
Percentage of RED and BLACK items
remains unchanged since baseline.Total weekly sales - Summer 2019 Total weekly sales - Summer 2020
3% 1% 1%
5%
12% Total Green
items 17%
Total
Amber
items
Total Red
items
Total Black
items
84% 76%
• Snacks sales are nearly all amber (80-90% daily) 2019, dropping slightly
in 2020
• Lunch orders increase daily sales of red items.Total Lunch and Snack Sales - Summer 2019 Total Lunch and Snack Sales - Summer 2020
ITEMS AVAILABLE ITEMS AVAILABLE
FRI FRI
THURS THURS
WED WED
TUES TUES
MON MON
0 10 20 30 40 50 60 70 80 90 100 0 10 20 30 40 50 60 70 80 90 100
% SALES EACH DAY % SALES EACH DAY
Green items Amber items Red items Black items Green items Amber items Red items Black items
• Lunch orders increase daily sales of red items.
• Slightly more green and red sales in 2020, with less amber sales.Total Snack Sales – Summer 2019 Total Snack Sales - Summer 2020
ITEMS AVAILABLE ITEMS AVAILABLE
FRI FRI
THURS THURS
WED WED
TUES TUES
MON MON
0 10 20 30 40 50 60 70 80 90 100 0 10 20 30 40 50 60 70 80 90 100
% SALES EACH DAY % SALES EACH DAY
Green items Amber items Red items Black items Green items Amber items Red items Black items
• Snacks sales are nearly all amber on most days (80-90% daily),
dropping slightly in 2020 (70-80%)
• A record 30% green snack sales were recorded on Monday 2020.The majority of food consumed at
school (lunch box and from canteen)
remains classified as AMBER.
GREEN snacks sales increased during
2020.• During the first week that carrot and
cucumber sticks were displayed front and
centre with cartoon character price point
(winter 2019), sales increased compared
to summer data 2019.
• Carrot and cucumber sticks sold out on
4 of the 5 days during data collection
winter 2019.Total Lunch Sales - Summer 2019 Total Lunch Sales - Summer 2020
ITEMS AVAILABLE ITEMS AVAILABLE
FRI FRI
THURS THURS
WED WED
TUES TUES
MON MON
0 10 20 30 40 50 60 70 80 90 100 0 10 20 30 40 50 60 70 80 90 100
% SALES EACH DAY % SALES EACH DAY
Green items Amber items Red items Black items Green items Amber items Red items Black items
• Red sales outnumber green sales on most days.
• Tuesday (sushi day) is the exception for both years.• Red sales Total Lunch Sales – Summer 2019
dropped from
50% to 20%
ITEMS AVAILABLE
FRI
• Green sales
rose from 8% to THURS
35%
WED
• Total sushi sold
= 35 units TUES
MON
0 10 20 30 40 50 60 70 80 90 100
% SALES EACH DAY
Green items Amber items Red items Black itemsThe majority (70-75%) of students
purchase from the canteen at some
point during term.
In 2019, around 30% of students
purchased snacks from the canteen
during the week*.In the previous week…..
• 40% gr 3 & 4 students purchased a snack from the canteen, whilst 49%
of parents indicated their child purchased a snack from the canteen.
• Most common frequency of purchase from families (35%) was on one day
• Most common frequency of purchase from gr 3 & 4 students (35%) was on one-
two days
• 41% gr 3 & 4 students purchased a lunch order from the canteen, whilst
45% of parents indicated their child purchased a lunch order from the
canteen.
• Most common frequency of purchase for families (37%) and gr 3 & 4 students
(30%) was on one day. This did not change in 2020.Temperature °C
Temperature vs Sales Summer 2019
40
30
20
10 515
500
0
1 2 3 4 5
410
• 16-30% of students
made a purchase on
309 308
any given day 2019.
• Students purchased
2–3 items each visit 190
209
2019 and 2-4 items 149 157
2020. 99
32 27 34 37
24
MON TUES WED THURS FRI
Temperature °C Number of snack items sold Number of students purchasingHow many days did you buy a snack from the canten last week?
80%
2019 2020
70%
60%
50%
40%
30%
20%
10%
0%
Every day Four days Three days Two days One day I didn’t buy any
snacks from the
canteen last week
• Slight decrease in number of students purchasing snacks from the
canteenFamilies purchase from the canteen
mostly as an occasional indulgence /
reward but indicated they may increase
purchasing habits if there were more
GREEN items available.Most parents (74%) restrict how often
they purchase from the canteen,
mainly for health and/or financial
reasons…..but mostly students have
the freedom to make their own decision
on what to purchase.When did you decide what snack to buy from the canteen?
60%
2019
50%
2020
40%
30%
20%
10%
0%
I decided what I was I decided what I was I decided what I was I never buy snacks Other (please explain
going to buy the week going to buy in the going to buy when I from the canteen further)
or day before I went morning before I went was lining up at the
to the canteen to the canteen canteen
• Majority students making food purchasing decision at point of
sale.The top results as to what influenced
student food purchase decision was
‘whatever they felt like on the day’
closely followed by the weather.
The canteen line is a place to potentially
influence purchase decisions for over half
the students.
“I get it (food purchase)
when it smells good.”Parents who rated the canteen menu….
Mainly because of limited healthy options and a
processed, sugary menu. The next highest reason
1-2 was because it was too expensive / not value for
money. Most (62%) would purchase more often if
more ‘green’ items on the menu.
Were overall satisfied with the menu but most
common improvement said it needs to be cheaper. A
4-5 quarter would purchase more often if more ‘green’
items on the menu.Notable comments from parent survey
MENU:
• More sushi
• Have more vegetarian and gluten free options
• Have soy drink alternative
• Traffic light system does not appear on Qkr!
• Having hot choc / coffee available to parents at drop off/pick up as investment
• Include more wraps, toasted sandwiches and focaccias on the menu
• Focus on reducing packaging – help to teach kids to look after environment
• Seasonal, sustainable and more home-made would make me buy more
• Include healthy options from other cultures / cuisines
FINANCIAL:
• Increase the price on amber and red items
• Lunch option meals @ $7 make it unaffordable to do regularly
• Have weekly specials
• Canteen is more expensive than buying from ColesStudent Nutrition Survey
• Dietary recommendation knowledge
• Dietary intake 24hr recall
• Influence on canteen purchasing decisions
• Involvement of lunchbox food selection and home
cookingHow many serves of vegetables should children eat every day, as
recommended by the Australian Dietary Guidelines?
40%
35% 2019
30% 2020
25%
20%
15%
10%
5%
0%
One serves Two serves Three serves Four serves Five serves Six serves I don't know
• Slight increase in knowledge of correct number of servesHow many serves of fruit should children eat every day, as recommended
by the Australian Dietary Guidelines?
35%
30% 2019
25% 2020
20%
15%
10%
5%
0%
One serves Two serves Three serves Four serves Five serves Six serves I don't know
• Same level of increase in serves of fruit as we saw in vegetables.How many serves of vegetables did you eat yesterday?
30%
2019
25%
2020
20%
15%
10%
5%
0%
Less than one One serve Two serves Three serves Four serves Five serves Six or more I did not eat
serve serves any
vegetables
yesterday
• Very slight increase in students eating vegetables and fruit.How many serves of vegetables did you eat while at school yesterday?
50% 2019
45%
2020
40%
35%
30%
25%
20%
15%
10%
5%
0%
Less than One serve Two serves Three serves Four serves Five serves Six or more I did not eat I was not at
one serve serves any school
vegetables yesterday
at school
yesterday
• Slight increase in students eating vegetables and fruit at school.Nutrition Week 2019 • 12 interactive activities conducted across all year levels • 90% class teachers actively engaged • At least 415 students actively engaged • Student-led activities • 2 canteen ‘green food’ specials trialled • Staff surveyed post nutrition week
6 Student
   Parliamentarian
  Leaders actively
involved and leading
      activities
Teacher Resource Pack • Try for 5 class poster • Reward sheets and stamp • Serving size examples • Class veg graph • List of activities and timelines
”Students were very enthusiastic and we witnessed a big increased
                   in the amount of healthier food options that students were bringing
                    to school. It was a wonderful week and some students have since
                                    continued to eat healthier options.”

 The kids were extremely engaged with the week focus on
nutrition. It was great to centre our learning and classroom
                   discussions to the topic.
From your observations, which National Nutrition Week activities do you think motivated students to increase their vegetable consumption?
Lunchbox Power Boost
   Class Challenge
Would you consider using this graph activity in your classroom annually, even if it was not
                    attached to National Nutrition Week activities?
Compared to student vegetable consumption prior to National Nutrition Week, how much do you
think vegetable consumption increased among students in your class?Did your eating habits or mindset toward food change in any way as a result of
Nutrition Week?“I ensured I was eating vegetables at healthy snack time
to model good eating behaviours. I normally wouldn't
eat anything during this time and eat my vegetable
sticks at recess.”
“Discussing good food choices daily
to motivate students and sharing
with them what my children were
having at home.”If you altered your planned lessons or normal class routines in any way that
promoted fruit or vegetables, did you continue any of these changes beyond
National Nutrition Week?“Parents loved making food art with their children.”
“Parents have been saying that
students have been asking for more
fruit and veggies at home.”You can also read