NORWEP Global Offshore Wind Report 2021 & Norwegian industry expectations - In collaboration with: Research by
←
→
Page content transcription
If your browser does not render page correctly, please read the page content below
NORWEP
                       In collaboration with:
Global Offshore Wind
     Report 2021
          &
 Nor wegian industry
    expectations
                           Research by:
Agenda

•   Welcome - Jon Dugstad, Director Wind and Solar, Norwegian Energy
    Partners
•   Launch of NORWEP's Global Annual Offshore Wind Market Report with
    new targets for the industry - Jon Dugstad, Director Wind and Solar,
    Norwegian Energy Partners
•   Key figures, opportunities and challenges in key global offshore wind
    markets – Ronnie Quinn, Advisor Renewable Markets UK and Ireland,
    Norwegian Energy Partners
•   Tony Christian Tiller, State Secretary, Ministry of Petroleum and Energy
•   Norwegian industrial growth opportunities in the European offshore
    wind industry - Giles Dickson, Chief Executive Officer, WindEurope
•   Discussion: How should the Norwegian supply industry engage in these
    exciting opportunities? How can NORWEP and the wider Norwegian
    support community help the Norwegian industry to become a leading
    offshore wind contender on a global scale?
Norwegian Energy Partners                                               Founders

                                                                        Organisations
                                                                        - Energy Norway
                                                                        - Federation of Norwegian Industries
                                                                        - Norwegian Oil and Gas Association
is an independent non-profit foundation established to strengthen the
                                                                        - Norwegian Shipowners’ Association
long-term basis for value creation and employment in the Norwegian
                                                                        - The Norwegian Confederation of
energy industry through facilitation of the industry’s international
                                                                          Trade Unions
business activities.
                                                                        Norwegian Government
                                                                        - Ministry of Petroleum and Energy
We have 300 partners/company members from the Norwegian                 - Ministry of Trade and Industry
offshore, energy and maritime industries!                               - Ministry of Foreign Affairs

                                                                        Industry
                                                                        - Equinor
                                                                        - Statkraft

                                                                                                               | 3
NORWEP - what we do

                      Provide market and project information to
                      NORWEP partners and Norwegian industry at
                      large

                      Identify Norwegian competence and technology
                      that fit the needs of the global energy industry

                      Create relevant dialogues between the
                      Norwegian industry and international partners
                      and clients
Equinor Peregrino B
Ole Jørgen Bratland
Market Report and Offshore Wind Tool
Capacity of announced projects almost doubled in
2020
                                                                                                                 #     Country                      Operational   Secured   Development*   Total
                                                                                                                 1     Vietnam                              99     783         64,919      65,801

                                                                                                                 2     China                            8,524     24,824       30,237      63,586

                                                                                                                 3     United Kingdom                  10,424      9,927       28,978      49,329

                                                                                                                 4     Brazil                                                  42,537      42,537
                                                                                                                 5     Taiwan                               128    5,167       36,229      41,524

                                                                                                                 6     USA                                  42    11,586       27,538      39,166

                                                                                                                 7     Sweden                               191                36,766      36,957

                                                                                                                 8     Japan                                61     146         36,162      36,369

                                                                                                                 9     Germany                          7,653      3,125       10,552      21,330

                                                                                                                 10    South Korea                          95      95         21,121      21,311

                                                                                                                 11    Ireland                              25                 21,023      21,048

                                                                                                                 12    Poland                                      5,933       12,804      18,737

                                                                                                                 13    Australia                                               15,887      15,887

                                                                                                                       The
                                                                                                                 14                                     2,620      2,682       6,100       11,402
                                                                                                                       Netherlands

 33.9 GW            68.9 GW          430.4 GW           533.2 GW                                                 15    Denmark                          1,701      949         7,768       10,418

 Operational          Secured        In development*            Total                                            16    France                               2      3,513       3,384       6,899
No change from Q1   ▲ 6.6% from Q1    ▲ 7.7% from Q1     ▲ 7.0% from Q1

                                                       *includes capacity without owners that is scheduled for
                                                       auction

                                                                                                                 Ranking based on total size of portfolio

                                                                                                                                                                                                    6
Utility scale floating wind emerge
                                                                                 Taiwan                                                                       17.2
                                                                                 Ireland                                          8.4
                                                                                Sweden                                       7.8
                                                                                Australia                                   7.4
                                                                             South Korea                                7.2
                                                                                                                                             Key markets
                                                                                    USA                         4.9
                                                                                    Italy                 3.7
                                                                                   Other                                                        13.3

                                                                                             0              5                      10               15               20
                                                                                                                         GW
                                                                                            Operational    Route to market secured              Development*

                                                                                     InfraVest                        7.4
                                                                              Oceanex Energy                          7.4
                                                                                              CIP                 5.8
                                                                                     Aker ASA                  4.4
                                                                                      Hexicon               4.0
                                                                                                                                    Key developers
 0.07 GW             0.15 GW             69.7 GW             70 GW                  Stonepeak             2.9
 Operational           Secured          In development*        Total                  Renexia             2.8
No change from Q1   No change from Q1    ▲ 34.4% from Q1   ▲ 34.2% from Q1
                                                                                            Other                                                             25.6

                                                                                                    0      5            10              15     20        25          30
                                                                                                                             GW
                                                                                            Operational    Route to market secured             Development**

                                                                                                                                                                          7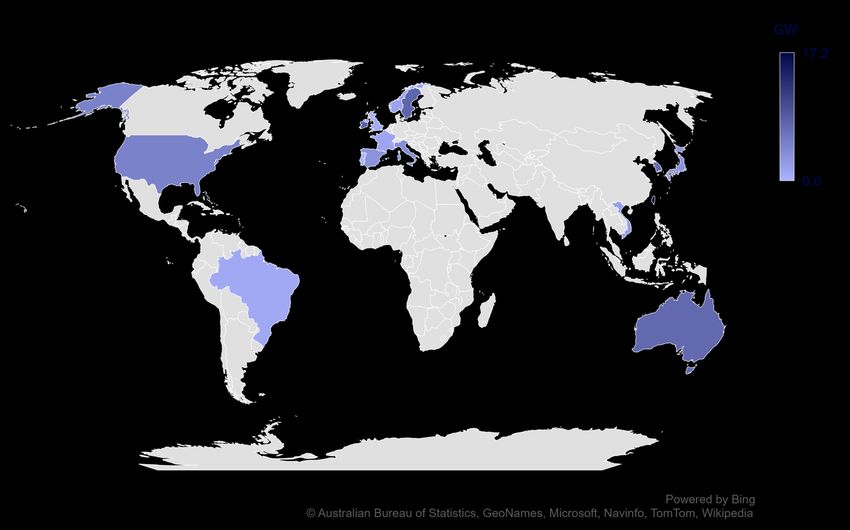
Upcoming lease auctions*
Netherlands – 2021 Norway – 2021
*Does not include projects established by developers with a
The Hollandse Kust West auction will take The Norwegian government is currently
view to be tendered to new owners at a later date.
place in Summer 2021, with further formulating a competitive process to allocate Denmark – 2021
auctions to follow sites in the UN and SN2 zones, with a view to The Danish government will offer a reverse auction CfD
offer projects by the end of 2021. tender for the Thor and Hesselø wind farms in 2021.
Ireland – 2021
Prequalified bidders for Thor were announced in February
Ireland has scheduled an offshore wind
’21.
specific RESS auction for 2021. There is
speculation over whether it will be
launched by the end of the year. Lithuania – 2023
The Lithuanian government is preparing to
tender a 700 MW project with a provisional
auction date of February 2023.
New York – 2021 / 22
In 2021 BOEM specified call areas for
lease in the New York Bight and
announced an auction would be
launched in late 2021 or early 2022. Germany – 2021
Three sites with a combined capacity of 958
California - 2022 MW will be tendered in September 2021
After multiple delays to an auction
originally planned for 2019, BOEM
announced in 2021 it would ramp up
activity to lease areas off California in
Japan - 2021
2022.
Japan is expected to announce the
winners of ongoing tenders for both
North Carolina - 2022 fixed and floating areas in 2021 and
BOEM announced in 2021 that it would 2022. Further auctions are also
seek to launch a lease auction for WEAs planned.
offshore North Carolina in 2022, prior to
the implementation off a moratorium on
new leasing off the coast of the state from
Taiwan – 2022
2023.
The draft zonal development plan
for offshore wind in Taiwan
Confirmed lease France – 2021 / 2022 outlines auctions for 3 GW of
auctions Competitive lease auctions are currently capacity each year from 2022 to
underway at various stages for the 1 GW Belgium – 2023 India - 2022 2024.
Speculated lease Normandy fixed foundation project and The Belgian government has identified 1 GW lease had been
auctions the 270 MW Brittany I floating site. Both a second Marine Development Area for scheduled for 2019 but has
auctions will be completed in 2022. offshore wind leasing and is expected been delayed to 2022 awaiting
to auction three sites in the area in site inspections from LiDAR
2023. devices
8 8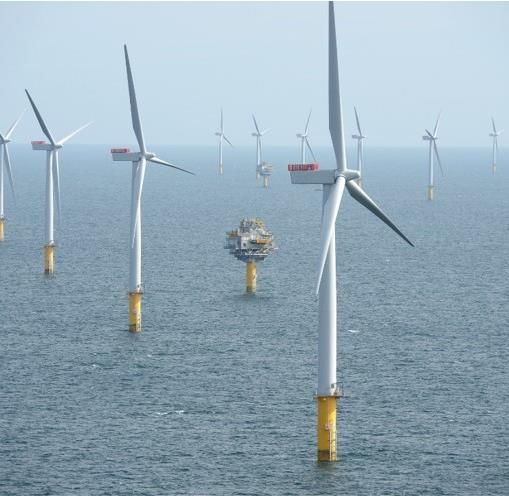
10
11
Key developers                                                                • As early movers in the
                                                                                offshore wind sector,
                                                                                European utilities lead the
                                                                                global portfolio ranking.
   Iberdrola         29.2
     Ørsted          28.7                                                     • Increased competition from
                                                                                oil majors and regional
Ocean Winds         20.8
                                                                                developers.
        CIP         19.4
      RWE          14.0                                                       • EPCI and institutional
       wpd         12.8                                                         investors are investing in early
    Equinor        12.3
                                                                                stage projects in line with
                                                                                inherent developers.
      Other                                                           317.9

               0      50      100     150      200    250    300       350    • Alliances are evolving – across
                                           GW                                   the world.
           Operational      Route to market secured   Development**

                                                                                                                   12
Technologies
• Fixed-foundation project development
33.9 continues to be the industry focus.
Fixed 68.7
• The first tenders to allocate a route to
360.7 market for utility-scale floating
foundation projects are due to take
0.1 place from 2021.
Floating 0.2
• Consistent deployment of floating-
69.7 foundation projects from 2025 is
expected to encourage further
0 50 100 150 200 250 300 350 400
development.
GW
Operational Route to market secured Development*Projects and turbines are getting bigger
Average project size by region and year Average wind turbine generator size by year
1.6 20 300
1.4 18
250
1.3 16
1.2
14
200
1.0 1.0
0.9 12
metres
0.9
MW
GW
0.8 0.8 0.8
0.8 10 18.5
150
17.0
0.6 0.6 8 14.5
15.4 16.0
0.5 0.5 0.5 100
0.4
0.5 0.5 6 11.6 11.6
0.4 0.4 0.4 0.4 0.4 0.4 9.5
0.3 0.3 4 7.7 7.8 7.7
0.3 0.3 0.3 6.2
7.4
50
0.2 0.2 0.2 5.5
0.2 0.2 0.2
2 4.1 4.3 4.1 4.3
0.1 0.1 3.0 3.2 3.1
0.1
0.0 0 0
Operational year Operational year
EMEA APAC (excl. China) Americas Avg. WTG rating (MW) Avg. rotor diameter (m) Avg. hub height (m)Boom!
• Capacity commissioned to close in on
230 GW i 2030
• A consistent stream of tenders and
capacity auctions will ensure more
35 250 projects secure a route to market
30.7 29.8 through to 2030 in the EMEA
30
200 • APAC commissioning expected to grow
23.9
25
Cumulative GW
22.2
GW per annum
rapidly with identified routes-to-
19.4 19.1 markets
20 150
15.0
15
13.7 • China project commissioning at
11.1 100 unprecedented rates as central support
8.5 8.1
10 6.1
is due to expire in 2022
3.5 4.2 50
5 1.5
• In the Americas a strong route to
market pipeline has been secured by
0 0 state-level authorities in the US
• Ambitious government targets will be
Year missed due to supply chain constraints
Cumulative EMEA China APAC (excl. China) Americas and administrative delays
15O ve ra l l ex p e n d i t u re i s s et t o r i s e
• An average global annual market
of 50 bn EUR in the early 2020s
will be worth 80-90 bn EUR
100 90.7 900
86.2 86.3 annually towards 2030.
90 800
75.8
80 72.8 700 • TotEx is forecast to fall in China
Cumulative EURbn
EURbn per annum
67.1
70 600 based on the current project
60 53.7
51.2
47.0 49.8 47.9 500 pipeline. The expected increase in
50 41.6 new development activity
400
40 following adjustment to updated
28.4
300
30 19.1 21.4 route to market mechanisms from
20 200 2022 is however likely to increase
10 100 expenditure in line with trends in
0 0 other regions.
• Supply chain bottlenecks and
Year
localisation requirements may
Cumulative China United Kingdom USA Germany Taiwan Japan Vietnam Other limit cost reductions.Europe maintains its pole position
Top 16 (Q2 2021)
# Country Operational Secured Development* Total
1 United Kingdom 10,424 9,927 28,978 49,329
2 Sweden 191 36,766 36,957
3 Germany 7,653 3,125 10,552 21,330
4 Ireland 25 21,023 21,048
5 Poland 5,933 12,804 18,737
6 The Netherlands 2,620 2,682 6,100 11,402
7 Denmark 1,701 949 7,768 10,418
8 France 2 3,513 3,384 6,899
9 Estonia 6,264 6,264
10 Italy 30 5,097 5,127
11 Norway 2 92 4,519 4,613
12 Belgium 2,261 2,040 4,301
13 Spain 5 2 3,197 3,204
14 Finland 68 740 808
15 Greece 714 714
25.0 GW 26.3 GW 151.4 GW 202.6 GW
Operational Secured In development* Total 16 Lithuania 700 700
No change from Q1 ▲ 6.6% from Q1 ▲ 8.0% from Q1 ▲ 6.7% from Q1
Ranking based on total size of portfolio
*includes capacity without owners that is scheduled for auction
17A short journey from Nor way
North Sea 80.4
Baltic Sea 52.2
Irish Sea 18.7
Gulf of Bothnia 10.6
Atlantic Ocean 9.8
Kattegat 9.3
Celtic Sea 5.7
Other 15.9
0 10 20 30 40 50 60 70 80 90
GW
Operational Route to market secured Development*
18Americas
• US market remained focused on
offtake solicitations and
permitting for late-stage
development projects.
• Brazilian early stage
development portfolio expanded
rapidly in 2020.
0.04 GW 11.6 GW 70.7 GW 82.3 GW • First offshore wind farm in
Operational Secured In development* Total Colombia was unveiled.
No change from Q1 ▲ 29.8% from Q1 ▲ 6.5% from Q1 ▲ 9.3% from Q1
*includes capacity without owners that is scheduled for auction
19# Country Operational Secured Development* Total
APAC ex. China 1
2
Vietnam
Taiwan
99
128
783
5,167
64,919
36,229
65,801
41,524
3 Japan 61 146 36,162 36,369
4 South Korea 95 95 21,121 21,311
5 Australia 15,887 15,887
6 Philippines 2,450 2,450
7 India 1,400 1,400
0.38 GW 6.2 GW 178.2 GW 184.7 GW
Operational Secured In development* Total
No change from Q1 No change from Q1 ▲ 9.3% from Q1 ▲ 9.0% from Q1
• *includes capacity without owners that is scheduled for auction or where owner
info is absent
20The Chinese dragon
# Country Operational Secured Development Total
1 Guangdong 1,022 9,934 21,333 32,289
2 Jiangsu 5,777 6,771 1,901 14,449
3 Fujian 129 3,619 1,855 5,603
4 Zhejiang 486 2,389 900 3,775
5 Shandong 1,205 1,803 3,007
6 Liaoning 303 400 1,199 1,902
7 Hebei 300 300 497 1,097
8 Shanghai 417 206 200 823
9 Tianjin 90 350 440
10 Hong Kong 200 200
8.52 GW 24.8 GW 30.2 GW 63.6 GW
Operational Secured In development Total
No change from Q1 No change from Q1 No change from Q1 No change from Q1
21An emerging Nor wegian offshore wind industr y Source: Multiconsult: Statusrapport Norges energinæringer (2020)
An annual 80-100 bn NOK worth of Nor wegian
offshore wind solutions

     90 000                                                                                                               14.0 %

     80 000
                                                                                                                          12.0 %

     70 000
                                                                                                                          10.0 %
     60 000

     50 000                                                                                                               8.0 %

     40 000                                                                                                               6.0 %

     30 000
                                                                                                                          4.0 %
     20 000

                                                                                                                          2.0 %
     10 000

         -                                                                                                                0.0 %
              2019   2020    2021      2022      2023       2024   2025     2026      2027      2028      2029     2030

                            Annual international turnover                 Norwegian supply industry market share

    ..with a 10% market share and more than 500 bn NOK deliveries in the period to 2030.                                           23
What does it take?
• A number of large Norwegian suppliers engage successfully in offshore wind globally
• Norwegian based companies
• develop market and industry acumen and risk understanding
• increase offshore wind ambitions and deploy the necessary resources
• develop volume manufacturing skills
• establish scale in international markets in competition with established global supply chain
• Norwegian developers are active on the Norwegian and international shelf
• Norwegian developers and international partners on the NS adopts more Norwegian
solutions in projects globally
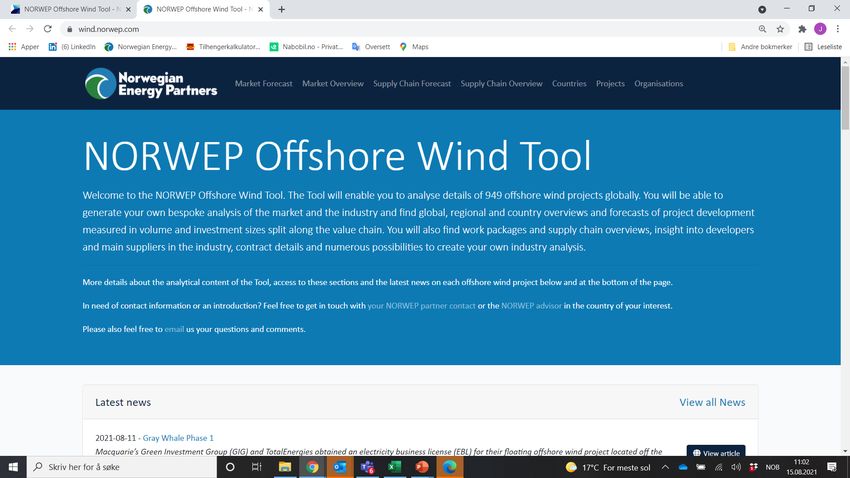
24Would you like to know more? www.norwep.com/wind
You can also read