Q1 2021 TORONTO MARKET REPORTS - LEE-ASSOCIATES.COM/RESEARCH - Lee & Associates Toronto
←
→
Page content transcription
If your browser does not render page correctly, please read the page content below

Q12021
          Q1 2021   MARKET
                 TORONTO    REPORTS
                         MARKET REPORTS

LEE-ASSOCIATES.COM/RESEARCH
Q1 2021
TORONTO, ON
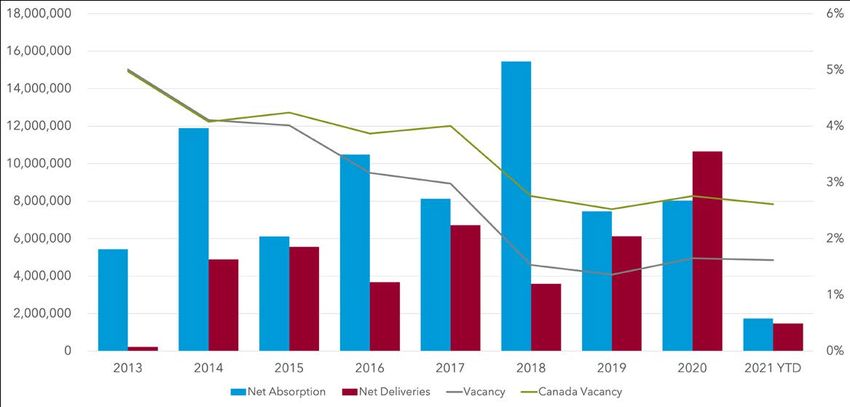
INDUSTRIAL MARKET OVERVIEW
DANIEL SMITH, Vice President, Principal
Despite a slowdown in transaction volumes, industrial real estate remains well
positioned across the GTA, particularly as ecommerce related uses continue to
grow. Toronto’s location, large population base, and strong demographic growth
have produced one of North America’s tightest industrial markets. With the market’s
strength and positive outlook, net rents increased by 18.9% year-over-year, matching
the growth rate of 20.6% from the year prior. Of note, Amazon doubled its GTA
footprint this year securing approximately 3.3M SF across 12 facilities including its
brand new 1M SF fulfillment centre in Scarborough. Looking ahead, the GTA industrial
market still seems poised for continued rental growth during this time of uncertainty.
MARKET INDICATORS Q1 2021 Q4 2020 Q3 2020 Q2 2020 Q1 2020
▲ Net Absorption SF 8,267,934 8,033,767 9,411,749 10,416,684 6,273,921
▼ Vacancy Rate 1.60% 1.70% 1.30% 1.30% 1.40%
▲ Avg NNN Asking Rate $10.25 PSF $10.08 PSF $9.95 PSF $9.62 PSF $9.36 PSF
▼ SF Under Construction 10,539,196 10,858,919 12,096,614 11,538,204 14,646,970
▲ Inventory SF 845,313,955 843,867,314 840,006,704 837,501,036 834,581,155
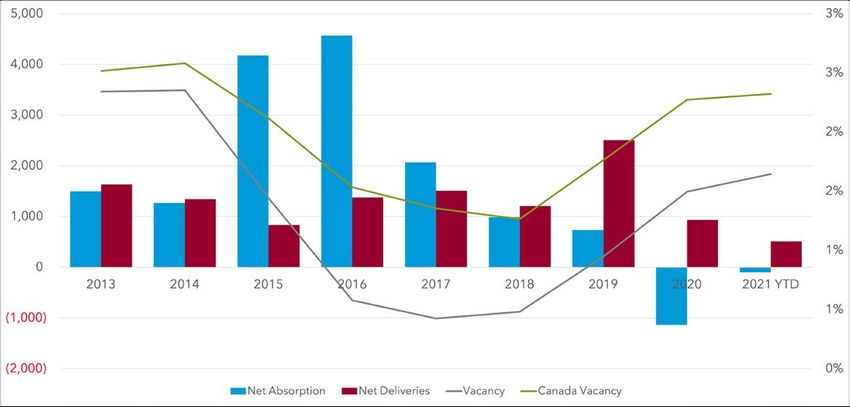
NET ABSORPTION, NET DELIVERIES, & VACANCY UNDER CONSTRUCTION
TOP SALE TRANSACTIONS BY SF SIZE SALE PRICE BUYER / SELLER BUILDING CLASS
250 Summerlea Road $78,201,062 Tricor Pacific Founders Capitals
346,686 SF Class C
Brampton, ON $225.57 PSF Confederation Freezers
100-110 Iron Street $125,285,000 Triovest
325,157 SF Class C
Toronto, ON $385.31 PSF Mantella Corporation
240 Nugget Court $38,422,047 Tricor Pacific Founders Capitals
286,136 SF Class C
Brampton, ON $134.28 PSF Confederation Freezers
TOP LEASE TRANSACTIONS BY SF SIZE LANDLORD TENANT TENANT INDUSTRY
8480 Mount Pleasant Way Sun Life Assurance
592,636 SF Uline Warehousing
Milton, ON Company of Canada
7330 Mississauga Road
216,412 SF Orlando Corp Alliance Labelling Packaging
Mississauga, ON
1652 Tricont Avenue Skyline Commercial
185,000 SF Lear Corporation Manufacturing
Whitby, ON Real Estate Holdings
LEE & ASSOCIATES RESEARCH LOCAL EXPERTISE. INTERNATIONAL REACH. WORLD CLASS.
Q1 2021
TORONTO, ON
MULTIFAMILY MARKET OVERVIEW
LUIS ALMEIDA, Senior Vice President, Partner
The 2020 multifamily market was in position to have another benchmark year. Stable
market fundamentals supported a strong appetite amongst institutional investors,
and liquidity remained strong across the GTA. As the COVID-19 pandemic tapers
off, we anticipate the reopening of the economy to be a gradual process. The
GTA multifamily sector should be in position to have one of the quickest and
strongest recoveries in the market. Investors and operators will have access to low
borrowing costs as interest rates are expected to remain low for the foreseeable
future. Multifamily properties will remain one of the most resilient and financeable
asset types in the market and should continue the success of recent years.
MARKET INDICATORS Q1 2021 Q4 2020 Q3 2020 Q2 2020 Q1 2020
▼ Absorption Units 12 Mo. (1,246) (1,137) (553) (39) 499
▲ Vacancy Rate 1.7% 1.5% 1.3% 1.2% 1.0%
▲ Asking Rent/Unit $1,754.00 $1,750.00 $1,746.00 $1,740.00 $1,725.00
▲ Inventory Units 377,588 377,078 376,443 376,229 376,216
▼ Units Under Construction 14,665 14,814 15,449 15,695 14,679
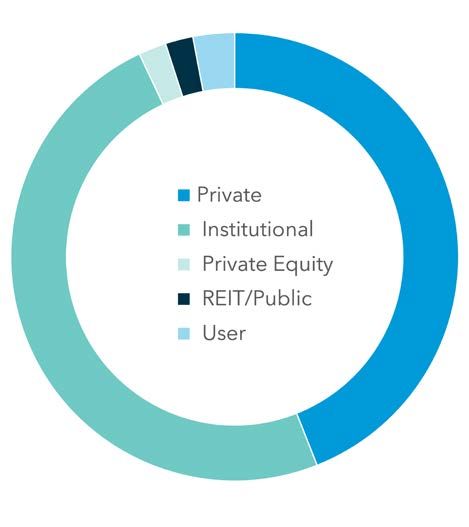
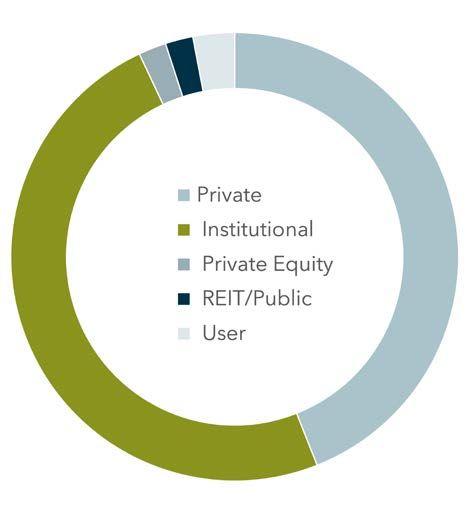
NET ABSORPTION, NET DELIVERIES, & VACANCY SALE BY BUYER TYPE SALE BY SELLER TYPE
**’Sale by Buyer’ and ‘Sale by Seller’ Data is comprised of data from the previous 12 months.
TOP SALE TRANSACTIONS BY SF SALE PRICE NUMBER OF UNITS BUYER / SELLER
15 Roehampton Avenue Woodbourne Canada Management Inc.
$143,572,745 616,192
Toronto, ON RioCan Real Estate Investment Trust
20 Tuxedo Court Conundrum Capital Corp
$60,743,240 289,254
Toronto, ON Reserve Properties
550 Jarvis Streeet Park Property Management
$92,600,000 353,453
Toronto, ON DMS - 400 Dufferin
TOP SELLERS (PAST 12 MONTHS) SALES VOLUME TOP BUYERS (PAST 12 MONTHS) SALES VOLUME
Signet Group Inc. $193,749,999 Starlight Investments Ltd. $312,881,670
Flagship Property Ventures Corp. $143,647,000 Timbercreek Asset Management Inc. $246,515,329
RioCan Real Estate Investment Trust $143,572,745 Park Property Management Inc. $193,500,000
Tridel Group of Companies $135,000,000 Woodbourne Capital Mgmt Intn’l, LP $143,572,745
Runnymede Development Corp Ltd $87,750,000 Conundrum Capital Corporation $124,823,240
LEE & ASSOCIATES RESEARCH LOCAL EXPERTISE. INTERNATIONAL REACH. WORLD CLASS.
Q1 2021
                                                                                                   TORONTO, ON
                                                          OFFICE MARKET OVERVIEW
                                                          WILL GEHRING, Senior Vice President

                                                          The pandemic has taken its toll on the office leasing market. Reports have shown
                                                          leasing volume throughout the GTA has declined by 54% from this time one year
                                                          ago. The current amount of sublet space in the GTA is approximately 6,000,000
                                                          SF, of which half is located in downtown Toronto. As we move into Q2 2021,
                                                          tenants from most business sectors continue to have a “wait and see” mindset,
                                                          hoping that once the vaccination of employees is fully complete, they will feel
                                                          safe to return to work. The future workplace environment remains unknown. For
                                                          now, the majority of employees continue to work from home and doing their best
                                                          to be productive.

MARKET INDICATORS             Q1 2021              Q4 2020                  Q3 2020                Q2 2020               Q1 2020
▼    Net Absorption SF        (2,526,172)          (911,835)                1,867,830              1,591,349             1,857,636

▲    Vacancy Rate               6.10%               5.60%                    4.80%                   4.50%                 4.30%

◀ ► Avg NNN Asking Rate       $19.78 PSF          $19.78 PSF               $19.64 PSF              $19.55 PSF           $19.60 PSF
▲    SF Under Construction    12,223,816          12,190,304               13,033,494             113,248,581           12,613,382

▲    Inventory SF            277,618,141          277,471,169              277,284,934            275,643,469           275,205,681

          NET ABSORPTION, NET DELIVERIES, & VACANCY                                          UNDER CONSTRUCTION

TOP SALE TRANSACTIONS BY SF             SIZE           SALE PRICE                        BUYER / SELLER             BUILDING CLASS
105 Commerce Valley Drive                              $58,075,000               Soneil Group of Companies
                                     188,865 SF                                                                           Class A
Markham, ON                                            $307.49 PSF               Northam Realty Advisors Ltd

55 Commerce Valley Drive                               $56,925,000               Soneil Group of Companies
                                     186,390 SF                                                                           Class B
Markham, ON                                            $305.41 PSF               Northam Realty Advisors Ltd

110 Yonge Street                                       $58,000,000                          Sutter Hill
                                      16,837 SF                                                                           Class B
Toronto, ON                                            $721.23 PSF                       BentallGreenOak

TOP LEASE TRANSACTIONS BY SF            SIZE           LANDLORD                             TENANT                 TENANT INDUSTRY
40 King Street West
                                     922,360 SF    ARI SP NOMINEE INC.                     Scotiabank                    Finance
Toronto, ON

2360 Cornwall Road                                    C2C Industriaal
                                      53,150 SF                                            Undisclosed                 Undisclosed
Oakville, ON                                        Properties (GTA) Ltd

8 Spadina Avenue                                   Quadrange Architects
                                      33,218 SF                                            Undisclosed                 Undisclosed
Toronto, ON                                               Ltd.

LEE & ASSOCIATES RESEARCH                                                     LOCAL EXPERTISE. INTERNATIONAL REACH. WORLD CLASS.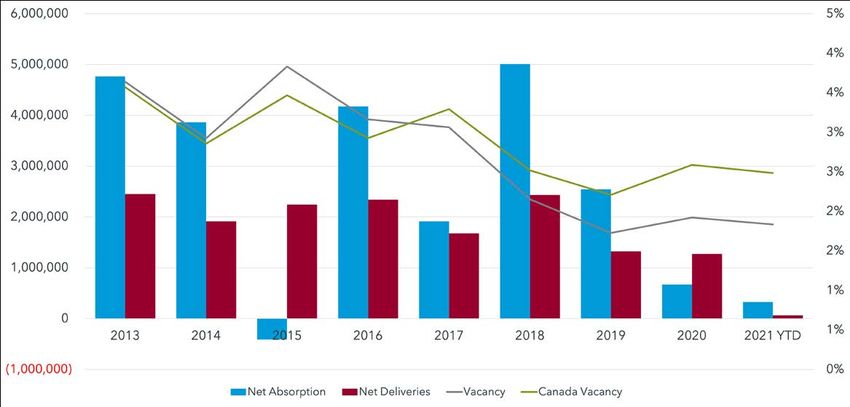
Q1 2021
                                                                                                      TORONTO, ON
                                                         RETAIL MARKET OVERVIEW
                                                         NICOLE MONIZ, Vice President, Corporate Real Estate

                                                         The pandemic continues to create challenges to Toronto retailers, restaurants, and
                                                         landlords. Data has revealed e-commerce retail sales rose by 71% in 2020, accelerating
                                                         the shift from brick-and-mortar stores to e-commerce, benefitting industrial sector with
                                                         increasing demand for warehousing and distribution. Enclosed malls and street-front
                                                         retail continue to suffer but strip centres anchored by food retailers and essential
                                                         services are thriving. Quick service restaurants and electronics stores have performed
                                                         above average, whereas full-service restaurants and clothing stores have seen sales fall
                                                         sharply from 2019 levels. Restaurants, fitness centers, service- oriented retailers such as
                                                         hair salons, theatres, and amusement parks, are seeing the greatest negative impacts.

MARKET INDICATORS             Q1 2021             Q4 2020                  Q3 2020                    Q2 2020                    Q1 2020
▲    Net Absorption SF        1,107,524           671,535                   508,811                   1,380,732                  1,570,617

▼    Vacancy Rate              1.80%               1.90%                     1.90%                      1.90%                      1.90%

▲    Avg NNN Asking Rate      $26.89 PSF         $26.55 PSF               $26.28 PSF                 $26.84 PSF                 $26.73 PSF
▲    SF Under Construction    3,174,057           3,143,935                3,249,196                  2,174,702                  2,527,397

▲    Inventory SF            294,713,993         294,650,098             294,255,825                294,272,994                293,712,332

           NET ABSORPTION, NET DELIVERIES, & VACANCY                                          UNDER CONSTRUCTION

TOP SALE TRANSACTIONS BY SF               SIZE         SALE PRICE                       BUYER / SELLER                      TENANCY TYPE
382 Yonge Street                                       $100,000,000                          IKEA
                                    132,070 SF                                                                                Single-Tenant
Toronto, ON                                            $757.17 PSF                    Kingsett Capital, Inc.

50 Resources Road                                      $49,000,000                    Microsoft Canada
                                    119,083 SF                                                                                Single-Tenant
Toronto, ON                                            $411.48 PSF                 Lowe’s Company Canada

14700 Yonge Street                                     $12,000,000             SmartCenters RE Investment Trust
                                     63,353 SF                                                                                Single-Tenant
Toronto, ON                                            $189.41 PSF                     Canadian Tire

TOP LEASE TRANSACTIONS BY SF              SIZE         LANDLORD                              TENANT                       TENANT INDUSTRY
17215 Leslie Street
                                     22,989 SF      Tricap Properties                      Undisclosed                        Undisclosed
Newmarket, ON

1800 Sheppard Avenue East                          Ivanhoe Cambridge/
                                     19,502 SF                                          Urban Behaviour                          Clothing
Toronto, ON                                          Cadillac Fairview

130 North Queen Street
                                     15,445 SF           Amedev                            Undisclosed                        Undisclosed
Toronto, ON

LEE & ASSOCIATES RESEARCH                                                    LOCAL EXPERTISE. INTERNATIONAL REACH. WORLD CLASS.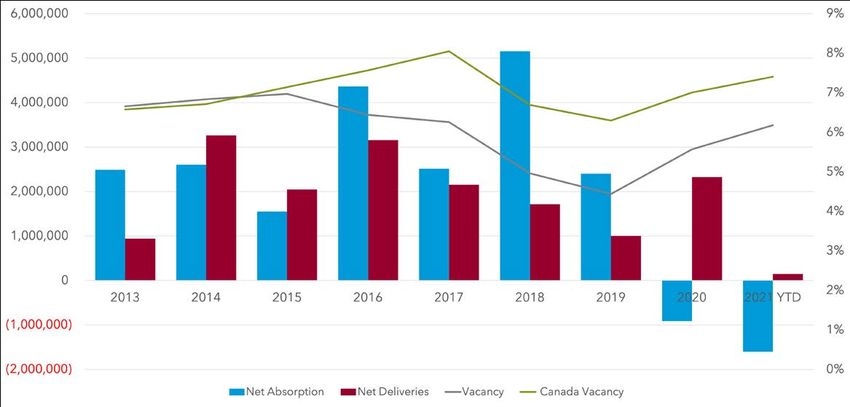
The information and details contained herein have been obtained from third-party sources believed to be reliable, however, Lee & Associates has not
independently verified its accuracy. Lee & Associates makes no representations, guarantees, or express or implied warranties of any kind regarding the
accuracy or completeness of the information and details provided herein, including but not limited to, the implied warranty of suitability and fitness for a
particular purpose. Interested parties should perform their own due diligence regarding the accuracy of the information.
The information provided herein, including any sale or lease terms, is being provided subject to errors, omissions, changes of price or conditions, prior
sale or lease, and withdrawal without notice. Third-party data sources: CoStar Group, Inc., The Economist, U.S. Bureau of Economic Analysis, U.S. Bureau
of Labor Statistics, Congressional Budget Office, European Central Bank, GlobeSt.com, CoStar Property, and Lee & Associates Proprietary Data. ©
© Copyright 2021 Lee & Associates all rights reserved. Third-party Image sources: sorbis/shutterstock.com, shutterstock.com, pixabay.com, istock.com
You can also read