INVESTORS PRESENTATION - August 2019 - Quickstep
←
→
Page content transcription
If your browser does not render page correctly, please read the page content below

INVESTORS PRESENTATION
August 2019

DISCLAIMER
This Presentation is provided by Quickstep Holdings Limited by applicable laws, none of them makes any representation and from the projections and such variations may be material. Quickstep
(“Quickstep” or the “Company”) as a summary of the Company and none of them gives any assurance, guarantee or warranty, express or has no obligation to tell recipients if it becomes aware of any
its operations and for general information purposes only. implied, as to, and none of them takes any responsibility or assumes inaccuracy in or omission from the information in this presentation.
liability (including in negligence) for the authenticity, validity, accuracy,
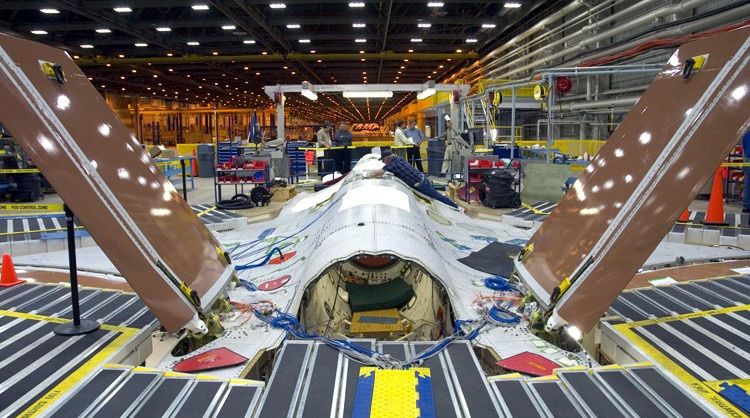
This presentation is not a disclosure document and should not be suitability or completeness of, or any errors in or omissions from, any Other than for the pictures of the Quickstep facilities and machinery,
considered as investment advice or an offer or invitation to subscribe information, statement or opinion contained in this presentation. the assets featured in the pictures in this presentation are not assets
for or purchase any securities in Quickstep, or an inducement to make of the Company.
an offer or invitation with respect to such securities. This presentation This presentation contains certain forward-looking statements
does not purport to cover all relevant information about any potential which have not been based solely on historical facts but, rather, on By accepting this presentation, you acknowledge and agree to be
investment in Quickstep. Accordingly, potential investors are advised Quickstep’s current expectations about future events and on a bound by each of the foregoing statements.
to seek appropriate independent advice, if necessary, to determine the number of assumptions which are subject to significant uncertainties
suitability of any investment. This presentation must not be relied on and contingencies, many of which are outside the control of Quickstep
to make an investment or other financial decision and recipients should and its directors, officers and advisors. Quickstep undertakes no
conduct their own investigations, enquiries and analysis and place no obligation to update these forward-looking statements for events or
reliance on this presentation in evaluating any potential investment. circumstances that occur subsequent to such statements or to keep
current any of the information provided. Any estimates or projections
None of Quickstep, or their respective employees, officers, related as to events that may occur in the future (including projections of
entities or advisers have audited or investigated the accuracy or revenue, expense, net income and performance) are based upon the
completeness of the information, statements and opinions contained best judgement of Quickstep and there is no guarantee that any of
in this presentation. Accordingly, to the maximum extent permitted these estimates or projections will be achieved. Actual results will vary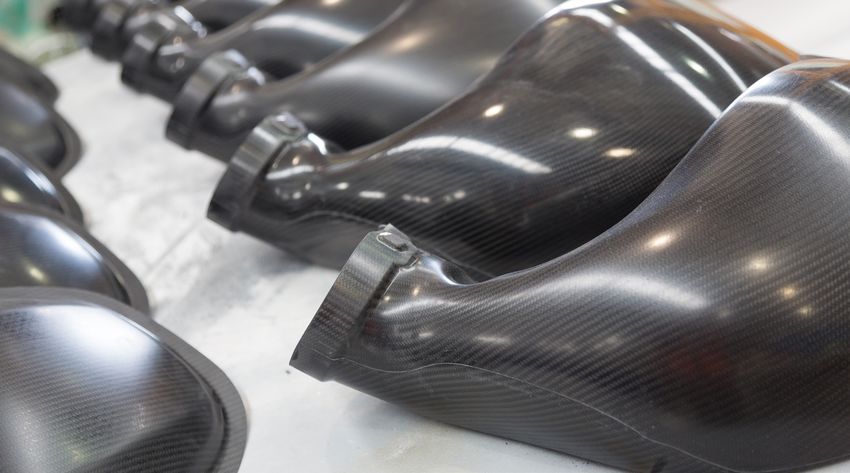
YOUR PRESENTATION TEAM

                         MARK BURGESS                              ALAN TILLEY
                         Managing Director and CEO                 Chief Financial Officer

                         Joined Quickstep in May 2017              Joined Quickstep in June 2018
                         Global aerospace and defence experience   Previously with Brambles, NRMA and Murray
                                                                   Goulburn (interim)
                         Previously with Honeywell & BAE Systems
                                                                   Multi-sector experience spanning manufacturing,
                         Extensive experience in Europe, USA,
                                                                   B2B services and FMCG in Australia and Europe
                         Middle East and Asia Pacific
                                                                   Broad experience spanning P&L responsibility,
                                                                   Finance, Treasury, Technology and Risk
OUR FOCUS
Advanced Composite Materials

Defence aerospace              Commercial aerospace   Other advanced sectors
“   Chemring's partnership with
                    Quickstep demonstrates the
                    very best in advanced
                                                                          “      Northrop Grumman & Quickstep
                                                                                 are continuing to develop a
                                                                                 Strategic Partnership to deliver

                                                                ”
                    manufacturing in Australia.                                  world-leading manufacturing

                                                                                                                                ”
OUR CUSTOMERS                                                                    capability to key Aerospace
                                                                                 Programs.
                                                                                 Chris Deeble, Chief Executive Officer,
                    Joe Farrah, Managing Director,
                                                                                 Northrop Grumman Australia
                    Chemring Australia
                                                     recreated pms

                                                                                                                          Chern ring
                                                                                                                              Australia

                                                                     MARANO
                                                                     PRECISION
AT A GLANCE
3 230
Locations Employees
+ >90%
ExportsSHAREHOLDERS
5,558 4,197
shareholders shareholders+/-
INVESTMENT CASE
Long dated contracts High degree of mid- High barriers to entry Excellent reputation
on key programs term revenue certainty with customers
+/-
Healthy pipeline of Balance sheet repaired Strong financial position New globally experienced
near-term growth management team
opportunitiesPERFORMANCE Revenue in AUD millions Key Profit Metrics (AUD millions)
From strength to strength
$75.0
$73.3
$70.0
$65.0
$60.0 $8.0
$59.0
$55.0 $6.0
$5.8
$50.0 $4.0
$51.9
$45.0 $2.0
$2.7
$1.2
$40.0 0
$30.0 -$2.0
$20.0 -$4.0
$10.0 -$6.0
0 -$8.0
FY17 FY18 FY19 FY17 FY18 FY19
EBITDA Net ProfitPERFORMANCE Gross Margin Percentage Net Debt (AUD millions)
From strength to strength
24%
22%
22%
20%
18%
16%
16%
14% 15% 0
12% -$2.0
10% -$4.0
8% -$6.0
6% -$8.0
4% -$10.0
0 -$12.0
FY17 FY18 FY19 FY17 FY18 FY19GROWTH STRATEGY Phase 1. Protect and grow Phase 2. Diversify and expand
Core defence Capability development and Commercial markets
leveraging our investments new mobility
Phase 1
$75 m
2019 2021 2024 2030FY20 OUTLOOK Like-for-like revenue growth 8 to 10%
EBITDA 8 to 10% of sales
Ongoing Improvement in gross margin
Material increase in operating cash flow
Excludes impact of any new business wins
Subject to AASB16 adjustmentsAPPENDIX Financial Data
IMPROVED OPERATING   AUD millions                        FY19    FY18   Change   Commentary
CASH FLOW AND
FRESH CAPITAL        Operating cash flow                 0.4     -0.7   1.1      Operating cash flow improvement includes
                                                                                 EBITDA increase of $4.6m to $5.8m for FY19
                                                                                 tempered by an increase in working capital
                     Gross capex                         -5.1    -1.2   -3.9     – principally inventory – to support revenue
                     Grant funding                       2.9     0.1    2.8      growth. Scope to improve inventory efficiency
                     Net capex                           -2.2    -1.1   -1.1
                                                                                 About 50% of gross capex is for base
                                                                                 business with the remainder for the flare
                     Proceeds from borrowings            5.2     6.0             housing project. Grant funding relates solely
                     Repayment of borrowings             -10.4   -4.7            to the flare housing project
                     Payment of borrowing costs          -0.3    -0.3
                                                                                 Net repayment of borrowings $5.2m funded
                     Net proceeds from issue of shares   11.7    0.0
                                                                                 by the capital raise
                     Net financing cash flow             6.2     1.0    5.2
                                                                                 $10.1m capital raise net of fees in March
                     Net cash flow                       4.4     -0.8   5.2      2019 followed by$1.6m April 2019 Share
                                                                                 Purchase Plan
FY19 – AUD millions FY19 FY18 Change Commentary
STRONG GROWTH IN
REVENUE, MARGINS Revenue 59.0 14.3 Revenue growth 24% principally from
& NPAT Gross Margin 9.3 7.1
growth in JSF volumes. C130 revenue stable
Gross Margin % 15.8% 6.5% GM% improvement through economies
of scale, efficiency and productivity
EBITDA 5.8 1.2 4.6 improvements and cost out
EBIT 3.9 -1.3 5.2
$5.2m improvement in EBIT despite $1.0m
increase in business development spend and
Tax Benefit 1.0 0.0 1.0 $0.4m reduction in grant income
Tax benefit recognized for the first time
NPAT 2.7 -2.9 5.6
reflecting sustainable taxable income positionAUD millions Jun 19 Dec 18 Jun 18 Jun/Jun Commentary
change
Net debt $0.3m at June 2019 – down by
MUCH HEALTHIER Trade and other receivables 6.9 6.0 4.4 2.5 $11.2m from December 2018 following $10.1m
BALANCE SHEET Prepayments and other assets 0.6 0.5 0.6 0 March 2019 capital raise and $1.6m April
2019 SPP. Working capital facility has been
POST CAPITAL RAISE Inventories 8.5 9.2 4.9 3.6
undrawn since mid March 2019
Contract revenue assets 9.8 6.8 6.3 3.5
Trade and other payables -14.3 -10.8 -9.0 -5.3 PP&E increase due to overdue investment
Contract liability -3.1 -3.3 -2.4 -0.7 in Bankstown site plus flare housing project
spend offset by grant funds received
Employee benefit obligations -1.9 -1.7 -1.5 -0.4
Total working capital 6.5 6.7 3.3 3.2 Contract revenue asset represents WIP and
finished goods for which revenue has been
Property, plant and equipment 14.8 12.7 13.2 1.6 recognised under AASB15
Contract liability is C130 deferred income
Cash and term deposits 8.1 4.0 3.7 4.4
Borrowings -8.4 -15.5 -13.6 5.2 Inventory levels above plan due to early
Net debt -0.3 -11.5 -9.9 9.6 delivery of raw materials by supplier at end
of June and risk mitigation due to stretched
supply chain
Deferred tax asset 1.0 0.0 0.0 1.0
Derivative financial instruments 0.1 0.5 0.2 -0.1 June 2019 trade receivables includes $1.1m
Net assets 22.1 8.4 6.8 15.3 late payment received on 2 July 2019THANK YOU MARK BURGESS Managing Director and CEO +61 2 9774 0300 mburgess@quickstep.com.au 361 Milperra Road Bankstown NSW 2200 Building LA 75 Pigdons Road Waurn Ponds VIC 3216
You can also read