June 2021 Commentary - National Bank Financial
←
→
Page content transcription
If your browser does not render page correctly, please read the page content below

June 2021 Commentary

Our hypothetical model gave up some ground in May, losing 0.85% and brining our year-to-date return
to 3.07%. In a nutshell, not much is happening as we prepare to enter the seasonally quiet period
through the summer. However, below the surface, the spring is winding tighter.

Market Update

Last month we gave you a small insight into the technical picture of the market. With apologies to
readers who find this sort of thing tedious, we’ve rarely addressed it in these pages and thought it
would give a different perspective. ‘Technical’ refers to reading price charts and the various metrics
attached to them to yield some insight, isolated from fundamentals. Last month our 60,000 foot view
was that after two spectacular years of gains in 2019 and 2020, at some point we needed a correction.
That could come in the form of a sharp, short-term decline of the type we’ve seen many times. Or it
could come with the market seemingly doing nothing on the surface for an extended period while it
digests those gains. This happens less frequently and is often a sign of strength. It’s this option that
seems to be unfolding now.
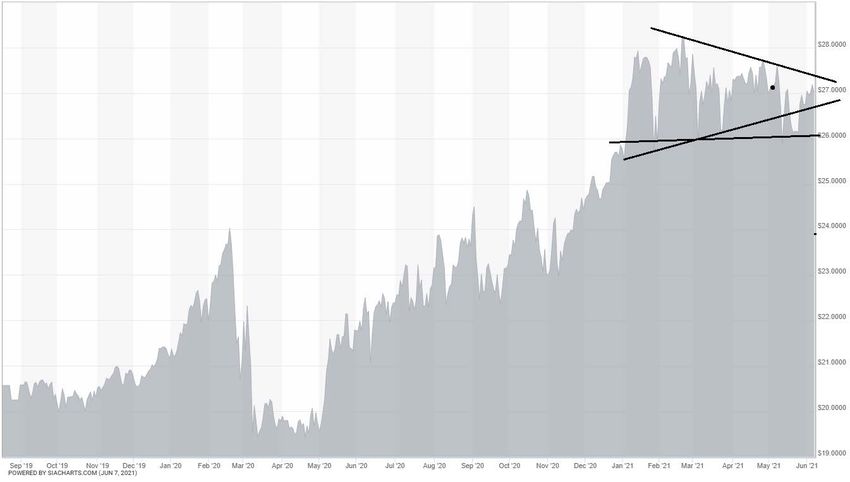
Wedge Pattern Continues
                                    + Major Support Forming

                                 Covid Crash:
                                 Feb-Mar 2020
  Inception:
  Aug. 16, 2019

This is the same graph of our SIA ML Global Tactical Pool that we showed last month, updated to
include May’s data. The wedge that was forming has continued. The dot in the middle of the wedge
is where we left off last month so everything to the right of that is new data for May. Amazingly, the
subsequent peak in early May exactly touched the upper limit projected by the wedge before reversing
back down.

On the lower side the boundary was breached but rebounded strongly back into the wedge, so it is still
in play. We call this a false break-out. When you see a channel or formation like this, 80% of the time
when the price breaks out it fails, faking out traders who are poised to take advantage of it.

As often happens, these patterns evolve. This month we’ve added a horizontal line, which is another
way of looking at the same data. Rather than looking at a narrowing wedge that should eventually
lead to a real price break-out, you can instead view the pattern as a base of support forming at around
the $26.00 unit price (horizontal line). On half a dozen occasions the price of the fund has touched this
area before rebounding. This has taken five months to unfold (and counting). The longer it lasts, the
stronger it will act.

Conclusion? So far it is confirming what we proposed last month. The market is strong, biding it’s
time. Both the wedge pattern and the support line suggest the next move is higher. The longer this
continues the tighter it winds the spring, creating more potential energy for the eventual move -
whatever it happens to be. Keep in mind that this type of analysis gives context about what is most
likely, but it is rarely more reliable than 60%.
Bond Update

Long time readers of this letter will know that we are generally not huge fans of bonds (fixed income).
This is especially so at this particular point in history where rates are low and governments around the
world have become utterly unhinged in their borrowing. To us, this makes investing in government
bonds – i.e. lending to governments – one of the worst ideas in investing.

Having said that, we face certain constraints in our portfolio construction and many clients need to
hold some fixed income. We’ve done quite a bit of due diligence to find solutions that would eliminate
some of our concerns. In addition to the declining credit quality of government issuers, especially
Canada, we want to keep our bonds short-term to mitigate the risk of rising interest rates. At the same
time, achieving these objectives usually means turning to high yield corporate bonds and so we add
mitigating credit quality to the list. There are other factors as well.

Thus far we’ve found one remarkable solution that we think will serve us well, and one conservative
solution that achieves part of what we’re after. Neither is perfect but both are moves in the right
direction, which is away from politicians. To that end, for clients that do hold bonds, over the last two
months we’ve shifted two-thirds of your fixed income from short term Canada’s into these new
positions. Having said that, it’s not enough to get excited about and we’re still researching better
solutions. If we find any we won’t hesitate to move on them.

                               June 2021 Portfolio Review
            Mott Liokossis Hypothetical Model sector breakdown at the end of May 2021:

                      Cash                                                2.09%
                      Diversified Global Equity Portfolio                39.92%
                      Electronics & Semi-Conductors                      12.43%
                      Diversified Canadian Equity Portfolio              11.79%
                      Specialty Retail                                   11.78%
                      Manufacturing                                       5.83%
                      Aerospace & Defense                                 5.75%
                      Internet                                            5.62%
                      Automotive                                          4.81%
                                                                       SIACharts.com
Hypothetical Model Growth Portfolio Holdings at the end of May 2021:
% Held Security Symbol Sector Price Yield
0.95% Cash
6.20% Airbus SE ADR EADSY Aerospace & Defence $ 39.44 0.00%
7.28% ASML Holding NV ASML Electronics & Semi-Conductors $ 814.68 0.40%
11.85% BMO SIA Focused CDN EQ ETF ZFC Canadian Equity Portfolio $ 37.94 1.67%
5.62% Deere & Co DE Manufacturing $ 435.52 0.73%
7.15% Dicks Sporting Goods DKS Specialty Retail $ 117.63 1.11%
5.24% PulteGroup Inc PHM Construction $ 69.70 0.75%
39.90% SIA ML Global Tactical Pool SWI220 Global Equity Portfolio $ 26.75 5.89%
5.34% Tata Motors LTD TTM Automotive $ 26.21 0.00%
5.22% Tractor Supply Company TSCO Specialty Retail $ 219.15 0.84%
5.24% Whirlpool Corp WHR Consumer Durables $ 285.95 1.78%
SIACharts.com
SIACharts.comSIACharts.com Click here to access your online Click here to learn more about the Click here to contact us. account and tax statements. team. Blair Mott, FCSI, CIM, FMA Tony Liokossis, B.A., FCSI, CIM Vice President & Portfolio Manager, Investment Vice President & Portfolio Manager, Investment Advisor Advisor
519-646-2146                                              519-646-5728
blair.mott@nbc.ca                                         tony.liokossis@nbc.ca

Stephanie Lindsay, HBA                                    Juliana Weese
Investment Associate                                      Investment Associate
519-646-2149                                              519-646-2152
stephanie.lindsay@nbc.ca                                  juliana.weese@nbc.ca

                                                                                                        Terms of use
© NATIONAL BANK FINANCIAL. All rights reserved 2019.                                                  Confidentiality
                                                                                                     ABC's of security

The information contained herein was obtained from sources we believe to be reliable, but is not guaranteed
by us and may be incomplete. The opinions expressed are based on our analysis and interpretation of this
information and are not to be construed as a solicitation or offer to buy or sell the securities mentioned herein.
The opinions expressed herein are those of the author and do not necessarily reflect those of National Bank
Financial.

The securities or investment sectors mentioned herein are not suitable for all types of investors. Please consult
your investment advisor to verify whether the securities or sectors suit your investor's profile as well as to obtain
complete information, including the main risk factors, regarding those securities or sectors. This document is
not a research analysis produced by the Research Department of National Bank Financial.

National Bank Financial - Wealth Management (NBFWM) is a division of National Bank Financial Inc. (NBF),
as well as a trademark owned by National Bank of Canada (NBC) that is used under license by NBF. NBF is a
member of the Investment Industry Regulatory Organization of Canada (IIROC) and the Canadian Investor
Protection Fund (CIPF), and is a wholly-owned subsidiary of NBC, a public company listed on the Toronto
Stock Exchange (TSX: NA)

For unsubscribe options, click here.
You can also read