Managing global assets: keeping faith in low discount rates Alex Lyle, Head of Managed Funds
←
→
Page content transcription
If your browser does not render page correctly, please read the page content below

Managing global assets: keeping faith in low discount rates
Alex Lyle, Head of Managed Funds
For professional investors only
May 2021

Discount rates to remain low
Inflation risk? To us, inflation appears transitory
◼   Short-term risks                                Eurozone, UK and US Core Inflation:
    ◼   Capacity loss                               Range bound since 2000

    ◼   Bottlenecks
    ◼   Increased costs from COVID
    ◼   Less globalisation
    ◼   Environmental/regulatory costs
    ◼   Raw material prices

◼   We do not expect a material increase over the
    medium term
    ◼   Capacity restored
    ◼   Long-term deflationary forces return
    ◼   Productivity improvements in the pipeline
                                                    Source: Macrobond, as at 11 May 2021.

                                                                                            2
Discount rates to remain low
Reasons to be cheerful: Authorities have their feet on the floor
Rolling 12m global central bank purchases     Fed Funds Futures curve
($trn)

Source: Citibank, as at 31 December 2020.     Source: Macrobond, as at 13 May 2021

                                                                                     3
Bond outlook
We remain cautious on fixed income overall
10yr government bond yields                                          Reasonable backdrop but little value
14%                                                                  ◼   We expect yields to stay low in light of low
                    US            Germany      UK     Japan
                                                                         inflation and ongoing Quantitative Easing
12%
                                                                     ◼   Most attractive opportunities in: US Treasuries
10%                                                                      and European periphery
  8%                                                                 ◼   Yet overall value is limited here, despite
                                                                         increase in yields
  6%
                                                                     ◼   Credit spreads remain fairly attractive
  4%

  2%

  0%

 -2%
    1990          1995         2000     2005   2010   2015    2020

Source: Bloomberg, as at 10 May 2021.

                                                                                                                        4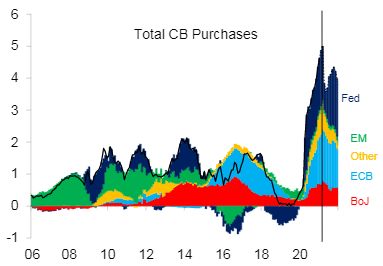
The economic recovery
Governments also stoking the fire
Developed government gross debt and fiscal balances 20201 (% of GDP)
     130                                                               125,5
                Gross public debt
     125
     120
     115                                                                                     +20.8%
     110
                             104,7
     105
     100
                            Jan '20                                   Nov '20
       0                     WEO

      -5                     -3,0
                                                                                               -11.4%
    -10
    -15
                                                                       -14,4
    -20       Fiscal balance
                       Jan '20                                        Nov '20
                        WEO

Source: IMF, World Economic Outlook database; and IMF staff estimates, 2020 forecasts as at November 2020.

                                                                                                             5
The economic recovery
The ‘V-shape’
US Retail Sales and manufacturing PMIs US GDP: 2021 expectations upgraded
8%
6%
4%
2%
0%
-2%
-4%
2018 2019 2020 2021 2021
(Jan est.) (May est.)
Source: Macrobond, as at 11 May 2021. Source: Bloomberg, estimates are 1 January and 10 May 2021 consensus forecasts.
6The economic recovery
Excellent vaccine news
Daily new confirmed cases per million people All Americans offered a vaccine by August
1 000
800
600
400
200
0
Jan-20 Apr-20 Jul-20 Oct-20 Jan-21 Apr-21
UK US
All intellectual property rights in the brands and logos set out in this slide are reserved by
respective owners. The mention of any specific shares or bonds should not be taken as a
Source: John Hopkins University CSSE COVID-19 Data, as at 8 May 2021. recommendation to deal.
7Equity prospects: Companies are surprising on the upside
And the ‘COVID winners’ are thriving
S&P500 EPS ahead of estimates by 22% US companies beating Q1 earnings estimates
100%
Beaten Reported
25% 50%
22,1%
86%
20%
0%
EPS Surprise
Q1 21
15% Amazon, Apple, Facebook, Microsoft &
Alphabet: Combined results: Q1-21 versus Q1-20
10% 100%
5% 50% +105%
+41%
0%
0% Revenue Profit
Q1 '16 Q1 '17 Q1 '18 Q1 '19 Q1 '20 Q1 '21 Source: Macrobond and S&P500, as at 5 May 2021. The mention of any specific shares or bonds
Source: Macrobond and S&P500, as at 11 May 2021. should not be taken as a recommendation to deal.
8Areas of interest in equities
Secular trends to continue and even accelerate
De-carbonisation Payments:
Digitisation Demographic change
Cloud computing But shorter-term, play the economic bounce
Re-opening/cyclicality
Medical tech
Source: Columbia Threadneedle Investments. All intellectual property rights in the brands and logos set out in this slide are reserved by respective owners. The mention of any specific shares or bonds should not
be taken as a recommendation to deal.
9Global property (REITs)
Near-term economic headwinds. Supportive structural trends
Neutral overall view Seeking a sustainable competitive advantage
+ Low funding costs Industrial Towers & data centres
+ Growth sectors of interest
- Retail format rapidly changing
- Future office requirements in question
Barriers
to entry
Seeking a Residential Self-storage
Pricing Low
power sustainable capex,
through competitive high
scale margin
advantage
Secular
demand
Source: Columbia Threadneedle and Stanlib, as at 31 March 2021. The mention of any specific shares or bonds should not be taken as a recommendation to deal. All intellectual property rights in the brands and
logos set out in this slide are reserved by respective owners
10Preferred asset classes for the medium term
Strongly Strongly
Dislike Neutral Favour
dislike favour
Fixed Income
Property
Some Equities
Positives and
opportunities in Focus on strong
negatives: leave
US Treasuries, economies of US
us net neutral
European & Asia and
with focus on
periphery and attractive growth
growth themes
credit companies
Columbia Threadneedle, as at May 2021.
11Important information
For use by Professional and/or Qualified Investors only (not to be used with or passed on to retail clients)
Past performance is not a guide to future performance. Your capital is at risk.
The value of investments and any income is not guaranteed and can go down as well as up and may be affected by exchange rate fluctuations. This means that an investor may not get back the amount invested.
Performance figures and other data relating to a fund or a representative account are provided for illustrative purpose only and may differ from that of other separately managed accounts due to such differences
as cash flows, charges, applicable taxes, and differences in investment strategy and restrictions.
Where references are made to portfolio guidelines and features, these are at the discretion of the portfolio manager and may be subject to change over time and prevailing market conditions. Actual investment
parameters will be agreed and set out in the prospectus or formal investment management agreement. An actual proposal will be subject to negotiations and the content of this document are not binding and
remain subject to contract.
Please note that the performance target may not be attained.
The analysis included in this document has been produced by Columbia Threadneedle Investments for its own investment management activities, may have been acted upon prior to publication and is made
available here incidentally. Any opinions expressed are made as at the date of publication but are subject to change without notice and should not be seen as investment advice. Information obtained from external
sources is believed to be reliable, but its accuracy or completeness cannot be guaranteed.
The mention of any specific shares or bonds should not be taken as a recommendation to deal.
This presentation and its contents are confidential and proprietary. The information provided in this presentation is for the sole use of those attending the presentation. It may not be reproduced in any form or
passed on to any third party without the express written permission of Columbia Threadneedle Investments. This presentation is the property of Threadneedle Investments and must be returned upon request.
This presentation is not investment, legal, tax, or accounting advice. Investors should consult with their own professional advisors for advice on any investment, legal, tax, or accounting issues relating an
investment with Columbia Threadneedle Investments.
Issued by Threadneedle Asset Management Limited. Registered in England and Wales, Registered No. 573204, Cannon Place, 78 Cannon Street, London EC4N 6AG, United Kingdom. Authorised and regulated in
the UK by the Financial Conduct Authority
Columbia Threadneedle Investments is the global brand name of the Columbia and Threadneedle group of companies.
12You can also read