Charts of the Month February 2021 - Bloomberg Chart Book - Bloomberg ...
←
→
Page content transcription
If your browser does not render page correctly, please read the page content below

Bloomberg Terminal
Bloomberg Chart Book

Charts of the Month

                       Data Visualization
February 2021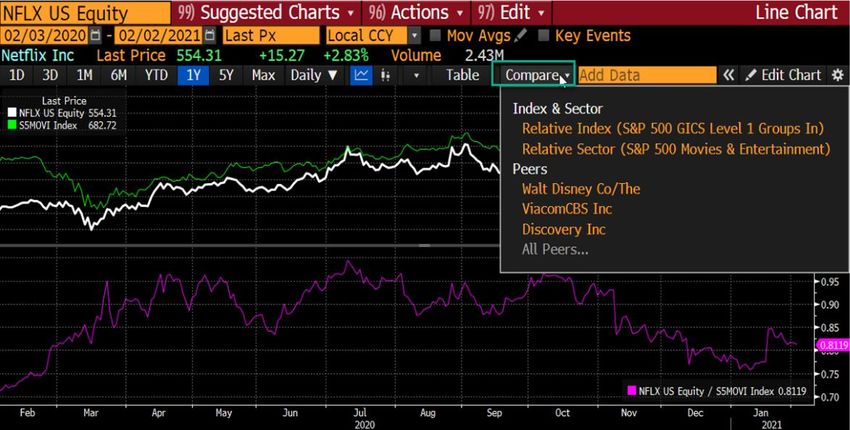
Charts of the Week -
Insights you can fit in a
lunch break
Make space for a power lunch with Charts of the Week,
your own regular briefing on key market themes with a
Bloomberg specialist.

Each 15-20 minute webinar tackles a key theme or
asset class, using backtesting tools to provide analysis
of the trends, anomalies and technical insights you
need to keep an eye on.

Look out for new editions every Monday at 2pm GMT
and watch any time, on your phone, tablet or computer.

To learn more, go to
bloomberg.com/charts-of-the-week

Access deeper data.
G store all your saved,   TECH houses all your          TSIG is your trading        BTST introduction to our     WEIB your market
custom charts here. Easily    technical indicators, including   signal platform for quick       backtester. See cumulative       breadth dashboard across
organize, share, and more.    3rd party and custom creations.   statistical analysis, market    P&L, risk metrics and more for   world equity indices, providing
                                                                impact, alerts and screening.   popular technical strategies.    insights into internal strength
                                                                                                                                 and weakness.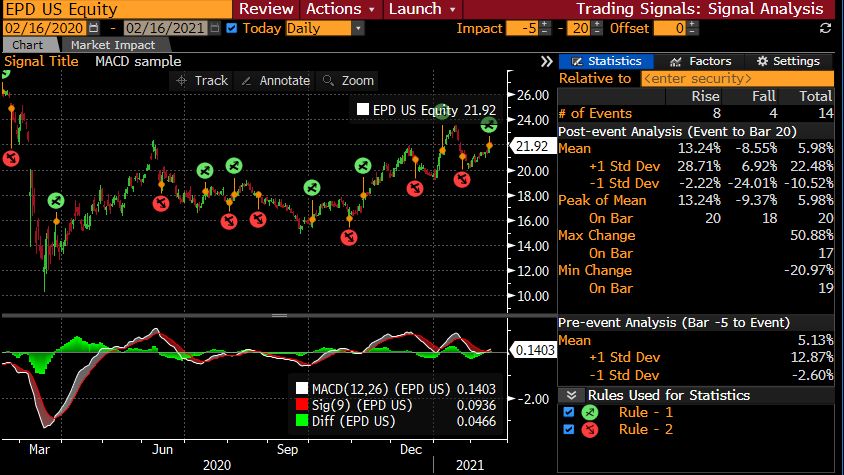
Charts of the Month
Welcome to Charts of the Month, bringing you insights on technical analysis and key
market themes alongside a roundup of the latest news and enhancements on the
Terminal.

 Topic Takeaways

 •   Signal of the Week, EPD US EQUITY MACD cross
 •   FFM of the Week, As Oil Breaks $60, It Faces Reality Check From Rising Hedges
 •   Enhancement of the Week, the compare button for relative and peer analysis

                                                                                      3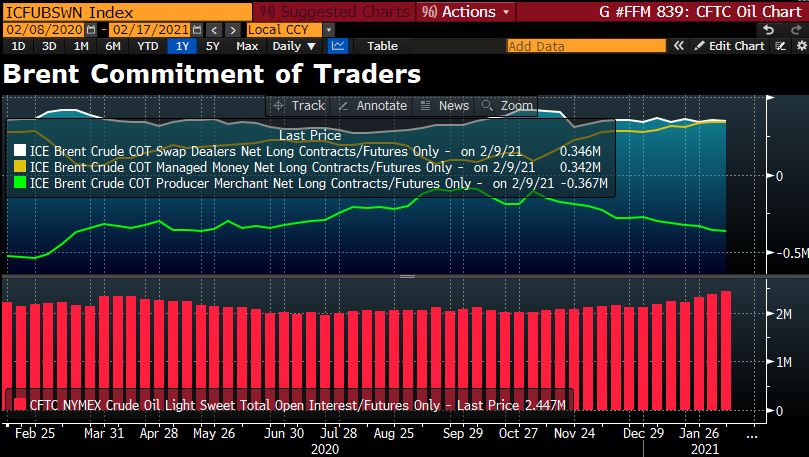
Signal of the Month
TSIG
Enterprise Product Partners MACD Cross

(Bloomberg) -- The MACD line crosses above its signal line, indicating a buy signal as of 2/16/2021 date using default
parameters of 12 and 26.

In the past year, Enterprise formed a MACD cross 14 times and rose an average 6% in the next 20 days
• 67% of the time the MACD indicator has fired a signal that has generated a profit over the following 20 days
• The Relative Strength Index (RSI) is neither overbought nor oversold, and Hurst indicator is indicative of trending
   price movement. The Fear and Greed indicator is positive, indicating the bulls are in control.
• This 20 day holding period can be customized by clicking the + or - icon identified in the picture below.
• To access this signal a singular or list of securities, you can go to TSIG  , click on sample signals, and scroll
   down to the MACD signal. To launch this on a list of securities, click on the red “Launch” button followed by one time
   screen.
                   NSN QHXYHVDWLU6R

                                                                                                                            4
FFM of the Month
FFM
As Oil Breaks $60, It Faces Reality Check From Rising Hedges by Darcy Shin
(Bloomberg) -- Oil’s ascent may need a reality check. Brent futures broke the $60 a barrel level on
Feb. 8 for the first time in more than a year, amid OPEC+ supply cuts and a vaccine-driven demand
recovery. While money managers have raised net-long positions, oil producers have increased net-
short positions. Strong demand to make options bets against Brent has sustained a premium for puts
over calls.
Use Bloomberg functions to track Brent futures positions, options volatility and the maturity curve, as
well as tanker movements.
Money managers have increased Brent crude
oil net-long positions (yellow) while oil
producers widened their net-short positions
(green). Rising open interest (red) suggests
speculative trade.
5Enhancement of the Month
GP
The Compare button allows you to quickly add relevant benchmarks and peers. This creates a dynamic experience where
changes in the loaded security will actually change the benchmark to something relevant, ie the appropriate sector index, in
both the top panel where price is along with the denominator of the ratio that’s added in the lower panel for relative strength
analysis. Rather than a benchmark, you can also quickly add peers. Click on “All Peers” at the bottom of the menu to
access a smart filtering pop up that allows you to pull up peers based on segment, market cap, and more. Check several
tickers of interest to add them to the chart all at once. For an apples to apples comparison, click on the “Edit Chart” button
to the far right of the chart and click the normalize box for several indexing options.
6Contributing Analysts Merle Dweck Senior Foreign Exchange and Technical Analysis Specialist Charting & Technical Analysis Team Oliver Woolf Product Manager, Visual Analytics Adriana Bruno Product Application Specialist , AMER Tim McCullough Product Application Specialist , EMEA
Take the next step.                                                                   Beijing                                    Hong Kong                                  New York                                   Singapore
                                                                                      +86 10 6649 7500                           +852 2977 6000                             +1 212 318 2000                            +65 6212 1000
For additional information, press the                                                 Dubai                                      London                                     San Francisco                              Sydney
 key twice on the Bloomberg                                                     +971 4 364 1000                            +44 20 7330 7500                           +1 415 912 2960                            +61 2 9777 8600
Terminal®.                                                                            Frankfurt                                  Mumbai                                     São Paulo                                  Tokyo
                                                                                      +49 69 9204 1210                           +91 22 6120 3600                           +55 11 2395 9000                           +81 3 3201 8900

bloomberg.com/professional

The data included in these materials are for illustrative purposes only. The BLOOMBERG TERMINAL service and Bloomberg data products (the “Services”) are owned and distributed by Bloomberg Finance L.P. (“BFLP”) except (i) in
Argentina, Australia and certain jurisdictions in the Pacific islands, Bermuda, China, India, Japan, Korea and New Zealand, where Bloomberg L.P. and its subsidiaries (“BLP”) distribute these products, and (ii) in Singapore and the
jurisdictions serviced by Bloomberg’s Singapore office, where a subsidiary of BFLP distributes these products. BLP provides BFLP and its subsidiaries with global marketing and operational support and service. Certain features,
functions, products and services are available only to sophisticated investors and only where permitted. BFLP, BLP and their affiliates do not guarantee the accuracy of prices or other information in the Services. Nothing in the Services
shall constitute or be construed as an offering of financial instruments by BFLP, BLP or their affiliates, or as investment advice or recommendations by BFLP, BLP or their affiliates of an investment strategy or whether or not to “buy”, “sell”
or “hold” an investment. Information available via the Services should not be considered as information sufficient upon which to base an investment decision. The following are trademarks and service marks of BFLP, a Delaware limited
partnership, or its subsidiaries: BLOOMBERG, BLOOMBERG ANYWHERE, BLOOMBERG MARKETS, BLOOMBERG NEWS, BLOOMBERG PROFESSIONAL, BLOOMBERG TERMINAL and BLOOMBERG.COM. Absence of any
trademark or service mark from this list does not waive Bloomberg’s intellectual property rights in that name, mark or logo. All rights reserved. © 2018 Bloomberg.

Bloomberg Intelligence is a service provided by Bloomberg Finance L.P. and its affiliates. Bloomberg Intelligence shall not constitute, nor be construed as, investment advice or investment recommendations (i.e., recommendations as to
whether or not to “buy”, “sell”, “hold”, or to enter or not to enter into any other transaction involving any specific interest) or a recommendation as to an investment or other strategy. No aspect of the Bloomberg Intelligence function is
based on the consideration of a customer's individual circumstances. Bloomberg Intelligence should not be considered as information sufficient upon which to base an investment decision. You should determine on your own whether you
agree with Bloomberg Intelligence.

Bloomberg Intelligence is offered where the necessary legal clearances have been obtained. Bloomberg Intelligence should not be construed as tax or accounting advice or as a service designed to facilitate any Bloomberg Intelligence
subscriber's compliance with its tax, accounting, or other legal obligations. Employees involved in Bloomberg Intelligence may hold positions in the securities analyzed or discussed on Bloomberg Intelligence.
You can also read