Satellite detection of volcanic aerosol at Miyakejima and Sakurajima
←
→
Page content transcription
If your browser does not render page correctly, please read the page content below
Nagasaki Workshop on Aerosol-Cloud Radiation Interaction And Asian Lidar Network, Nov. , 2001

     Satellite detection of volcanic aerosol at Miyakejima and Sakurajima

                        M. Koyamada1, K. Kinoshita1, N. Iino2 and C. Kanagaki3
          1
              Faculty of Education, Kagoshima University, 1-20-6, Korimoto, Kagoshima 890-0065
                                    E-mail: kisei@edu.kagoshima-u.ac.jp
                         2
                            Faculty of Engineering, Kagoshima University, 890-0065
                         3
                            Amura Junior High School , Matsushima , Kumamoto 861-6102

Abstract: Ash-rich clouds at Sakurajima are well detected by the difference image of NOAA/AVHRR 5 and 4,
while vapor clouds at Miyakejima are insensitive to the difference. Instead, the latter are detected by the
difference of AVHRR 1 and 2, and discriminated well from meteorological clouds in many cases. Miyakejima
plumes contain a lot of volcanic gas, and the daily monitoring of them by the NOAA satellites serves to
understand high concentration events of sulfur dioxide at the downstream surfaces.
                  Keywords: NOAA/AVHRR, sulfur dioxide, satellite observation, aerosol

1. Introduction                                               was detected by TERRA/ASTER sensor by Urai [5].
      Miyakejima volcano, about 160 km south of               Thermal anomalies at Miyakejima crater were
Tokyo as shown in Fig. 1, started eruptive activities         analyzed by Kaneko et al. using nighttime thermal
at the summit Oyama (814 m) on 8 July 2000. Big               images of NOAA/AVHRR [6].
eruptions were recorded on 10, 18 and 29 August                   In this study, we analyze NOAA/AVHRR
with the altitudes of volcanic clouds about 8, 15 and         images to detect the volcanic clouds from
8 km, respectively. Since August 28, volcanic                 Miyakejima, and compare them with Sakurajima
clouds and gas toward Main Island of Japan caused             plumes. Furthermore, we discuss the SO2 high
high concentration episodes of SO2 at many ground             concentration episodes recorded in the central part
stations 100-400 km leeward from Miyake-jima.                 of Japan, by comparing the dispersion of volcanic
Although big eruptions were not recorded since                clouds in the satellite images, gas information at the
September, and plume heights were less than 3000              surface and the upper wind data.
m above sea level, the estimated emission of SO2
increased to 20-30 kt/day since mid-September.
Southern and southwesterly winds brought the
volcanic gas to the Main Island of Japan, where the
smells of sulfur and/or H2S were reported in various
places. Since October, gray ash clouds are hardly
seen, and the plumes turned out to be white with
heights less than 1500 m above sea level after the
middle of that month. Volcanic activities of
Miyakejima have continued, with the emitted
amount of SO2 in volcanic gas about 10 times that
of Sakurajima.
     In previous studies, we have analyzed the air
pollution at the foot of Miyakejima volcano, and the
long-range advection of volcanic gas using various
data such as satellite data, wind data, SO2
concentration at the surface and the gas information          Fig. 1. Location of Miyakejima in Izu Islands to the south
[1-4]. The dispersion of SO2 in Miyakejima plumes             of Tokyo. (2001/7/10 07:25JST NOAA15)
Nagasaki Workshop on Aerosol-Cloud Radiation Interaction And Asian Lidar Network, Nov. , 2001
2. Methods of analyses analyzed in details in [2-4].
2-1. Satellite data analysis of Sakurajima plumes As the other sources of the information of SO2
In our previous studies, the split-window effect, there are the news of smell of sulfur, the
method taking the difference of AVHRR 4 and 5 notes of bulletin board in Internet, and Atmospheric
(Aerosol Vapor Index: AVI = n (5) – n (4) + c) was Environmental Regional Observation System
very effective for the discrimination of the volcanic (AEROS) [7].
clouds at Mt. Sakurajima and Mt. Aso from the
meteorological ones. This is due to the ash
components with emissivity at 12 m higher than at
11 m. Fig. 2 shows wavelength of each band of
NOAA/AVHRR and other satellites/sensors. This
method can be also applied in monitoring large
volcanic eruptions by GMS-5/VISSR.
2-2. Satellite data analysis of Miyakejima plumes Fig. 2. Wavelength of each band of satellites/sensors.
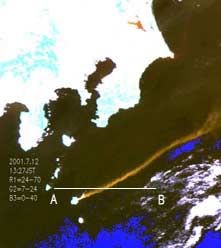
Volcanic clouds from Miyakejima were
recognized as bright objects in visible and near
infrared images as shown in Fig. 3 for 2001/7/12
13:27JST by NOAA16. Fig. 4 shows a profile of
each band along the line AB indicated in Fig. 3.
Volcanic cloud is not detected in band 4 and 5, but
is detected in band 1, 2 and 3. We were able to
distinguish volcanic cloud and meteorological ones
from the difference of band 1 and 2. This may be
due to the fact that volcanic cloud of Miyakejima is
mainly white vapor with less ash since September
2000.
Band 3 is more sensitive to meteorological
clouds compared with volcanic ones. We were able
to distinguish volcanic clouds and meteorological
ones by making color images of R:G:B= Fig. 3. Miyakejima plume, 2001/7/12 13:27JST
bands1:2:3. At the station in Kagoshima University, NOAA16 R:G:B=1:2:3
we receive data of NOAA12 at about 16:00,
NOAA15 at about 7:00 and NOAA16 at about
13:00 in the daytime.
2-3. SO2 concentration.
The estimates of total SO2 emission by the
correlation spectrometer (COSPEC) are shown in
the homepages of GSJ (http://www.gsj.go.jp/
~imiyagi/Works/Event/Miyake2000/geol/000916
cospec/) and Japan Meteorological Agency (http://
www.kishou. go.jp/miyake/jyoukyo/1116.pdf).
The Tokyo Metropolitan Government began
continuous measurement of SO2 and H2S from Fig. 4. The data values of the bands1 5(left scale) and the
November 2000 in Miyakejima, and also provides difference band1 - band2(right scale) along a section in the
one-hour values of SO2 concentrations in Tokyo, as NOAA16/AVHRR image on 2001/7/12 13:27JSTNagasaki Workshop on Aerosol-Cloud Radiation Interaction And Asian Lidar Network, Nov. , 2001
2-4. Upper wind data results of strong eruptions with much ash. They
In this study, we assume that the volcanic gas were drifted eastwards at high altitudes by the
behaves almost together with volcanic clouds, on westerly winds, as their top heights were about
the bases of previous analysis of Sakurajima 2000-4000 m from the summit crater (1040
volcano [8]. The nearest station of upper air m). There are many other scenes of small-scale
observation by means of radio-sonde measurements clouds drifting toward different directions according
is Hachijo-jima, which is to the south of to the weather conditions [8].
Miyakejima as shown in Fig. 1. We confirmed that
the wind field around Miyakejima is well
approximated by the Hachijo-jima winds in most
cases. Since the height of Miyakejima is 814m, we
used the wind data obtained at 925hPa equivalent to
about 830m above sea level at the Hachijo-jima
station of the upper air observatory. The observation
is performed 4 times / day at 03, 09, 15, 21JST.
To investigate the advection and dispersion of
volcanic clouds and gas corresponding to SO2 high
concentration episodes in the Honshu area in
conjunction with satellite images, we have Fig 5. AVHRR-4 at 07:26 on 20 October 1992
performed the simulation of the dispersion of
volcanic clouds based on a simple vertical shear
model (VSM) using upper wind data [9].
Environment Scientific Research Part of Japan
Atomic Energy Research Institute predicts diffusion
behavior of volcanic gas at Miyakejima by the
real-time simulation system SPEEDI (System for
Prediction of Environmental Emergency Dose
Information) which developed in order to predict
radioactive material diffusion in atomic energy
accident, and shows the results on the following
homepage (in Japanese): http://des.tokai.jaeri.go.jp
/incoming/. Fig 6. NOAA14 AVI image at 07:16JST on 1996/12/14
3. Results and discussions
3-1. Volcanic clouds at Sakurajima
V-shaped long-range advection more than
300km is detected by AVHRR 4 as shown in Fig. 5.
White parts of AVI images in Figs. 6 - 8 are
volcanic clouds at Sakurajima, and Karman Vortex
is formed with Cheju Island in Fig. 7.
Fig. 8 demonstrates the dispersion of ash
clouds from Sakurajima Volcano toward east over
the Kuroshio Current in Pacific Ocean at 14:13JST
on 28 January 1992. Thus, we see that the influence
of volcanic clouds at Sakurajima extends
occasionally to a long distance.
Volcanic clouds shown in Figs. 5-8 were the Fig 7. NOAA AVI image at 06:17 on 10 December 1999Nagasaki Workshop on Aerosol-Cloud Radiation Interaction And Asian Lidar Network, Nov. , 2001
Fig 8. NOAA-11/AVHRR image at 14:13JST on 28 January 1992
3-2. Hotspots at Sakurajima, Aso and Swanose
volcanoes
NOAA/AVHRR band 3 captures temperature
anomaly of the crater. Hotspots of Sakurajima and
Aso are shown as black points in Figs. 9 and 10.
Hotspots of Sakurajima and Swanose-jima are seen
in Fig 11. In the same scene, they are not found at
Aso and Unzen.
Fig. 9. NOAA image at Fig. 10. NOAA image at
02:35JST on 30 October 01:42JST on 4 November
1989 1989
Fig 11. NOAA image at 05:26JST on 17 May 2001Nagasaki Workshop on Aerosol-Cloud Radiation Interaction And Asian Lidar Network, Nov. , 2001
3-3. Volcanic clouds at Miyakejima drift at the altitudes about 1-2 km for medium and
In Figs. 12-17, we show the NOAA/AVHRR week winds otherwise.
images of Miyakejima plumes. The plumes are dark
in Figs. 12 and 14, which represent the band
difference 2 - 1, while they are white in Figs. 13 and
17 with the opposite difference. Figs. 3, 15 and 16
are monochrome version of color images with
R:G:B = 1:2:3(or 4) which are useful to
discriminate volcanic aerosol from meteorological
clouds. Since lots of chemical substances in the gas
are dissolved into the vapor clouds at Miyakejima,
liquid aerosol with small diameters may be
expected to remain after the dispersion in the dry air, Fig 12. NOAA image at 13:31 on 30 November 2000
resulting the above detection methods effective.
Typical patterns of Miyakejima plumes may be
classified into two. When the winds are strong and
collimated, we have linear type with narrow width
such as shown in Figs. 3 and 13. On the other hand,
we have dispersed type with rather wide width such
as Figs. 12, 14, 16 and 17, when the winds are not
so strong. It is not obvious to classify small-scale
plumes such as Fig. 15. Volcanic gas from
Miyakejima often arrived at the central part of
Japan drifted by the southern wind especially in Fig 13. NOAA-14/b1-b2 image at 15:12JST on 5
summer, while occasionally in other seasons owing December 2000
to the change of wind-direction caused by the
traveling of low/high pressure systems nearby.
Other islands near Miyakejima may be affected by
the gas, such as Hachijo-jima in Fig. 12. In the case
of Fig. 14, the SO2 concentration at the foot of
Miyakejima stayed low, since the gas and plume
were not blown down with the wind velocity
3-6m/s.
On the day of Fig.15, SO2 of 158ppb was
detected at 14:00 at Toba in Mie Prefecture
(information of AEROS). About 5 hours earlier than Fig 14. NOAA image at 07:34 on 17 April 2001
the time of Fig. 16, SO2 of 423ppb was detected at
Oyasu also in Mie (11:00, information in AEROS).
Fig. 16 indicates the change of the wind direction
after affecting westwards.
On the same day as Fig. 17, SO2 of 423ppb
was detected at Sodegaura, Chiba Prefecture at
16:00 (information in AEROS). In the NOAA image
received at 7:27, the plume had reached already
Boso Peninsula. We suppose that the development
of the convection mixing in the daytime brought
down the gas to the surface, since the plume and gas Fig 15. NOAA image at 13:28 on 2 July 2001Nagasaki Workshop on Aerosol-Cloud Radiation Interaction And Asian Lidar Network, Nov. , 2001
receiving station in Kagoshima University. The
Tokyo Metropolitan Government offered SO2
measurement data in Miyakejima. We thank very
much to these institutions.
References
[1] M. Koyamada, K. Kinoshita, N. Iino and C. Kanagaki,
Flow of volcanic clouds and gas from Miyakejima and
satellite image analysis, Proc. 29th Japanese Conf. Rem.
Sens., pp.37-40, 2000 (in Japanese with English abstract).
[2] K. Kinoshita, C. Kanagaki, M. Koyamada and N. Iino,
Behavior of volcanic gas at Miyakejima and
meteorological conditions, Western Regional Div. Rep. of
Fig 16. NOAA image at 15:51 on 10 July 2001 Japan Group for the Study of Natural Disaster, No.25, pp.
145-148, 2001 (in Japanese).
[3] M. Koyamada, K. Kinoshita, N. Iino and C. Kanagaki,
Flow of volcanic clouds and gas from Miyakejima and
satellite image analysis II - October-December 2000 - ,
Proc. 30th Japanese Conf. Rem. Sens., pp.57- 60, 2001
(in Japanese with English abstract).
[4] M. Koyamada and K.Kinoshita, Satellite detection of
Miyakejima plumes and the gas concentration at the foot
of the volcano, Programs and Abstracts, Volcanol.Soc.,
Japan, 2001, p.25 (in Japanese).
[5] M.Urai, Volcano activity observed by early ASTER
operation, Programs and Abstracts, Volcanol.Soc., Japan,
2001, p.47 (in Japanese).
Fig 17. NOAA image at 07:27 on 14 August 2001 [6] Kaneko.T, Yasuda.A, Ishimaru.T and Tahagi.M, Thermal
ingrared analysis of the Miyakejima 2000-2001 activity
4. Concluding remarks using Programs and Abstracts, Volcanol.Soc., Japan, 2001,
We were able to detect the volcanic ash clouds p.34 (in Japanese).
at Sakurajima by the difference images of AVHRR [7] Atmospheric Environmental Regional Observation
4 and 5. The same method did not work for the System: http://w-soramame.nies.go.jp/ (in Japanese).
clouds at Miyakejima containing less silicate. The [8] K. Kinoshita, N. Iino, I. Uno, A. Mori and J. Kohno Day
difference images of AVHRR 1 and 2 were found to and night detection of volcanic clouds and aerosol by
be effective to discriminate Miyakejima plumes NOAA/AVHRR data CEReS Int. Symp. on the
from meteorological clouds. The AVHRR images of Atmospheric Correction of Satellite Data and its
them are consistent with the high concentration Application to Global Environment, Chiba, Japan, pp.
events of SO2 at leeward directions. Many images 37-44 1998.
that we analyzed here are shown in the following See also the papers in Flow and Dispersion of Volcanic
homepage. SiNG: http://www-sci.edu.kagoshima-u. Clouds, ed. K.Kinoshita, Kagoshima Univ., 2001.
ac.jp/sing/index-e.htm [9] N. Iino, K. Kinoshita, M. Koyamada, S. Saitoh, K.
Maeno and C. Kanagaki, Satellite imagery of ash clouds
Acknowledgments of Miyakejima Volcano, Proc.CEReS International Symp,
This work is partially supported by the Grant of on Remote Sensing of the Atmosphere and Validation of
the Japan Science and Technology Corporation. The Satellite date, Chiba, Japan, p.13-18.
source data of NOAA/AVHRR were obtained at theYou can also read