BOUNDLESS IOT INVESTOR PRESENTATION FIRST QUARTER 2021 - SEE WHAT'S POSSIBLE WHEN EVERY_THING IS CONNECTED TO THE DIGITAL WORLD

Page created by Tommy Hall
 
CONTINUE READING
BOUNDLESS IOT INVESTOR PRESENTATION FIRST QUARTER 2021 - SEE WHAT'S POSSIBLE WHEN EVERY_THING IS CONNECTED TO THE DIGITAL WORLD
Boundless IoT
See what’s possible when every_thing
is connected to the digital world

Investor Presentation
First Quarter 2021

                                       © 2021   1
BOUNDLESS IOT INVESTOR PRESENTATION FIRST QUARTER 2021 - SEE WHAT'S POSSIBLE WHEN EVERY_THING IS CONNECTED TO THE DIGITAL WORLD
Safe Harbor Statement

This presentation and the accompanying oral commentary contain forward-             This presentation also contains statistical data, estimates and forecasts that
looking statements within the meaning of the Private Securities Litigation          are based on independent industry publications or reports or other publicly
Reform Act of 1995. All statements other than statements of historical fact         available information, as well as other information based on our internal
could be deemed forward-looking, including, but not limited to, any statements      sources. This information involves a number of assumptions and limitations,
about expectations, projections, trends, plans, ambitions, strategies, and          are subject to risks and uncertainties, and are subject to change based on
objectives of management for the future; potential markets or market size,          various factors, including the potential impact of the Covid-19 pandemic and
technology or business developments, enforceability of our intellectual             the those discussed in the “Risk Factors” section and elsewhere in our most
property rights or our position within the industry; the expected or potential      recent SEC filings on Forms 10-K and 10Q. These and other factors could
impact of Covid-19 on our business, operating results, financial condition or       cause results to differ materially from those expressed in the estimates made
prospects and the actual, expected or potential responses of government             by the independent parties and by us.
authorities, customers, partners and the company to Covid-19; and any
statements of assumptions underlying any of the foregoing. Forward-looking          In addition to our results determined in accordance with generally accepted
statements are also based on estimates and information available to us at the       accounting principles (“GAAP”), this presentation includes certain non-GAAP
time of this presentation and are not guarantees of future performance.             financial measures. These non-GAAP financial measures are in addition to,
Forward-looking statements are subject to significant risks, uncertainties and      and not as a substitute for or superior to measures of financial performance
assumptions. Actual results could differ materially from our current                prepared in accordance with U.S. GAAP. There are a number of limitations
expectations as a result of many factors, including those identified in the “Risk   related to the use of these non-GAAP financial measures versus their nearest
Factors” section and elsewhere in our most recent filings on Forms 10-K and         GAAP equivalents. See the appendix for a reconciliation of those measures to
10-Q filed with the Securities and Exchange Commission (SEC). If the risks or       the most directly comparable GAAP measures.
uncertainties ever materialize or the assumptions prove incorrect, our results
may differ materially from those expressed or implied by such forward-looking
statements. Except as required by law, we assume no obligation and do not
intend to update these forward-looking statements or to conform these
statements to actual results or to changes in our expectations.

                                                                                                                                                       © 2021        2
BOUNDLESS IOT INVESTOR PRESENTATION FIRST QUARTER 2021 - SEE WHAT'S POSSIBLE WHEN EVERY_THING IS CONNECTED TO THE DIGITAL WORLD
Impinj at a Glance

                                 • Massive             Revenue (M)                          $152.8
                                                                                                     $138.9
                                   opportunity
                                                                         $125.3   $122.6
                                 • Extending the IoT            $112.3
                                   to everyday items
                                                        $78.5

                                                        2015    2016      2017    2018        2019   2020

                                                                     12.1% CAGR 2015 – 2020

   • Integrated platform for        50+ Billion        Pioneer and leader in               292+
     item connectivity              Items                                                  Patents Issued
   • Market leadership at           Connected(1)                                           and allowed(2)
     every platform layer
   • Blue chip end users
     across multiple verticals
(1) As of February 10, 2021
(2) As of December 31, 2020

                                                                                                     © 2021   3
BOUNDLESS IOT INVESTOR PRESENTATION FIRST QUARTER 2021 - SEE WHAT'S POSSIBLE WHEN EVERY_THING IS CONNECTED TO THE DIGITAL WORLD
Digital Life for
TRILLIONS
of everyday items                                                • 10m range
                                                                 • No battery
                                                                 • For pennies

• Connecting every thing to the cloud
• Expanding the Internet’s reach by a factor of 1,000
• Imagine the applications that can leverage that connectivity

                                                                                 Impinj © 2021   4
BOUNDLESS IOT INVESTOR PRESENTATION FIRST QUARTER 2021 - SEE WHAT'S POSSIBLE WHEN EVERY_THING IS CONNECTED TO THE DIGITAL WORLD
Inventory Visibility

Connecting Retail

Today
• Improving inventory visibility
• Increasing sales                                Omnichannel Fulfillment

• Enhancing efficiencies
• Visibility through entire fulfillment process

Opportunity
• 80 billion apparel items annually(1)
• RAIN-enabled exit gates
• RAIN self-checkout terminals                    Self-Checkout & Loss Prevention

• RAIN-enabled handhelds

(1)   Based on Impinj internal estimates

                                                                                    Impinj©©2021
                                                                                             2021   5
BOUNDLESS IOT INVESTOR PRESENTATION FIRST QUARTER 2021 - SEE WHAT'S POSSIBLE WHEN EVERY_THING IS CONNECTED TO THE DIGITAL WORLD
Pallet Tracking

Connecting
Supply Chain & Logistics
Today
• Enabling real-time visibility
• Virtualizing operations
• 25% efficiency gain loading trailers(1)

Opportunity
                                                                                                                     Package Sortation
• >9 billion pallets globally(2)
• >220 billion parcels globally(3)
• Millions of RAIN read points(4)
• Automating contract fulfillment

(1)   Supply chain executive at global retailer
(2)   IMARC Group, “Pallet Market: Global Industry Trends, Share, Size, Growth, Opportunity and Forecast 2019-2024
(3)   Pitney Bowes Parcel Shipping Index, October 2020
(4)   Based on Impinj internal estimates

                                                                                                                                         Impinj © 2021   6
BOUNDLESS IOT INVESTOR PRESENTATION FIRST QUARTER 2021 - SEE WHAT'S POSSIBLE WHEN EVERY_THING IS CONNECTED TO THE DIGITAL WORLD
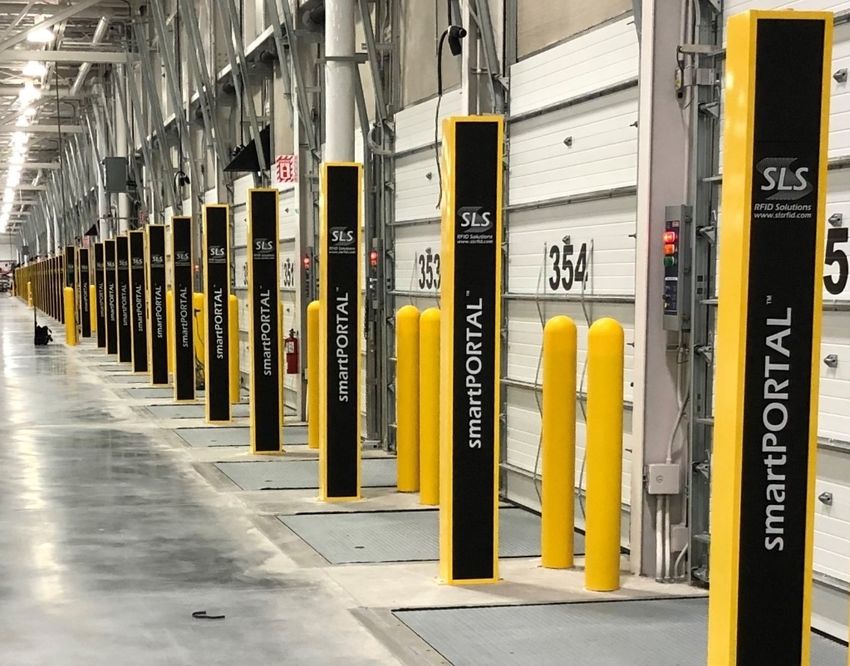
Connecting Every Thing
                                                                                                                                                     Other Everyday Items

                                                                                                                                                     3Tn(2)                 Food & Drink Packaging

                                                                                                                                                     600Bn(2)               Auto Parts

RAIN enabled connectivity                                                                                                                            400Bn(2)               Parcels & Postal
for >21Bn(1) items in 2020
                                                                                                                                                     80Bn(2)                Apparel
We estimate only ~0.2%
of connectable items                                                                                                                                 7Bn(2)                 Pallets
are connected today                                                                                   Trillions of
                                                                                                     consumable                                      4Bn(2)                 Airline Baggage
                                                                                                   items per year
                                                                                                                                                     3Bn(2)                 Tires

                                                                                                                                                                                                                                      Time
(1) RAIN RFID Alliance, “RAIN RFID Tag IC 2020 Sales Volume Cracks 20 Billion,” March 9, 2021
(2) Food Packaging and Caps & Lids based on Euromonitor International, “Global Trends in Food and Drink Packaging, 2017”. Impinj estimate of Auto Parts based on Statista, “Global Car Sales 1990–2019” and “Automotive Industry & Reach,”
    Timo Unger. Postal based on Universal Postal Union, “Postal economic outlook 2020” and Pitney Bowes Parcel Shipping Index, October 2020. Impinj estimate of taggable apparel items based on Statista Market Forecast Apparel – worldwide,
    March 2019. Pallets based on iMarc, “Pallet Market Size, Share, Growth, Analysis and Forecast 2025.” Airline Baggage based on IATA and SITA, “RFID for Baggage Tracking, Business Case 2017.”
    Tires based on Freedonia, “Global tire demand.”

                                                                                                                                                                                                                              © 2021            7
BOUNDLESS IOT INVESTOR PRESENTATION FIRST QUARTER 2021 - SEE WHAT'S POSSIBLE WHEN EVERY_THING IS CONNECTED TO THE DIGITAL WORLD
Sample End User Deployments

(1)   Significant RAIN end users; may not all be Impinj customers

                                                                    © 2021   8
BOUNDLESS IOT INVESTOR PRESENTATION FIRST QUARTER 2021 - SEE WHAT'S POSSIBLE WHEN EVERY_THING IS CONNECTED TO THE DIGITAL WORLD
Mission: Connect Every Thing
Our products bring all things online

  Endpoint ICs               Reader Chips

  Readers & Gateways         Reader Software
                                               Link items
                                               to cloud

                                                            Impinj © 2021   9
BOUNDLESS IOT INVESTOR PRESENTATION FIRST QUARTER 2021 - SEE WHAT'S POSSIBLE WHEN EVERY_THING IS CONNECTED TO THE DIGITAL WORLD
Technology

       RAIN = RAdio IdentificatioN
         Unique ID: for pennies per endpoint IC
         Fast: up to 1,000 items/sec @ 10m
         Autonomous: without line-of-sight
         Battery-free: essentially unlimited life
         Worldwide: spectrum, standards & ecosystem

Complementary IoT Technologies

    Items       Beacons        Internet      Payment   People

                                                                Impinj © 2021   10
Go-to-Market                                  A few of our hundreds of partners

We sell to, with and through partners
Software: enabler for system sales
Gateways: thousands for $1,000s apiece
Readers: tens of thousands for $100s apiece
Reader ICs: millions for $10s apiece
Endpoint ICs: billions for pennies apiece
Partners drive our solutions to market

                                                                       Impinj © 2021   11
Why Impinj

Industry leader with global brand                    50+ Billion                   (1)
• Integrated platform                                endpoint ICs sold

• Product quality & reliability                      3+ Million                              (1)
• Technology innovator & thought leader              connectivity devices sold
• Market leader across all product lines             292+ Patents                    (2)
                                                     issued and allowed
                          Impinj       NXP   Zebra
Whole platform

Endpoint ICs

Readers

Reader Software
                                                     (1) As of February 10, 2021
                                                     (2) As of December 31, 2020

                                                                                           Impinj © 2021   12
Financial Highlights

Annual Revenue ($M)                                                      Quarterly Revenue ($M)(1)
                                                                                                                           Endpoint ICs
                                                  152.8                                                                    Systems
                                                          138.9                                        47.8
                                                                                                                                   45.2
                                 125.3    122.6                                          40.8 40.8
                      112.3                                                       38.2                                    36.4     7.2
                                                                           33.1                        14.1
                                                                                         14.4                             7.9
    78.5                                                                          14.5          15.1          26.5 28.2
                                                                           11.2
                                                                                                                    6.6
                                                                                                               7.9
                                                                                                                                   38.1
                                                                                                       33.7
                                                                           21.8 23.7 26.4 25.7                       21.6 28.5
                                                                                                              18.5

    2015              2016       2017     2018    2019    2020            1Q19 2Q19 3Q19 4Q19 1Q20 2Q20 3Q20 4Q20 1Q21

                                         Systems is the platform’s reader ICs, readers, and gateways
(1) Variations due to rounding

                                                                                                                                 © 2021   13
Financial Highlights

Non-GAAP Gross Margins(1)                                                                                                   Non-GAAP R&D ($M)(1)
                         51.4%
                                                                   50.4%                50.3%                                                               10.1   10.3
                                              50.1%                                                                                                  9.4
                                                                                                                                        8.5   8.6
                 (2)
   46.1%

    1Q20                  2Q20                 3Q20                 4Q20                 1Q21                                       1Q20      2Q20   3Q20   4Q20   1Q21

(1) Excludes depreciation and stock-based compensation. See appendix for reconciliation to the most directly comparable GAAP measures
(2) 560 basis point excess and obsolescence charge included in the 1Q20 non-GAAP Gross Margin of 46.1%

                                                                                                                                                                   © 2021   14
Financial Highlights

Quarterly Adjusted EBITDA ($M)(1)                                                                                                 Free Cash Flow ($M)(2)
                                                                                                                                                                                     5.0
         3.0
                                                                                                      0.9                                  0.7                0.8

                                                                            -3.1                                                                                             -4.1
                                -5.2
                                                       -6.2

                                                                                                                                                                     -12.1
  1Q20                    2Q20                   3Q20                   4Q20                    1Q21                                     1Q20                 2Q20   3Q20    4Q20   1Q21

(1) Excludes stock-based compensation and settlement and related costs. See appendix for reconciliation to the most directly comparable GAAP measures
(2) Free cash flow is a non-GAAP measure and is calculated as net cash provided by (used in) operating activities adjusted for net cash paid for settlement
    and related costs less purchases of property and equipment. See appendix for reconciliation to the most directly comparable GAAP measures

                                                                                                                                                                                    © 2021   15
Financial Highlights

• $213.5M(1) federal NOLs
• $119.3M(2) cash and investments
• $84.0M(2) in long-term debt
• Scalable, asset-light manufacturing model

(1)   As of December 31, 2020
(2)   As of March 31, 2021, $84.0M current portion of long-term debt

                                                                       Impinj © 2021   16
Our Strategy

   Drive RAIN         Invest in      Enable ubiquitous    Deliver cloud
    adoption         our platform        reading            services

  We succeed when our platform is the engine of our partners’ success

                                                                     © 2021   17
Team

           Chris Diorio, Ph.D.           Cary Baker            Jeff Dossett
       CEO, Vice-Chair, Co-Founder          CFO                    CRO
          30 Years' Experience       20 Years' Experience   25 Years' Experience

            Hussein Mecklai            Yukio Morikubo           John Quist
            EVP Engineering            General Counsel        SVP Operations
                                     30 Years' Experience
          20 Years' Experience                              30 Years' Experience

                                                                                   © 2021   18
Impinj Highlights

Massive market with     Technology pioneer with    Blue chip end customers
~0.2% items connected   multiple industry firsts   across multiple verticals

Market leadership       Industry-leading           Strong, global team and
across the platform     patent portfolio           broad partner ecosystem

                                                                       © 2021   19
Join Us On
Our Journey

Expanding the
Internet’s reach to

Trillions
of everyday items

                      Impinj © 2021   20
Appendix
GAAP to Non-GAAP Reconciliations
GAAP to Non-GAAP Reconciliation
                                                     2020                   2021

                                      Q1      Q2             Q3      Q4      Q1

GAAP Gross Margin                    44.7%   49.0%          47.4%   47.8%   48.6%

 Adjustments:

 Depreciation                        1.0%    1.7%           1.9%    1.4%    1.1%

Stock-based compensation             0.4%    0.7%           0.8%    1.2%    0.6%

Non-GAAP Gross Margin                46.1%   51.4%          50.1%   50.4%   50.3%

GAAP Research and development ($M)   11.1    10.7           11.9    15.0    13.8

 Adjustments:

 Depreciation                        (0.5)   (0.5)          (0.4)   (0.4)   (0.3)

Stock-based compensation             (2.0)   (1.6)          (2.1)   (4.6)   (3.1)

Non-GAAP Research and development     8.5     8.6            9.4    10.1    10.3

                                                                            © 2021   22
GAAP to Non-GAAP Reconciliation(1)
                                                                                  2020                     2021
                                                                 Q1       Q2              Q3       Q4       Q1
GAAP Net Loss                                                    (4.3)   (17.5)          (14.3)   (15.7)   (9.4)
Adjustments:
 Depreciation                                                    1.2      1.1             1.1     1.1      1.0
 Stock-based compensation                                        5.2      4.6             5.7     10.2     7.5
 Restructuring costs                                              --       --              --      --      1.3
 Settlement and related costs                                     --      5.4              --      --       --
 Other Income, net                                               (0.4)   (0.1)            (0.0)   (0.1)    (0.0)
 Interest expense                                                 1.3     1.3              1.4     1.4      0.5
 Income tax benefit (expense)                                     0.0     0.0              0.0     0.0      0.0
Adjusted EBITDA                                                   3.0    (5.2)            (6.2)   (3.1)     0.9
Net cash provided by (used in) operating activities               1.8     1.0            (16.4)   (3.3)     9.4
 Cash paid for settlement and related costs                        --      --              5.4      --       --
  Adjusted net cash provided by (used in) operating activities
                                                                  1.8     1.0            (11.0)    (3.3)    9.4
 Purchases of property and equipment                             (1.1)   (0.1)            (1.1)    (0.7)   (4.4)
Free cash flow                                                    0.7     0.8            (12.1)    (4.1)    5.0
Net cash provided by (used in) investing activities              13.1    11.9            (42.9)   (18.3)    8.3
Net cash provided by (used in) financing activities               1.9     0.9              1.8      5.2     8.5
(1)   Variations due to rounding

                                                                                                           © 2021   23
You can also read