INTERIM RESULTS PRESENTATION - Strong start to the year, with a strong order book for the second half of 2017 11 September 2017 - Luceco PLC
←
→
Page content transcription
If your browser does not render page correctly, please read the page content below
INTERIM RESULTS PRESENTATION
 Strong start to the year, with a strong order
            book for the second half of 2017
                          11 September 2017
Luceco plc | Interim results presentation 2017
AGENDA
Introduction and highlights John Hornby
Financial review David Main
Strategic progress and outlook John Hornby
Questions
1
Luceco plc | Interim results presentation 2017
INTRODUCTION
Who we are
Luceco is a rapidly growing manufacturer and distributor of
high quality, innovative LED lighting products and wiring
accessories supplying a global customer base. The Group
supplies the following market recognised brands:
Luceco: energy efficient LED Lighting
British General (BG): Wiring Accessories
Masterplug: Portable Power
Ross: TV brackets , AV Accessories
What we do
Luceco operates a fully integrated model, which includes
wholly-owned manufacturing and product development
facilities in the UK and China, that enables the Group to
maintain strong control over its cost base and the quality of
the products, while allowing new products to be brought to
market quickly and at lower cost.
2
Luceco plc | Interim results presentation 2017
H1 HIGHLIGHTS
Operational Financial
Strong revenue growth across all product Revenue increased for the first six months of the year by
categories 25.5% to £75.3m (H1 2016: £60.0m)
Consistent operating margins On a constant currency basis, revenue grew by 17.3%
Continuing expansion of Chinese Operating profit increased by 25.0% to £9.0m (H1 2016:
manufacturing capacity £7.2m)
Continuing investment in expanded sales Gross margin broadly unchanged at 35.0% ( H1 2016:
teams at all operations 35.3%)
Expansion of product ranges and a strong Basic and diluted EPS increased 42.8% to 4.0p per share
pipeline of new product launches (H1 2016: 2.8p per share)
Continued growth in International Strong balance sheet with net debt of £26.1m ( FY 2016:
businesses £29.4m)
Strong order book Interim dividend declared of 0.8p per share, which
represents 20% of profit after taxation for the first six-months
(H1 2016: £nil)
3
Luceco plc | Interim results presentation 2017

FINANCIAL HIGHLIGHTS

 Revenue                                                   Gross Profit                                  Gross Margin
 (£m)                                                      (£m)                                          (%)
                                                  75.3                                                                       35.3%     35.0%
                                                                                                             31.5%
                              60.0                                                              26.4
       48.0
                                                                                       21.2
                                                                15.1

                          CAGR 25.2%
                                                                                  CAGR 32.2%

     H1 2015                H1 2016              H1 2017      H1 2015             H1 2016      H1 2017      H1 2015         H1 2016   H1 2017

 EBITDA                                                    Adjusted operating profit                     Operating margin
 (£m)                                             10.8     (£m)                                  9.0     (%)
                               8.7                                                     7.2

        5.7                                                                                                                 12.0%     12.0%
                                                                 4.2                                         8.8%

                           CAGR 37.6%                                            CAGR 46.4%

     H1 2015                H1 2016              H1 2017      H1 2015             H1 2016      H1 2017      H1 2015         H1 2016   H1 2017

                                                                                                                                                4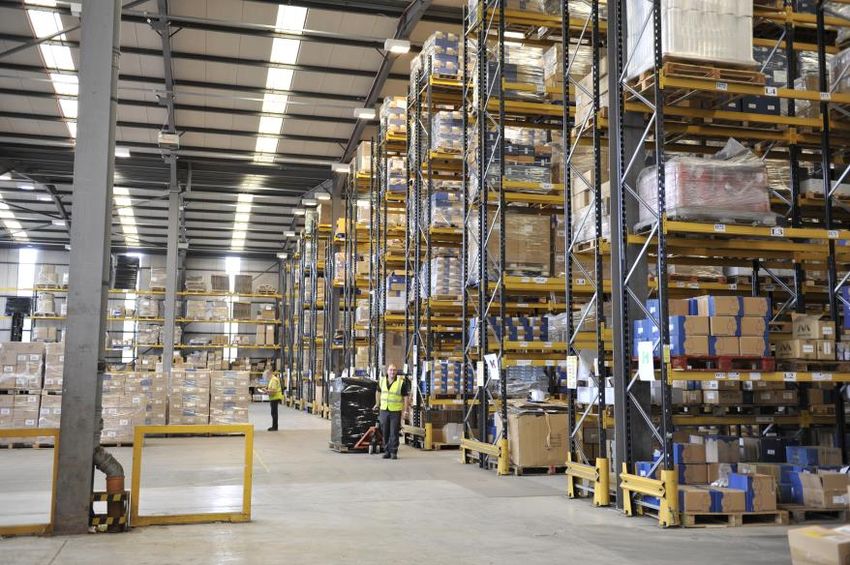
Luceco plc | Interim results presentation 2017

WELL POSITIONED FOR CONTINUED GROWTH

                                                 5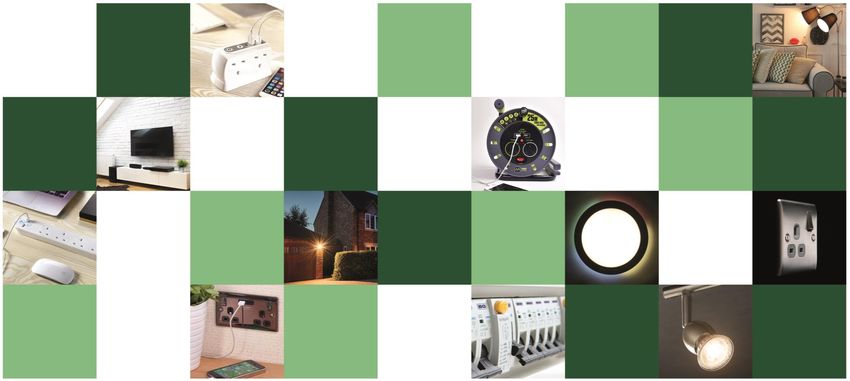
Luceco plc | Interim results presentation 2017

FINANCIAL OVERVIEW

                                                 6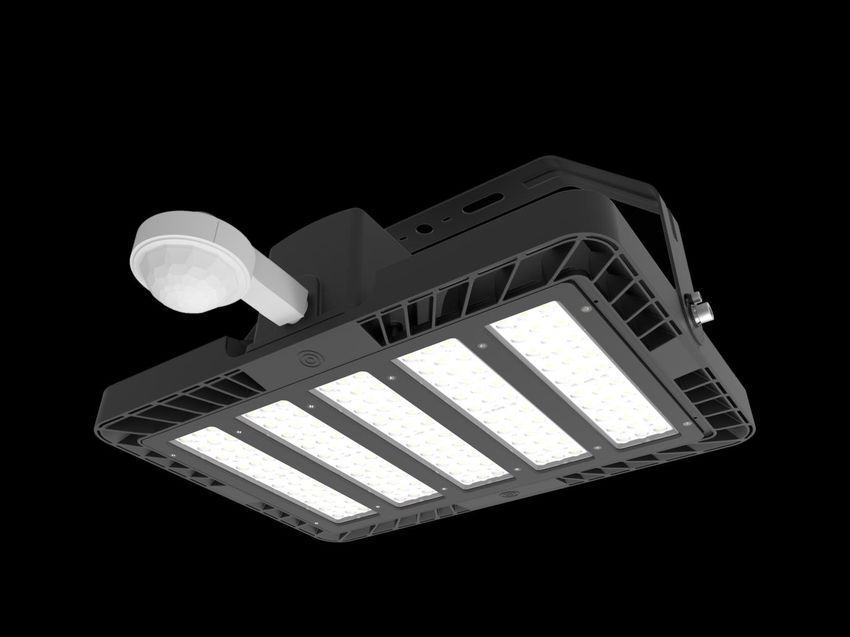
Luceco plc | Interim results presentation 2017
SUMMARY CONSOLIDATED INCOME STATEMENT
H1 H1 FY Chg '17
Revenue growth of £15.3m (25.5%),
£m 2017 2016 2016 v '16 Chg % £10.4m (17.3%) on a constant currency
basis
Revenue 75.3 60.0 133.8 15.3 25.5%
Gross profit 26.4 21.2 47.8 5.2 24.5% Gross margin reflects product mix
GM % 35.0% 35.3% 35.7%
Overheads spend remains consistent at
Fixed costs* (17.4) (14.0) (30.2) (3.4) 24.1%
% 23.1% 23.3% 22.6%
circa 23% of revenue
Adjusted operating profit 9.0 7.2 17.6 1.8 25.0%
Effective tax rate reduced from 25.2% to
% 12.0% 12.0% 13.2%
19.0% due to effective tax planning in H2
Exceptional IPO costs - - (2.6) -
Operating profit 9.0 7.2 15.0 1.8 25.0% 2016
% 12.0% 12.0% 11.2%
Adjusted profit after taxation & interest 6.5 4.0 12.3 2.5 62.5%
Basic and diluted EPS has increased by
% 8.6% 6.7% 9.2% 42.8% to 4.0p
Adjusted basic and diluted EPS (pence) 4.0p 2.8p 8.5p 1.2p 42.8%
Adjusted EBITDA 10.8 8.7 20.8 2.1 24.1%
% 14.3% 14.5% 15.5%
7
Luceco plc | Interim results presentation 2017
PROFIT AFTER TAX BRIDGE
0.7m
5.4m
(0.2m)
(1.6m)
6.5m
(1.8m)
4.0m
H1 2016 Volume Interest and tax Product mix Overhead Investment H1 2017
growth in growth
(Sales and
Marketing)
Strong revenue and gross profit growth despite on-going investment in sales and marketing to support the Group’s
future growth strategy
Currency fluctuations, increased sales activity and inflation has impacted overheads expenditure
Reduced net debt from year end 2016 has benefitted the Group interest costs
Improved effective tax rate in H1 2017
Investment for future growth
8
Luceco plc | Interim results presentation 2017
NET DEBT BRIDGE
(29.4m)
(26.1m)
(3.6m)
(1.7m)
9.0m (0.7m)
(0.6m)
(0.5m)
1.8m (0.4m)
Dec 2016 Operating Depn & Tax paid Dividend Mvt in NWC FX Financing CAPEX June 2017
profit amortn paid
Reduced NWC outflow versus H1 2016 and full year 2016
Capex investment to support continued growth as we expand our product ranges
Full year 2016 dividend paid in H1 2017
FX: being FX impact on debt, cash and cash equivalents
Dividend paid is the approved 2016 full year dividend
Financing relates to repayment of borrowings
9Luceco plc | Interim results presentation 2017
SEGMENTAL PERFORMANCE
LED lighting Wiring accessories
17.0m
34.9m
13.9m 30.7m
1.5m 1.0m 5.5m
4.9m
Revenue £m Op profit £m Revenue £m Op profit £m Revenue £m Op profit £m Revenue £m Op profit £m
H1 2017 H1 2016 H1 2017 H1 2016
Revenue up 22.4% to £17.0m (constant currency 26.2%) Revenue up 13.6% to £34.9m (constant currency 6.9%)
Operating profit up 48.5% to £1.5m Operating profit up 12.6% to £5.5m
Operating margin up 1.5% to 8.9% Operating margin down 0.1% to 15.8%
Revenue growth follows the expansion of the product range and the Revenue growth is due to general market share gains
decision to move more production in-house
10Luceco plc | Interim results presentation 2017
SEGMENTAL PERFORMANCE
Portable Power Ross and other
20.2m
3.2m
13.3m
2.1m
1.6m 0.3m
1.0m 0.2m
Revenue £m Op profit £m Revenue £m Op profit £m Revenue £m Op profit £m Revenue £m Op profit £m
H1 2017 H1 2016 H1 2017 H1 2016
Revenue up 52.2% to £20.2m (constant currency 30.6%) Revenue up 51.5% to £3.2m (constant currency 33.3%)
Operating profit up 57.8% to £1.6m Operating profit up 57.0% to £0.3m
Operating margin up by 0.2% to 7.8% Operating margin up 0.3% to 10.7%
Revenue growth due to significant new business wins with Revenue increase due to re-engineering the product range
major customers in the UK, Europe and Americas to reduce product costs
11Luceco plc | Interim results presentation 2017
SUMMARY CONSOLIDATED BALANCE SHEET
H1 H1 FY Chg '17
£m 2017 2016 2016 v '16 Chg %
Non-current assets Continuing innovation and product
Intangible assets 13.7 12.4 12.9 1.3 10.5%
Tangible assets 21.0 19.3 20.6 1.7 8.8%
development both in the UK and China
Deferred tax 0.1 - 0.2 0.1 -
34.8 31.7 33.7 3.1 9.8% NWC remains consistent with the year
Current assets end position as stock and cash
Stock 40.0 34.3 38.5 5.7 16.6%
Debtors 29.3 29.7 29.3 (0.4) -1.3%
collection is continued to be managed
Cash 6.4 3.6 4.1 2.8 77.8% efficiently
75.7 67.6 71.9 8.1 12.0%
Stock increase a function of volume
Creditors < 1 year (55.7) (66.6) (55.2) 10.9 -16.4%
growth
Creditors > 1 year (12.1) (25.5) (12.1) 13.4 -52.5%
Group continues to progress its cash
Net assets 42.7 7.2 38.3 35.5 conversion of operating profit to further
NWC 33.3 26.5 33.9 6.8 25.7% reduce the net debt
Net debt (26.1) (47.9) (29.4) 21.8 -45.5%
Stock days 144 145 145
Debtor days 58 68 68
Creditor days 96 97 97
12Luceco plc | Interim results presentation 2017
SUMMARY CONSOLIDATED CASH FLOW
Chg Effective management of NWC has
H1 H1 FY '17 v
further enhanced the cash flow for the
£m 2017 2016 2016 '16 Chg %
Operating profit* 9.0 7.2 15.0 1.8 25.0%
Group thus slowly reducing the net debt
Depn and amortisation 1.8 1.5 3.2 0.3 20.0%
Mvt in NWC (0.6) (3.3) (11.6) 2.7 -81.8%
Acquired tangible fixed assets
NCF from operations 10.2 5.4 6.6 4.8 88.9% amounting to £2.4m (H1 2016: £4.2m)
relating to new product tooling and
Exceptional IPO costs - - (2.6) -
Tax paid (0.4) (0.2) (1.3) (0.2) 100.0% capacity expansion and improvement
CAPEX (3.6) (6.3) (7.7) 2.7 -42.9%
of the manufacturing process at the
Dividends paid (0.5) - - (0.5)
Financing (2.7) (1.3) 4.2 (1.4) 107.7% Groups manufacturing facility in China
Exchange rate flucuations (0.7) 1.2 0.1 (1.9) -158.3%
Net cash flow 2.3 (1.2) (0.7) 3.5 -291.7% CAPEX also includes internally
generated development costs of £1.2m
Net funds
Opening 4.1 4.8 4.8 (0.7)
Exchange rate fluctuations in China has
Closing 6.4 3.6 4.1 2.8
materially affected the Group’s cash
Net debt (26.1) (47.9) (29.4) 21.8 -45.5% position
EBITDA 10.8 8.7 20.8 2.1 24.1% The Group continues to purchase
Net debt/LTM EBITDA 1.1x 2.8x 1.4x forward contracts to mitigate the FX rate
*Stated post exceptional IPO costs for 2016
risk
13Luceco plc | Interim results presentation 2017
REVENUE BY GEOGRAPHY
– UK revenues have grown strongly, increasing 22.2%
H1 H1 Chg '17 Chg during the year to £62.8m (H1 2016: £51.3m). This
£m 2017 2016 v '16 % growth has been driven by the full period impact of
UK 62.8 51.3 11.5 22.2% significant new business wins in 2016 and successful
new product launches in H1 2017 along with continuing
Europe 4.1 2.5 1.6 67.6%
market share gains
MEA 2.8 3.3 (0.5) -15.9%
Asia 2.5 1.3 1.2 95.7%
– International revenues have grown by 45.3% to £12.5m
Americas 2.5 0.9 1.6 177.8%
(H1 2016: £8.6m) as Luceco’s international presence
Africa 0.6 0.7 (0.1) -7.7%
gains momentum and now represents 16.6% of total
Total revenue 75.3 60.0 15.3 25.5% revenues (H1 2016: 14.3%)
14Luceco plc | Interim results presentation 2017
STRATEGIC PROGRESS
15Luceco plc | Interim results presentation 2017
OVERVIEW
Established routes to
market
– Highly regarded UK business; quality
blue-chip customer base
– Expanding UK and International sales
networks; well placed for LED growth
opportunity
Fully integrated model
– Wholly-owned Chinese manufacturing with
local know-how and expertise
– High quality, low-cost manufacturing;
supply chain and product development
functions aligned to client needs
Rapid growth in the
LED market
– Well positioned to continue impressive
organic growth trajectory
– Consolidation opportunities in a fragmented
market
– Total global market opportunity of US$70
billion by 2019; UK market £1.2 billion by
2019Luceco plc | Interim results presentation 2017
STRATEGIC UPDATE
Expansion of product range to deliver growth in revenue
and profits
– Strong new product launches in the period, especially within the LED
category
– Strong pipeline of new product launches into H2 and beyond
– Internationalisation of the Masterplug and BG categories.
Increase in market share in LED products (Luceco)
– LED projects team expanded in UK and Internationally
– LED UK market share < 5%
– Increased investment in the International ‘start-ups’
Increase in UK market share of established core brands BG and
Masterplug
– Both UK market leading brands increased market share in H1.
– New business wins for BG including UK house-builders.
– New significant retail customer wins for Masterplug.
– Launch of the improved Masterplug range.
17Luceco plc | Interim results presentation 2017
STRATEGIC UPDATE
Develop international sales for all product
offerings
– New offices, which began trading in Hong Kong and Spain in 2016,
have gained momentum in the six month period
– USA and Mexico gain increased market penetration
– Germany and France also showing strong growth
Targeted acquisitions
– The Board continues to identify acquisition targets that would
strengthen the Group’s strategic and market position to drive long term
shareholder value
– Targets will enhance the Group’s market access
– Strict acquisition criteria will be applied before approving any
such acquisition
Improve conversion of profit to cash
– Group continues to improve working capital management and cash
flow
– Net debt has reduced since year end to £26.1m
18Luceco plc | Interim results presentation 2017
H1 2017 SUMMARY
Ongoing growth in the manufacturing Successful new product launches New business wins key driver to growth both Continued growth in all Brands, particular
facility and supply chain domestically and internationally LED Lighting
Strong revenue growth across all product categories
Consistent operating margins
Continuing expansion of Chinese manufacturing capacity
Continuing investment in expanded sales teams at all operations
All geographical divisions
Continued growth in international businesses performing to
management expectations
Strong order book
Expansion of product ranges and a strong pipeline of new product launches
Strong balance sheet to support future investment both organically and M&A opportunities
The Board expects that the Group’s full year results will be in line with market expectations
Luceco remains well placed to deliver another strong year
of growth and profitability in line with its strategy
19Luceco plc | Interim results presentation 2017
DISCLAIMER
This presentation and information communicated verbally to you may contain certain projections and other forward-
looking statements with respect to the financial condition, results of operations, businesses and prospects of Luceco
plc. These statements are based on current expectations and involve risk and uncertainty because they relate to
events and depend upon circumstances that may or may not occur in the future. There are a number of factors which
could cause actual results or developments to differ materially from those expressed or implied by these forward-
looking statements.
Any of the assumptions underlying these forward-looking statements could prove inaccurate or incorrect and therefore
any results contemplated in the forward-looking statements may not actually be achieved. Nothing contained in this
presentation or communicated verbally should be construed as a profit forecast or profit estimate. Investors or other
recipients are cautioned not to place undue reliance on any forward-looking statements contained herein. Luceco plc
undertakes no obligation to update or revise (publicly or otherwise) any forward-looking statement, whether as a result
of new information, future events or other circumstances. Neither this presentation nor any verbal communication shall
constitute an invitation or inducement to any person to subscribe for or otherwise acquire securities in Luceco plc.
20You can also read