Oregon Lodging Tax Revenue Forecast, FY2021-FY2023 - February 2021

Page created by Earl Mcgee
 
CONTINUE READING
Oregon Lodging Tax Revenue Forecast, FY2021-FY2023 - February 2021
Oregon Lodging Tax Revenue
Forecast, FY2021-FY2023
February 2021
Oregon Lodging Tax Revenue Forecast, FY2021-FY2023 - February 2021
Overview

                      Statewide Lodging Tax History
                      Anatomy of a Recovery
                      Tourism Sector Forecasts
                      Travel Oregon Revenue Forecast

| Tourism Economics                                    2
Oregon Lodging Tax Revenue Forecast, FY2021-FY2023 - February 2021
Statewide Lodging Tax History
Oregon Lodging Tax Revenue Forecast, FY2021-FY2023 - February 2021
Lodging tax has increased sharply                   There is significant seasonality in the data
since the 2016 TLT rate increase                    as the summer months are stronger than
                                                    the winter months.

              Statewide lodging tax receipts by quarter
              Nominal dollars, millions                                    TLT decreased
               $16                                                          in July 2020
                                                           TLT increased
                                                            in Oct. 2016
               $14

               $12

               $10

                 $8

                 $6

                 $4

                 $2

                 $0
                   '05 '06 '07 '08 '09 '10 '11 '12 '13 '14 '15 '16 '17 '18 '19 '20 '21
              Source: Travel Oregon                            Calendar years
| Tourism Economics                                                                                4
Tourism seasonality has extra                               Rapid vaccine distribution could boost the
importance in 2021                                          vitally important summer season.

              Oregon room revenue, 2019
              Dollars, millions
              $300

              $250                                              $242 $245
                                                         $216
                                                                            $196
              $200                                $179                             $176
                                      $151 $156
              $150                                                                        $132
                              $114                                                               $107
                       $102
              $100

                $50

                  $0
                       Jan Feb Mar Apr May Jun                  Jul   Aug Sep Oct Nov Dec
              Source: Travel Oregon
| Tourism Economics                                                                                      5
TLT revenue has increased sharply                            While TLT revenue was trending positive in
over the past decade                                         FY2020, Q4 was impacted by COVID-19,
                                                             and TLT revenue ultimately fell 3% to $40.3
                                                             million.

              TLT revenue by year
               Nominal dollars, millions
               $45
                                            Actual annual revenue                    $41.6 $40.3
               $40                          Adj.* annual revenue
               $35
               $30
               $25         $11.6    $20.8

               $20
               $15
               $10
                 $5
                 $0
                      2006 2007 2008 2009 2010 2011 2012 2013 2014 2015 2016 2017 2018 2019 2020
              *assumes constant 1.8% TLT tax                                            Fiscal years
              Source: Travel Oregon
| Tourism Economics                                                                                    6
Anatomy of a Recovery
Where we are now                  After recovering half of losses, job gains
                                  have plateaued.

              US nonfarm payroll employment

| Tourism Economics                                                            8
Where we are headed               Employment should pick up over
                                  spring/summer.

              US employment recovery paths

| Tourism Economics                                                9
Wealthy households will drive the                  Wealthy households account for the
travel recovery                                    majority of travel spending and are the least
                                                   impacted by the current economic crisis.

              US employment recovery paths
                                                                    Households earning $100k+
                                                                    account for 24% of households…
                                                                    but 59% of leisure spending on
                                                                    lodging

                                                                    Unemployment rate (October):
                                                                     • Bachelor’s or higher: 4.2%
                                                                     • High school grad: 8.1%

                 Sources: Tourism Economics; BLS
| Tourism Economics                                                                                 10
Vaccine distribution will drive the   The more confidence consumers have in
recovery                              their safety, the more they will travel.

              US domestic business and leisure trips

| Tourism Economics                                                              11
Anatomy of a recovery                                Return to “normal” levels of travel will be a
                                                     multi-year effort (2023 or 2024), but some
                                                     markets will recover faster than others.

                          Initial recovery             Already occurring

                      •    Leisure
                      •    Especially drive

                                                                      Genuine recovery starting
                                          Secondary recovery
                                                                      in late 2021
                                      •      Essential business
                                      •      Small- and medium-size groups
                                      •      Regional international (intra-Americas, intra-Europe)

                                                          Final recovery              Starting in
                                                                                      2022
                                                      •     Long-haul international
                                                      •     Large events

| Tourism Economics                                                                                  12
Expectations for 2021

 • 2021 Q1
       • Difficult start to year. Concerted efforts to get disease under control

 • 2021 Q2-Q3
       • Vaccination programs make a meaningful impact
       • Leisure travel picks up headed into summer

 • 2021 Q4
       • Context for business travel and group events has normalized substantially.
       • Group and business travel returns (group demand recovering to about 20%-30%
         below 2019 levels in 2021Q4)

| Tourism Economics                                                                    13
Three snapshots of the travel                           Local is faring better than long-haul
landscape (1 of 3)

              Travel performance
              Year-over-year % change
                 40%

                 20%

                  0%
                                                                                 Auto trips (- 7%)

                -20%
                                                                                 Hotel room demand (-32%)
                -40%

                -60%                                                             Air pax (-64%)

                -80%

              -100%
                       Jan Feb Mar Apr May Jun Jul Aug Sep Oct Nov Dec Jan Feb

                Source: TSA, Arrivalist, STR
| Tourism Economics                                                                                         14
Three snapshots of the travel   The more rural, the better
landscape (2 of 3)

| Tourism Economics                                          15
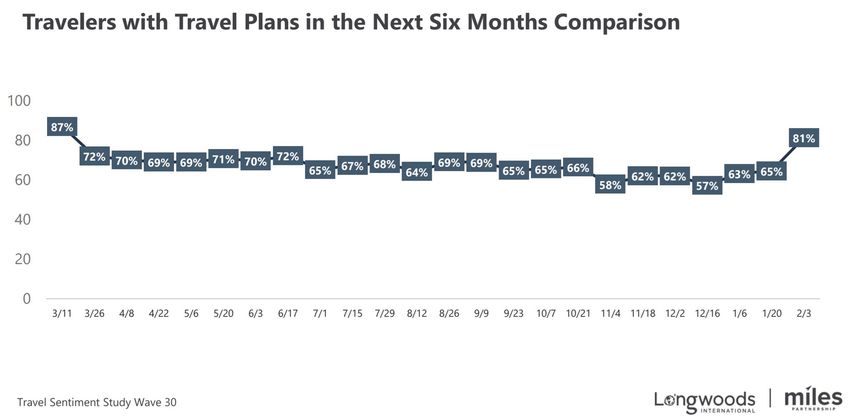
Three snapshots of the travel   Travel confidence remains low but is
landscape (3 of 3)              trending… up!

| Tourism Economics                                                    16
Tourism Sector Forecasts
A year of unprecedented losses will                    Room revenue will lag behind room
be followed by unprecedented                           demand during the recovery.
gains

              Growth in key hotel metrics in the US
              Index (2019=100)
              120                                  Demand
                                                   Room Revenue
              100

                80

                60
                                                          Room demand up 26%,
                                                          revenue up 32%
                40

                                Room demand down 35%,
                20
                                revenue down 49%

                  0
                        2019          2020      2021        2022       2023        2024
                                                                              Calendar years
              Sources: Tourism Economics; STR
| Tourism Economics                                                                            18
Th leisure sector will recover faster           Good news for leisure heavy states such as
than the business sector                        Oregon

              US domestic business and leisure trips

              Sources: Tourism Economics; STR
| Tourism Economics                                                                     19
The second half of the year will look    Vaccine distribution will push us towards
very different                           normalcy.

              Room demand

                                        Strong recovery in
                                        second half of 2021 to
                                        demand levels about
                                        15% below 2019.

| Tourism Economics                                                                  20
Travel Oregon Revenue Forecast
While the recovery will be a slow                    The worst appears to be behind us, and,
process, there are already favorable                 while currently in a health-related stall,
signs                                                room revenue is generally increasing.

              Change in room revenue, 2020
               Y/Y change                       Idaho           Added for perspective
                                                                of states recovering
                 20%                            New York        quickly and slowly
                                                Oregon
                                                United States
                      0%

                -20%

                -40%

                -60%

                -80%

              -100%

              Sources: Tourism Economics; STR
| Tourism Economics                                                                               22
Scenario drivers                                                                             We analyze three different recovery
                                                                                             scenarios.

                                                                                                                                                        Combined
             Virus-related inhibitions on travel in the first                  Key economic indicators                          Economic
 Scenario                                                                                                                                  Virus drag   impact to
             half of 2021                                                      (forecast current as of January 24th, 2020)        drag
                                                                                                                                                          travel
             • Virus moderately contained, travel restrictions continue to
                                                                               • National unemployment rate in Q4 2021 - 4.8%
             ease
 Upside      • Traveler risk aversion remains moderate to high through
                                                                               • National GDP grows 7.3% in 2021
             2021
                                                                               • GDP returns to 2019 Q4 level in 2021 Q2

             • Virus contained in some regions, however many restrictions
                                                                               • National unemployment rate in Q4 2021 - 5.7%
             and containment measures remain through 2021

 Baseline    • In some areas, groups permitted to meet with modifications,
                                                                               • National GDP grows 4.2% in 2021
             but risk aversion reduces attendance
                                                                               • GDP returns to 2019 Q4 level in 2021 Q3
             • Virus not well contained, many restrictions and many
                                                                               • National unemployment rate in Q4 2021 - 6.9%
             containment measures remain in place until the summer
 Downside    • Very limited group travel, greater risk aversion, many public
                                                                               • National GDP grows 0.2% in 2021
             places closed/limited, restaurants more limited
                                                                               • GDP returns to 2019 Q4 level in 2022 Q1

| Tourism Economics                                                                                                                                            23
Key factors driving Oregon’s               Compared to the US, Oregon has several
forecast                                   factors that indicate the state will recover
                                           faster than the nation.

         Positives                         Negatives
         Favorable market mix              Oregon may reopen more
             •   High leisure share        cautiously than the rest of the
             •   High drive share
             •   High transient share
                                           country
             •   High domestic share

         Numerous attractions that allow
         for social distancing (hiking,
         parks, etc.)

         West coast source markets will
         recover faster economically

| Tourism Economics                                                                       24
Room revenue losses will be                                 In our baseline forecast, room revenue in
massive and persistent                                      2022 is still down 21% from its 2019 level.

              Lost room revenue in Oregon
               Percent losses compared to 2019

                      0%

                -20%

                -40%

                -60%
                                                                                       Upside
                -80%                                                                   Baseline
                                                                                       Downside
               -100%
                           J FMAM J J A SOND J FMAM J J A SOND J FMAM J J A SOND J FM
                                 2020                       2021                2022          2023
              Sources: Tourism Economics; STR; Oregon DoR
| Tourism Economics                                                                                       25
This decline is much worse than the                         The COVID-19 pandemic will create a
previous two recessions                                     deeper and longer lasting impact than 9/11
                                                            or the 2008 financial crisis.

              Room Revenue declines in crises
              Index (crisis year = 100)
              110
                                                                                        USA - 2008
              100
                                                                                        USA - 2001
                90                                                                      Oregon Upside
                                                                                        Oregon Baseline
                80
                                                                                        Oregon Downside
                70
                60
                50
                40
                30
                      Pre-crisis year     Crisis year          Year+1             Year+2
                          (2019)            (2020)             (2021)             (2022)
                                            Calendar years, years for current crisis in parentheses
              Sources: Tourism Economics; STR; Oregon DoR
| Tourism Economics                                                                                       26
Our baseline model forecasts TLT                       We created a baseline model along with
revenues to reach $29 million in                       two other scenarios to create a range of
FY2022                                                 potential outcomes.

               TLT revenue growth in three scenarios
                               FY2019       FY2020 FY2021           FY2022      FY2023
                                           Revenue (millions)
               Upside           $41.6        $40.3     $21.4         $31.0       $33.9
               Baseline         $41.6        $40.3     $21.1         $29.1       $32.5
               Downside         $41.6        $40.3     $20.9         $25.9       $29.6
                                           Percent of FY2019
               Upside               --      96.9%     51.5%         74.6%       81.7%
               Baseline             --      96.9%     50.8%         70.0%       78.3%
               Downside             --      96.9%     50.3%         62.4%       71.2%
               Sources: Tourism Economics; STR; Oregon DoR

| Tourism Economics                                                                               27
Forecast details

TLT revenue growth in three scenarios
                               2019                                2020                           2021                        2022                         2023
                 Q1          Q2    Q3              Q4    Q1      Q2    Q3      Q4       Q1     Q2      Q3    Q4     Q1      Q2    Q3      Q4     Q1      Q2    Q3      Q4
                                                                                      Revenue (millions)
Upside         $11.7     $14.4     $7.9        $7.6     $11.3   $15.1   $8.2   $5.7    $4.0    $9.1   $3.6   $4.8   $7.9   $10.6   $6.6   $6.0   $9.1   $11.4   $7.1   $6.3
Baseline       $11.7     $14.4     $7.9        $7.6     $11.3   $15.1   $8.2   $5.7    $4.0    $9.1   $3.6   $4.5   $7.2   $10.0   $6.2   $5.7   $8.7   $11.0   $6.8   $6.1
Downside       $11.7     $14.4     $7.9        $7.6     $11.3   $15.1   $8.2   $5.7    $4.0    $9.1   $3.6   $4.3   $6.6    $8.8   $5.4   $5.1   $7.9    $9.9   $6.2   $5.5
                                                                                      Percent of FY2019
Upside   --             --        --          --        97%     105% 104%      75%     34%    63%     45%    63%    68%    74%     83%    78%    78%    80%     89%    83%
Baseline --             --        --          --        97%     105% 104%      75%     34%    63%     45%    59%    62%    70%     78%    75%    75%    76%     85%    80%
Downside --             --        --          --        97%     105% 104%      75%     34%    63%     45%    56%    57%    61%     68%    68%    68%    69%     78%    73%
Sources: Tourism Economics; STR; Oregon DoR

 Note: These numbers are based on the Department of Revenue’s posting date for
 TLT revenue, So Q1 represents Travel Oregon’s fiscal quarter July-September,
 but is based on TLT collected in April-June.

| Tourism Economics                                                                                                                                                     28
Final thoughts and a few positives

     1 Room demand and visitor spending will grow faster
            than room revenue
            This will aid stakeholders outside of the hotel sector.

     2 Oregon’s domestic market mix is encouraging
            High shares of leisure, drive, and transient visitors will boost Oregon’s recovery.

     3 Oregon’s international market mix is encouraging
            Canada and China will rebound faster than most other markets, but this will still
            be slower than the domestic recovery.

     4 The economic climate is improving
            Vaccinations are proceeding at a brisk pace, and despite the recent health
            related downturn, room revenue is generally increasing.

| Tourism Economics                                                                               29
About Tourism Economics

Tourism Economics is an Oxford Economics company with a singular
objective: combine an understanding of tourism dynamics with
rigorous economics in order to answer the most important questions
facing destinations, developers, and strategic planners. By combining
quantitative methods with industry knowledge, Tourism Economics
designs custom market strategies, destination recovery plans, tourism
forecasting models, tourism policy analysis, and economic impact
studies.
With over four decades of experience of our principal consultants, it is
our passion to work as partners with our clients to achieve a
destination’s full potential.
Oxford Economics is one of the world’s leading providers of economic
analysis, forecasts and consulting advice. Founded in 1981 as a joint
venture with Oxford University’s business college, Oxford Economics
enjoys a reputation for high quality, quantitative analysis and
evidence-based advice. For this, it draws on its own staff of more than
120 professional economists; a dedicated data analysis team; global
modeling tools, and a range of partner institutions in Europe, the US
and in the United Nations Project Link. Oxford Economics has offices
in London, Oxford, Dubai, Philadelphia, and Belfast.

For more information:
info@tourismeconomics.com

| Tourism Economics                                                        30
You can also read