RESEARCH OF POSSIBILITIES TO ENSURE THE QUALITY OF DERMATO-COSMETIC AND COSMETIC PRODUCTS THROUGH APPLICATION OF MODERN QUALITY MANAGEMENT TOOLS ...
←
→
Page content transcription
If your browser does not render page correctly, please read the page content below
246                                                          FARMACIA, 2011, Vol.59, 2

          RESEARCH OF POSSIBILITIES TO ENSURE THE
          QUALITY OF DERMATO-COSMETIC AND
          COSMETIC PRODUCTS THROUGH
          APPLICATION OF MODERN QUALITY
          MANAGEMENT TOOLS
          MONICA VUŞCAN1, MARIUS BOJIŢĂ2
          1 - S.C. Farmec S.A., 16 Henri Barbusse St., 400616, Cluj- Napoca,
          Romania
          2 - University of Medicine and Pharmacy ’’Iuliu Haţieganu ", 400349,
          Cluj-Napoca, Romania
          *corresponding author: monicavuscan2002@yahoo.com
           Abstract
           By applying the new tools of quality management: affinity diagram, relations
diagram, tree diagram, matrix diagram and PERT (Program Evaluation and Review
Technique) chart it has been obtained a more effective control of quality of the cosmetic
and dermato-cosmetic products made by Farmec Company in Cluj-Napoca, Romania.
Affinity diagram was used to recognize the critical points that can affect product quality,
relations diagram to clarify the causes that lead to hazards on the quality, tree diagram to
identify the ways to ensure the quality of cosmetic products. Matrix diagram was applied
to clarify the responsibilities of the various functions within the company in achieving a
product and PERT chart was used to establish a quality assurance plan of a cosmetic and
dermato-cosmetic product.

            Rezumat
            Prin aplicarea unor tehnici noi de managementul calităţii: diagrama afinităţilor,
diagrama relaţiilor, diagrama arbore, diagrama matriceală şi diagrama PERT (Program
Evaluation and Review Technique) s-a urmărit un control mai eficient al calităţii produselor
cosmetice şi dermato-cosmetice realizate la compania Farmec din Cluj-Napoca. Diagrama
afinităţilor s-a utilizat pentru recunoaşterea punctelor critice care pot afecta calitatea
produselor,diagrama relaţiilor pentru a preciza cauzele ce determină apariţia riscurilor
privind calitatea,diagrama arbore pentru identificarea modalităţilor de asigurare a calităţii
produselor cosmetice. Diagrama matriceală a fost aplicată pentru a clarifica
responsabilităţile diferitelor funcţiuni din cadrul companiei în realizarea unui produs,iar
diagrama PERT s-a utilizat pentru a stabili planul de asigurare a calităţii unui produs
cosmetic şi dermato-cosmetic.

            Keywords: Cosmetic and dermato-cosmetic products, quality management tools:
affinity diagram, relations diagram, tree diagram, matrix diagram, PERT diagram

          Introduction
          The classical instruments of quality assurance are: histogram, cause
and effect diagram, Pareto diagram, correlation chart, control chart, data
stratification and brainstorming [2]. The "7 tools", as they are known in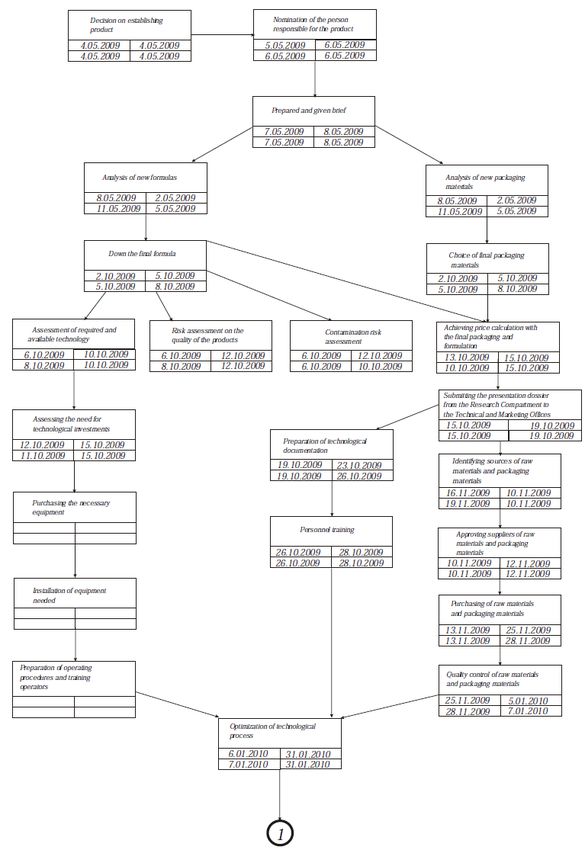
FARMACIA, 2011, Vol.59, 2                                                 247

corporate practice, form a basic system of knowledge and analysis of the
causes that determine the variation of the characteristics of a product or
process that adversely affect their quality. Once known, the causes can be
corrected in the desired direction based on the solutions established by using
appropriate methods. These classical instruments of quality management
focus on existing aspects, starting from facts, which then they seek to
improve and refine to ensure quality of the cosmetic products. The
appearance of new instruments like affinity diagram, relations diagram, tree
diagram, Matrix diagram, arrow diagram, diagram of alternatives and main
components analysis, also called the "7 new tools of quality" [1] allows a
better control of quality products. Unlike traditional instruments, modern
tools of quality management focus on prospective prevention of problems
that may arise in the process of preparation of cosmetic and dermato-
cosmetic products. The emergence of these new tools of quality control
allows better quality products. Their application in Farmec Company in
Cluj-Napoca, is part of the company's global policy to ensure continuity in a
more and more aggressive competition and uncertainty, by optimizing the
possibilities of providing quality cosmetic and dermato-cosmetic products.
This is made by a Performing Management (PM) that is the link between
employee’s and company’s objectives [3].

        Materials and methods
        The technological process of cosmetics production in Farmec
Company in Cluj-Napoca was used as working material.
        As working methods there were used: affinity diagram, relations
diagram, tree diagram, matrix diagram and PERT (Program Evaluation and
Review Technique) chart [2].
These methods have been used to:
− identify the major problems to be solved and their causes (affinities
    diagram and relations diagram);
− determine solutions to problems (Matrix diagram and tree diagram);
− establish concrete programmes for solving problems (PERT diagram).
The practical applications submitted were performed by the team at Farmec
Company in Cluj-Napoca, as a group activity, involving the following
persons: quality assurance manager, purchasing manager, production
manager, head of cosmetic department and the person responsible for
quality assurance.
248 FARMACIA, 2011, Vol.59, 2
Results and discussion
Affinity diagram
The steps taken were:
− selecting the issue that needs to be investigated: "What are the critical
points that can affect the quality of cosmetics and dermato-
cosmetics";
− collecting data and transferring it on "post-it" files;
− positioning files randomly on a large sheet of paper;
− grouping the files, having as a criterion the affinity that exists among
them;
− setting the title of the groups and chart completion.
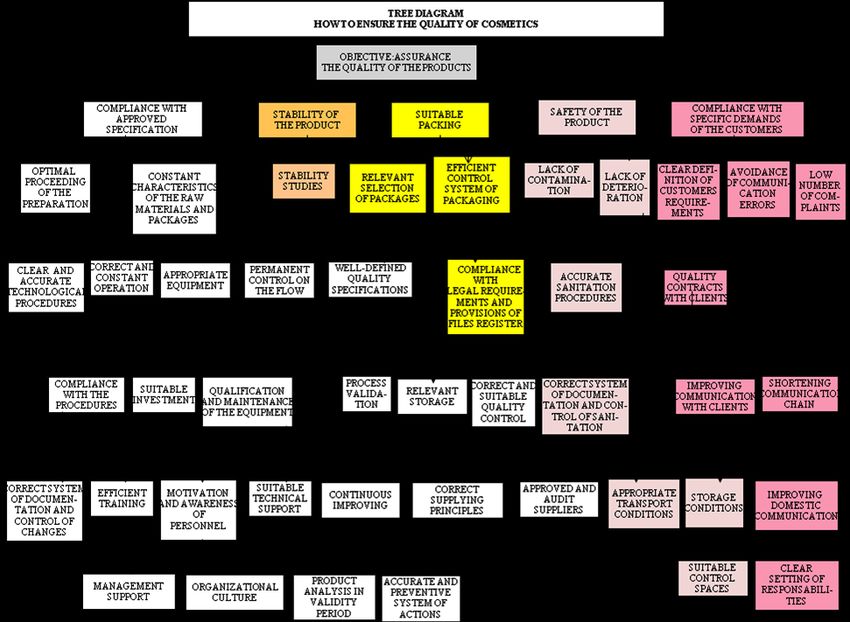
Figure 1
Affinity diagram with the theme “What are the potential risks that may affect the
cosmetics”FARMACIA, 2011, Vol.59, 2 249
The following categories of risks have been identified:
− risks of regulatory type related to legislative restrictions. After the
market launch of a product there can appear modifications in the list of
ingredients allowed in cosmetic industry;
− risks related to customers: the distance from clients, requirements,
market type, release time and financial losses due to delays;
− risks related to organization, investments, costs, production capacity and
storage correlated to the number of orders;
− risks related to supply: sources of appropriate materials, delays, quality
problems;
− risks related to product and production activity: new technologies,
difficulties in process optimization, technological losses, problems with
product formulation (stability etc.), quality;
− risks related to human resources: insufficient staff, lack of experience,
human errors.
Relations Diagram
The necessary steps to draw up the relations diagram were:
− defining the problem: "The risks regarding the quality of cosmetics
and dermato-cosmetics";
− each member of the group expressing freely its opinions on possible
causes of the problem, which were marked on "post-it" files;
− searching cause-effect relationships, indicated by an arrow pointing to
the effect;
− deepening the problem by trying to answer the question "Why?" or
"What for?" for each of the factors;
− during the next session the following activities were conducted: re-
charting, making necessary corrections;
− identifying key factors.
There were identified the following risks regarding product quality:
non-compliance with the specification, unstable formulation, large number
of deviations in process, inappropriate packaging, disregard of the special
requirements of customers, complaints, product safety affected by
contamination, counterfeiting or product tampering.
It followed the identification of the main causes of each of these
quality problems in order to be eliminated to the possible extent.250 FARMACIA, 2011, Vol.59, 2
Figure 2
Relations diagram with the theme “What are the causes of risk regarding
the quality of cosmetics”
Tree diagram
The steps taken in drawing up this chart were:
− establishing the objective: "How can it be assured the quality of
cosmetics and dermato-cosmetics";
− "brainstorming", answering the questions „What?, Who? Where?,
When?, Why?”;
− identifying the means and writing them down on "post-it" files;
− grouping the files by the similarity of the proposed means;FARMACIA, 2011, Vol.59, 2 251
− ranking of files by the importance of activities;
− arranging groups and developing means by placing each group of files
according to the importance of activities they recommend:first
level,second level, etc.;
− confirmation of objectives;
− evaluating the means in order to choose the best ones.
Figure 3
Tree diagram with the theme “How can be ensured the quality of cosmetics”252 FARMACIA, 2011, Vol.59, 2
Starting from identifying the risks concerning the quality of products
through the affinity diagram, relations diagram specifying the causes
thereof, through the tree diagram there were identified ways to ensure the
quality of cosmetics. The basic means of ensuring quality were identified as
follows: compliance with the approved specification, formulation stability,
product safety, proper packaging, compliance with specific customer
requirements, reduced number of minor complaints.
These means have become, then, aims to establish high rank means,
even down to the actual activities to be considered: compliance with legal
requirements and provisions of registration dossiers, proper optimization of
the technological process, appropriate control on the technological flow,
stability studies, continuous improvement.
Matrix Diagram
It was applied an L matrix which is an array with two entries, one set
being placed on the column and the other on line.
The steps for implementing a matrix in L were:
− defining the purpose and objective of the chart;
− defining the elements of the first set of factors and then the elements of
the second series;
− drawing and placing matrix elements;
− defining the type of correlation / connection between the two groups of
factors.
Matrix diagram was applied to clarify the responsibilities of the
various functions within the company in the stages of achieving a cosmetic
product. Table I shows the degree of involvement in activities to achieve a
cosmetic product ("help", "be informed", "not involved") of the following
functions:
− management of the company (M);
− marketing office (MK);
− research compartment (C);
− quality assurance compartment (AQ);
− quality control compartment (CC);
− technical-production office (TP);
− production department (P);
− acquisition department (A);
− financial department (F);
− design office (D);FARMACIA, 2011, Vol.59, 2 253
Table I
Matrix diagram of activities and responsibilities
to eliminate of errors and causes of risk.
M MK C AQ CC TP P A F D
Decision establishing product,
nomination of product X O O O O O O O O O
responsible
Customer requirements
O X O O O O O
evaluation
Down the formula, packaging O X X O X X O O X
Assessment of required and
O O X X X X X
available technology
Development of technological
O O X X X X X
documentation
The acquisition of materials
O O O O O O O X O O
needed
Pilot batch O X X O X X X
Optimization of technological
O X X X X X
process
Production O O O O X X X
Stability studies O O X X X O O
Control of changes O X X X X X X X O
Monitoring processes O X X X X X X X O
Product analysis in valid period O O X X X O O
Legend: X – contribute to the activity; O – is informed of the work that is carried out;
PERT (Program Evaluation and Review Technique) Chart
The steps taken were:
− defining chart theme: "What are the activities required to ensure the
quality of cosmetics and dermato-cosmetics"; a number of actions are
proposed and recorded on files;
− clarifying and combining the actions, determining those that will be
undertaken;
− ordering the files of the actions decided on and highlighting the links
between them;
− determining, according to deadlines, the moments at which you must
start the action at the earliest t1 and no later than t2;
− marking the critical path on the diagram.
PERT chart was applied to establish the quality assurance plan of a
cosmetic product. Figure 4 presents PERT chart for the project of quality
assurance of a cosmetic product. The meaning of symbols used is:
Analysis of new formulas = Activity description
8.05.2009 = Date scheduled to commence the activity
11.05.2009 = Actual date of commencement of activity
2.05.2009 = Planned date for completion of activity
5.05.2009 = Actual date for completion of activity254 FARMACIA, 2011, Vol.59, 2
Figure 4 (part I)
PERT Chart regarding the project of achieving the quality of a cosmetic productFARMACIA, 2011, Vol.59, 2 255
Production pilot batch
Complete pilot batch
tracking
Figure 4 (part II)
PERT Chart regarding the project of achieving the quality of a cosmetic product256 FARMACIA, 2011, Vol.59, 2
Conclusions
In order to optimize the possibilities of ensuring the quality of
cosmetic and dermato-cosmetics, Farmec Company in Cluj-Napoca,
Romania has applied modern techniques of quality management.
Affinity diagram was used as a group method to identify critical
points that can affect the quality of cosmetics and dermato-cosmetics. There
were identified regulatory risks and risks related to the market, organization,
supply, product and production activity.
Relations diagram was applied to assess the causes that can lead to
risks regarding the quality of cosmetics and dermato-cosmetics. The
following risks regarding quality have been identified through teamwork:
non-compliance with specification, problems with product formulation, a
large number of deviations in process, improper packaging, complaints,
contamination. For each of these critical points the main causes were
identified through relations chart in order to eliminate them.
The tree diagram evaluated the ways to ensure the quality of the
products. Some activities are related to the quality assurance system of the
company and others to specific activities such as compliance with legal
requirements and provisions of product registration dossiers, proper
optimization of the technological process, strict observance of technological
process parameters, analysis of products during the validity interval and
application of preventive and corrective actions.
With matrix diagram the activities and responsibilities of various
departments of the company were established in order to eliminate the errors
and causes of risk.
Setting the specific quality assurance plan of cosmetic and dermato-
cosmetic products was achieved by applying PERT chart, allowing the
critical activities and the timeframe planned for each stage to be watched,
thus evaluating the individual contribution of the various functions within
the organization to meet the deadlines.
References
1. Affinity Consulting, The seven management and planning tools: The affinity Diagram,
Affinity Consulting Web site. Available from:
http://www.affinitymc.com/ Affinity_Diagram.pdf
2. Perigord M., Etapele calităţii, Bucureşti, Editura Tehnică, 1997
3. Gabriela Antoaneta Vlasceanu, Conceptul Star, Element component si instrument de
evaluare in cadrul Procesului de Management Performant, Farmacia, 2007, LV, 2, 229-
236.
Manuscript received: May 24th 2010You can also read