How are Passive Acoustic Data Used to Inform the Decision-Making Process? - Elizabeth Henderson NIWC Pacific 22 October 2020
←
→
Page content transcription
If your browser does not render page correctly, please read the page content below
How are Passive Acoustic
Data Used to Inform the
Decision-Making Process?
Elizabeth Henderson
NIWC Pacific

22 October 2020
Use of a hydrophone and recorder to listen to underwater
sounds
Passive vs Active?
Listening/recording rather than emitting sound
Sound/Signal vs Noise?
What is Sound of interest often referred to as “sound”
Marine mammal vocalizations
Passive Seismic air guns
Acoustic Other incidental sounds often referred to as “noise”
Ambient/background sounds
Monitoring? Anthropogenic sounds
Types of recording instruments vary
Towed arrays
Instruments to be recovered
Non-recovered recorders
Bottom-mounted hydrophones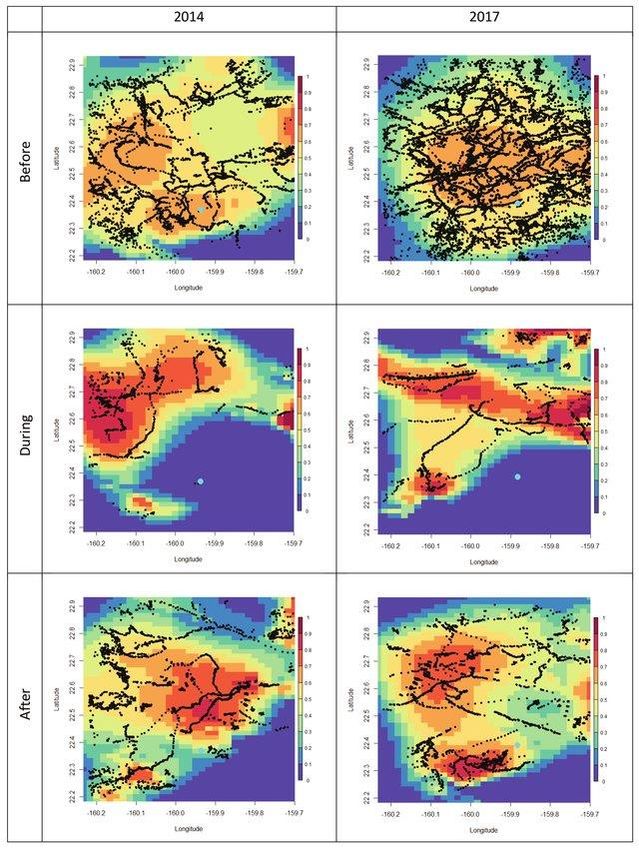
What is
Passive
Acoustic
Monitoring?

              Soldevilla et al. 2006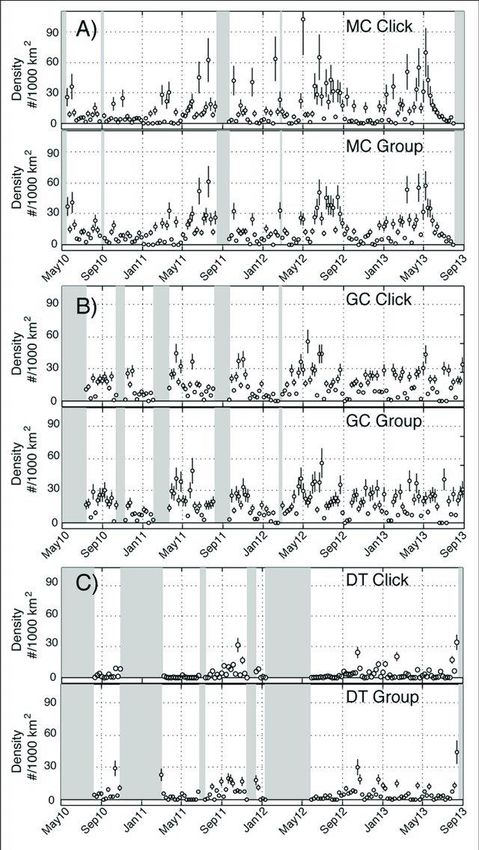
Typically less expensive/longer duration than
other methods
Can address a variety of data topics
How Does Marine mammal occurrence, behavior, habitat use,
behavioral response
Passive Presence of anthropogenic activity
Acoustic Data Noise levels (Background, specific sounds)
Help Decision Source level vs received level
Making? Depends on question, type of recording
system, and type of data
DOSITS page
How sound is used to help marine mammals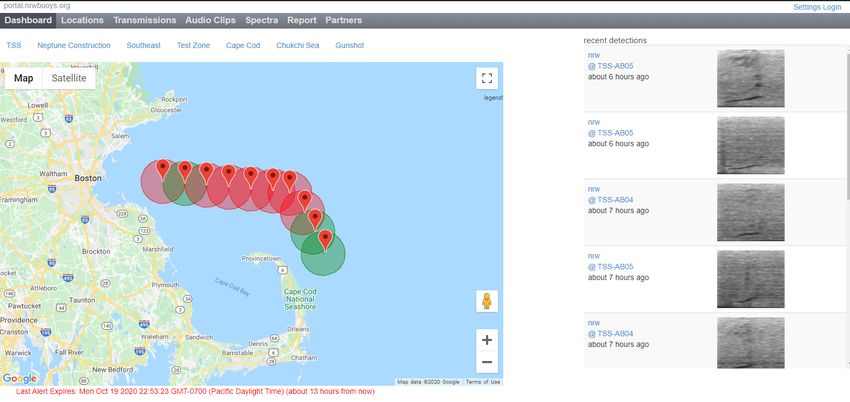
How much data recorded?
Continuous
Periodic
Duty-cycled data (e.g. record 5 min, off for 15 min = 25% duty cycled)
How many receivers?
Single sensor recorders
Passive Multi-sensor recorders/arrays
Acoustic Data Where are receivers located?
Water column vs seafloor
Types Recorders that are deployed and recovered
Permanently mounted/cabled hydrophones
Acoustic tags attached to animals (e.g. DTAG)
What data are recorded?
Raw acoustic files
Detection reports (e.g. C-PODS)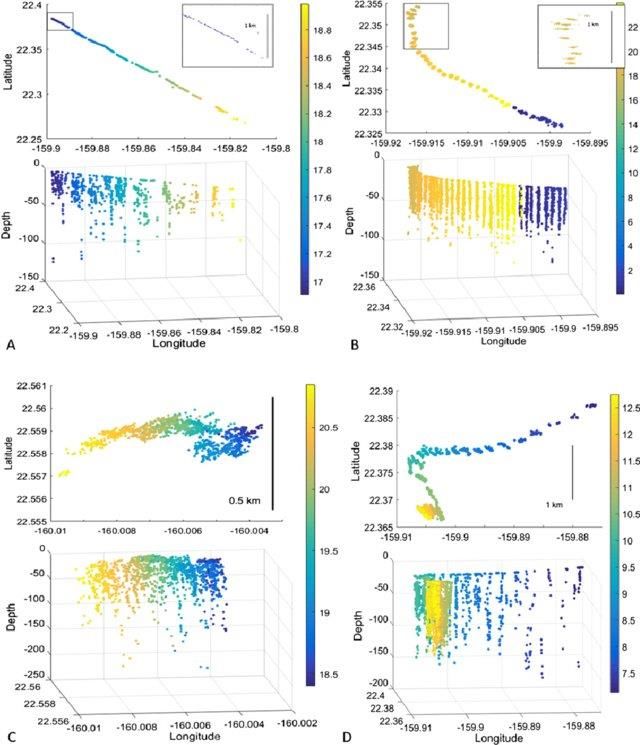
Different questions can be answered by different data types
Presence/Absence of a species
Passive
Types of detections relative to behavior
Acoustic Data
Capabilities Localization of animals
and Track animals
Questions
Abundance/Density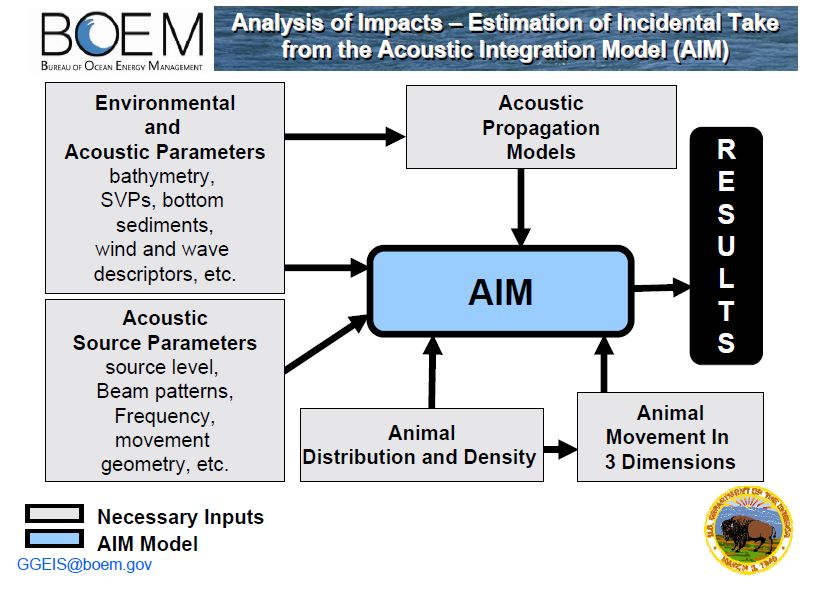
Any type of recorder, duty cycle, or data format
What species are present in a given area?
Are there patterns to that species’ presence?
Diel, seasonal, interannual
E.g. Simonis et al. 2017 – Seasonal and diel patterns of common dolphins
How much temporal/spatial overlap between species’ of interest and
planned activity?
Johnson et al. 2016 – Acoustic (and other) detections of sperm whales,
overlap with proposed marine protected area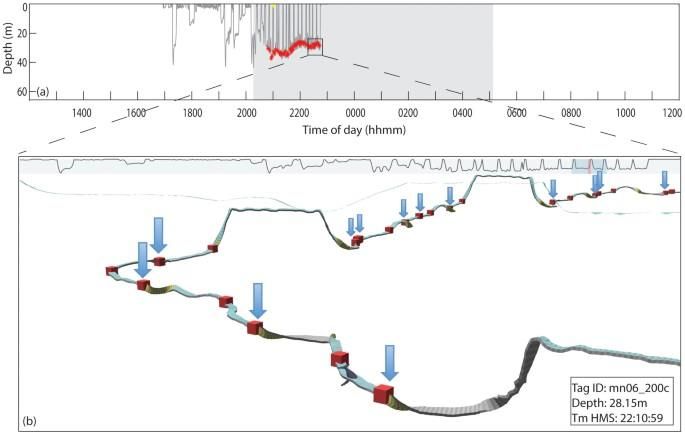
Presence/
Absence

            Simonis et al. 2017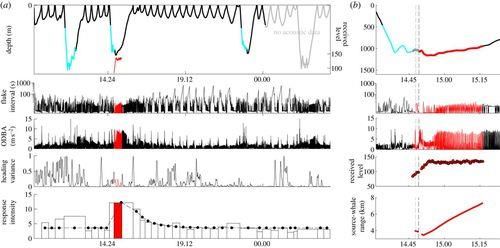
Important for project planning, shipping traffic
Historical passive acoustic data
Seismic surveys, wind farm development, coastal construction
Can plan seasonally when high risk species are not present
New York State Offshore Wind Master Plan Marine
Presence/ Mammals and Sea Turtles Study
Absence Real time acoustic data
Whale Alert - http://www.whalealert.org/
West Coast - blue, fin, and humpback whales
Reduced ship strikes in shipping lanes
East Coast – North Atlantic right whales
Dynamic and Seasonal Area closures
Acoustic system in Stellwagen Bank to report detections
Presence/
Absence
Behavioral States
Foraging/Socializing/Traveling/Resting
Specific foraging vocalizations
Echolocation clicks and buzzes (e.g. Blainville’s beaked whales,
Gérard et al. 2008)
Acoustic cues (e.g. humpback whale bubble net feeding,
D’Vincent et al. 1985)
Often more vocalizing (whistling) when socializing
Behavior Fewer vocalizations in some states
Resting
Mammal-eating killer whales reduce vocalizations when hunting
(e.g. Deeke et al. 2005)
Time/activity budgets of behavior
e.g. Henderson et al. 2011
Humpback song/other baleen whale songBehavior
Gérard et al. 2008 Some species more responsive/sensitive to sounds when in
specific behavioral state
Blue whales
Goldbogen et al. 2013 – blue whales responded more to mid-frequency
sonar when deep feeding, less when shallow feeding
Humpback whales
Sivle et al. 2016 – humpback whales stopped foraging when sonar began
BUT Wensveen et al. 2017 – found a lack of avoidance behavior in
Behavior humpback whales when exposed to sonar (same study)
Risk of entanglement
Santora et al 2020 – Increase in humpback whale entanglements
during Pacific Heat Wave
reduced foraging habitat plus shift in peak crab fishing
Can develop mitigation strategies based on location/time of
year for important behaviorsBehavior Goldbogen et al. 2013
Localize groups of vocalizing animals
Sperm whales, beaked whales
With multiple sensors can also acoustically track animals
Gassmann et al. 2013 – used four recorders on seafloor to localize
and track killer whale group
Localized/
Navy ranges have hundreds of bottom-mounted
Tracked hydrophones
Animals Can detect, localize, and track frequently calling animals in 3D
Henderson et al. 2018 – tracked singing humpback whales in
Hawaii, identified different movement behaviors
Helble et al. 2020 and Guazzo et al. 2020 – tracked humpback
and minke whales in Hawaii, estimated source levels of
vocalizationsLocalized/
Tracked
Animals
Henderson et al. 2018 Assess response in the vocal and movement behavior of
acoustically tracked animals
Harris et al. 2019 – Examined acoustically tracked minke whales
before, during, and after Navy training events and observed changes
in spatial distribution of whales
Localized/
Tracked Durbach et al. in prep – changes in movement behavior of minke
whales during periods of MFAS
Animals
Martin et al. 2020 (figure by R. Guazzo) – minke whales stop calling
during high ambient noise periodsLocalized/
Tracked
Animals
Harris et al. 2019Localized/
Tracked
Animals
R. Guazzo, from Martin et al. 2020 Can use acoustic data to obtain density estimates
Cue Counting method
First need to know the cue/call rate and how stable it is
Guazzo et al. 2020 – Acoustic call rates of fin whales in Hawaii over a decade
Marques et al. 2009 – Used echolocation clicks from Blainville’s beaked
whales to estimate density from Navy range
Est. 22.5 - 25.3 animals/ 1000 km^2
Abundance
Group/Dive Counting Method
and Density Need information on group size and dive rates
Moretti et al. 2010 – Blainville’s beaked whale dive rates known from Navy
range monitoring; group size known from visual surveys
Est. 16.99 – 24.75 animals/ 1000 km^2, comparable to click-counting method
Hildebrand et al. 2019 – used click- and group-counting methods for dwarf
and pygmy sperm whales in the GoM; found densities much higher than
found in visual surveys – better coverage & detectability acousticallyAbundance
and Density
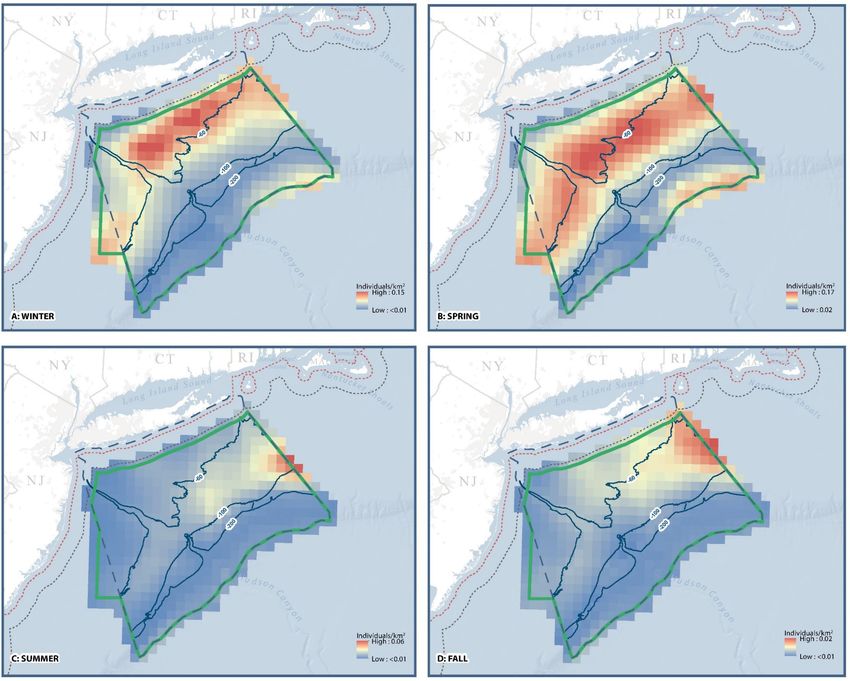
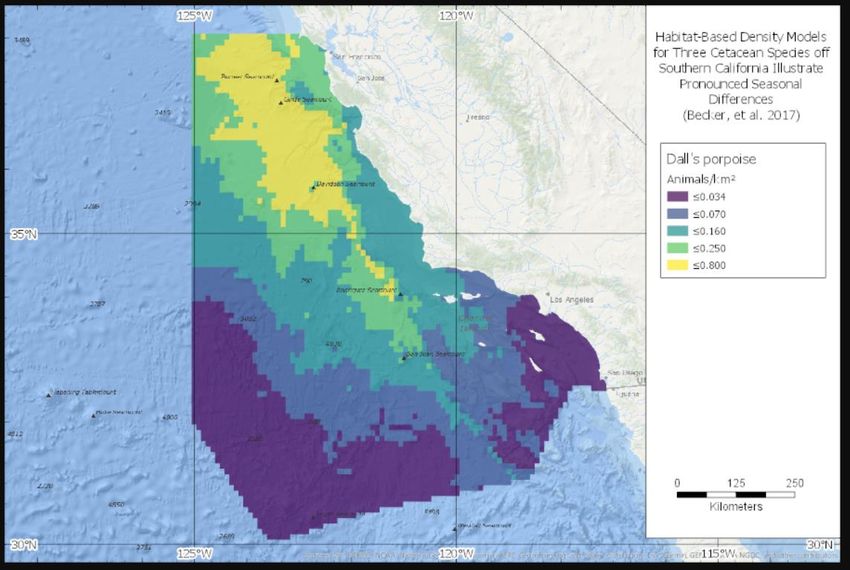
Hidebrand et al. 2019 Maps of marine mammal density
https://cetsound.noaa.gov/cda-index
http://seamap.env.duke.edu/ - OBIS SEAMAP
Density maps used by regulators for decision making
Navy uses density surfaces to estimate impacts of training activity
Long term assessment of density can show if populations are
increasing/decreasing
Abundance Vaquita in Gulf of California – repeated visual and acoustic surveys
were able to track the population decline from 567 in 1997 to 245 in
and Density 2008 to ~50 in 2015 (Barlow et al. 2007; Gerrodette et al 2010;
Jaramillo-Legorreta et al. 2017)
Collaborative effort between US and Mexican scientists and
government agencies
This rapid decline led to emergency 2-year ban on gillnets in GoC by
Mexican government
Population now less than 30 animalsAbundance
and Density
OBIS-SEAMAP (from Becker et al. 2017) Acoustic tags – record sound plus fine movement, can link
acoustics and behavior
Tyack et al. 2006 – early work tagging Blainville’s and Cuvier’s
beaked whales; discovered echolocation click behavior only
occurred in certain period of dives
Acoustic Tags Lewis et al. 2018 – linked blue whale vocalizations with dive behavior
to determine when blue whales are calling (e.g. more at surface, less
during deep foraging dives)
Parks et al. 2014 – “paired burst” calls during humpback whale
bottom feeding behaviorAcoustic Tags
Parks et al. 2014 Acoustic and other tags used in behavioral response studies
DeRuiter et al. 2013 - Looked at course and fine scale movements of
individual Cuvier’s beaked whales to determine if a response
occurred
Falcone et al. 2017 - Aggregate data from many Cuvier’s beaked
whales to look at overall changes in behavior
Acoustic Tags Examine the relationship between received level and
response
Miller et al. 2013 - Measured received sound level on tagged killer
whales, developed dose-response function
Schick et al. 2019 – Modeled sound propagation field to estimate
sound level at satellite tagged beaked whales and pilot whalesAcoustic Tags
DeRuiter et al. 2013 NMFS and Navy both developed criteria to estimate hearing
threshold impacts for various sound sources
NMFS Acoustic Technical Guidance
US Navy Criteria and Thresholds
Similar thresholds and methods for TTS/PTS from sonar, developed
in consultation together
Decision Behavioral Risk Functions for Navy
Making Tools primarily relied on Behavioral Response Studies using acoustic tags,
plus some captive research
Updating risk functions, considering incorporation of other sources
of behavioral response
Acoustically tracked whales on ranges
Satellite tags with propagation modeled received levels
BOEM assess takes using the Acoustic Impact Model (AIM)Decision Making Tools
QUESTIONS?
You can also read