NC3Rs Maths in Medicine Case Study: Big data for Biologists
←
→
Page content transcription
If your browser does not render page correctly, please read the page content below
NC3Rs Maths in Medicine Case Study:
                    Big data for Biologists

                                  Manasi Nandi PhD, FBPhS, FHEA
                         Senior Lecturer Integrative Pharmacology
                                   King’s College London
                                  manasi.nandi@kcl.ac.uk

Google images used throughout
M Nandi is a co-inventor on IP presented in this presentation
The arterial pulse measured in 1738
              …a horse and a glass tube

Hales, S. Haemastatics, 3rd edition pg 1. 1738
The arterial pulse measured in 1854
                  Sphygmograph

 1831 Julius Hèrisson
 1854 Karl von Vierordt
 1863 Étienne-Jules Marey
Google images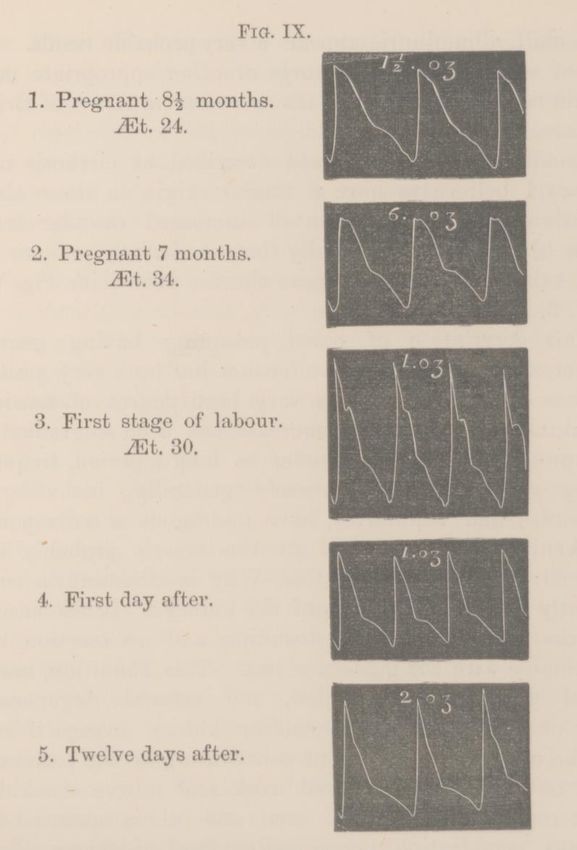
Mohomed FA The physiology and clinical use of the sphygmograph Med times Gazette 1872; 1:62. M.F O’Rourke,
Hypertension 1992; 19:212-217

Frederick Akbar Mahomed
                            Guy’s Hospital 1869

                               “The pulse, ranks the first among our guides; no surgeon can
                               despise its counsel, no physician shut his ears to its appeal.

                               Since, then, the information the pulse affords is of so great
                               importance and so often consulted, surely it must be to our
                               advantage to appreciate fully all it tells us, and to draw from it all
                               that it is capable of imparting…..

                               …we should study the pulse in its marvellous changes of character
                               and form, as recorded by the sphygmograph”

Mohomed FA The physiology and clinical use of the sphygmograph
Med times Gazette 1872; 1:62

Mohomed FA The physiology and clinical use of the sphygmograph Med times Gazette 1872; 1:62. M.F O’Rourke, Hypertension 1992; 19:212-
217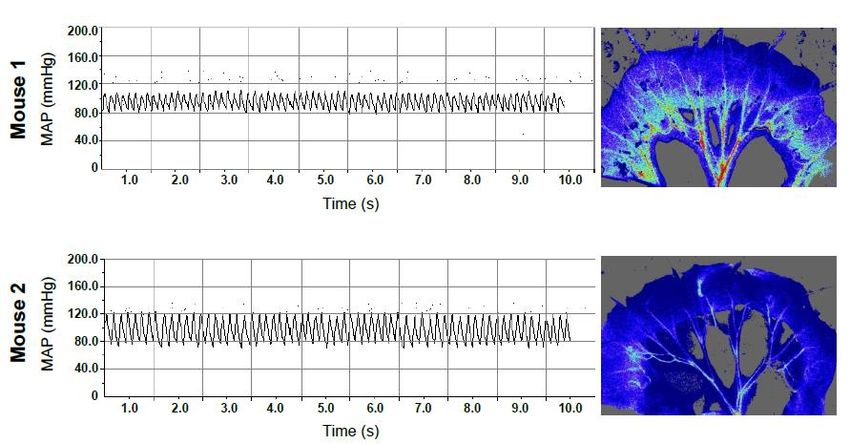
Now…we can measure almost anything, all of the time….
                    Big Data

125-1000Hz sampling                             Google images
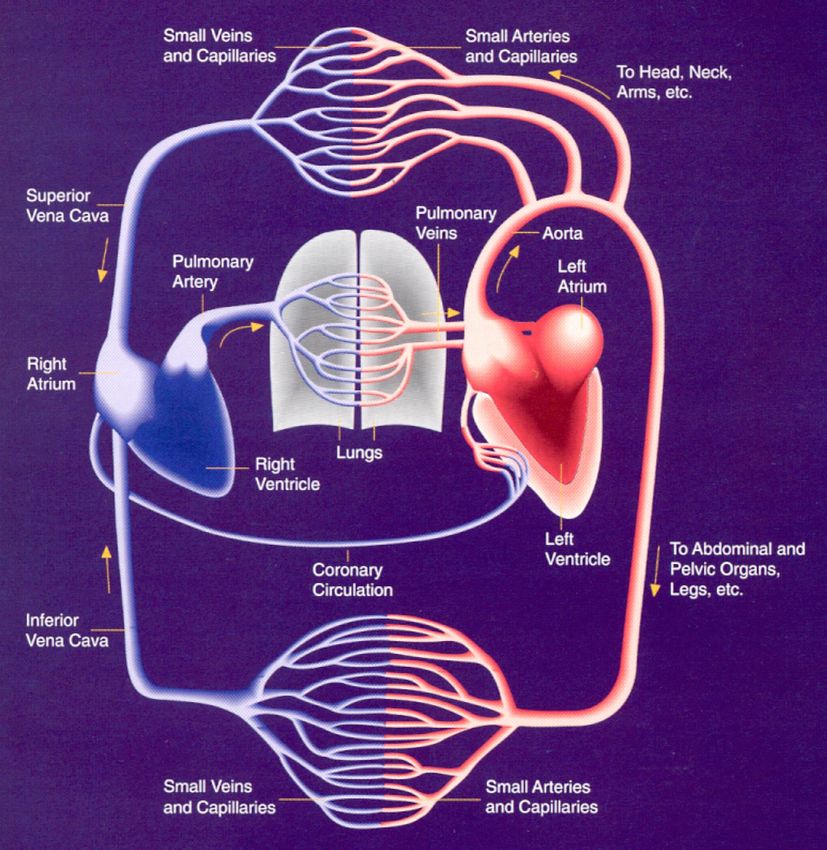
Source: Chung, M.K., and Rich, M.W. Introduction to the cardiovascular system. Alcohol Health and Research World
14(4):269–276, 1990.


Are we missing a trick?
• As individual control systems in a plane start to
  fail, so the plane wobbles, turns, spirals and
  eventually crashes….
• Similarly, in the human body, there may be
  subtle changes in our own control systems that
  are changing but by the time we have
  ‘diagnosed‘ a patient – they have already
  ‘crashed’

Sepsis
                                                            Sepsis:
                                                       Early diagnosis,
                                                       rapid treatment
                                                     (fluids, antibiotics)
Infection
Lungs, GI tract,                                        20% mortality
Genitourinary infection
Burns or other open wounds
Invasive surgery
                                                          Septic shock:
                                                      CVS stabilising agents
               Exaggerated immune response              30-50% mortality
                  Blood pressure plummets
                  Impaired organ perfusion
                     Multiple organ failure
                            Death
                   40,000 deaths p.a. in UK
            NHS cost £2500 per patient per bed day
24 hour model – Typical experience of the animal
24 hours of sepsis in a mouse
Hypotension
Tachycardia Bradycardia
0 hrs 18-24 hrs
Metabolic acidosis
Impaired renal functionCan we predict that a patient will crash,
before they crash?
Endotoxin
Mean arterial blood pressure
Crash
TimeMacro versus Micro circulation
130/90mmHg
Mouse 1
450 bpm
Mouse 2
110/80mmHg
480 bpm Is there information
in the waveform that
predicts clinical deterioration
above and beyond the
‘set point’?
Mouse 3
120/90mmHg
420 bpm
Sand et al., J Appl Physiol . 2014Mini summary • The cardiovascular system is a complex with many homeostatic mechanisms that contribute. • Sepsis is a condition where these systems start to fail and then the patient suddenly crashes. • Data is collected at high fidelity so we collect entire waveform data…but don’t use it…. • Since 1854 scientists and doctors have considered that there is important information in the shape of the wave • How can we quantify the waveform shape?
Waveform shape

120mmHg

 80mmHg
Can mathematics help?
Finding patterns in data streams

     x

     z

     y

Time series data
Lorenz attractor – a product of chaos
theoryCan we plot blood pressure data in 3D?
Floris Takens –
Mathematician
1981
Philip Aston
Mathematician
We only have 1 data stream University of Surrey
2013Jerome Di Pietro – E-learning technology
Step 1 – 3D plot with time delaysStep 2 : Rotate
Step 3 : Add density
1                   140

        BP (mmHg)
                                                                               z
                    120
                                                                                   y
                    100
                                                                                       x
                      0.0              0.1        0.2             0.3                0.4             0.5                 0.6    0.7   0.8
                                                                        Time (seconds)

                                                                  140
2                         If:                                     130

                          X = 108 mmHg                        z   120
                          y = 120 mmHg                            110
                          Z = 138 mmHg
                                                                  100

                                                                        100
                                                                          120
                                                                    y
                                                                               140
                                                                                             140    130    120     110    100

                                                                                                           X

3

4 140                                                 5                                                        6
                                                        140
    130

z   120
                                                        120
    110

    100                                                 100
                                                          100                                              100
        100
                                                                  120
    y     120
                          140   130   120 110   100
                                                                         140                       120
                                       x                                               140
AR is fundamentally to normal CV
measures….
• Data are viewed in reconstructed phase space
enabling continual analysis of lengthy data
streams (hours/days of recording).
• Baseline wander is factored out in order to
focus on subtle changes in the waveform
shape/variability – the key inventive step.
• Scalar measures from the attractor are used as
quantitative physiological readouts of change
in waveform shape and variabilityExtracting features from the attractor
What is the
angle of
How big is it?
rotation?
How wide are How dense are
the sides? the hot spots?Application to other periodic waveforms in any species
BP ECG
Pulse Oximetry Intra Cranial Pressure
Central Venous Pressure Respiratory
Gary Chaffey and Philip Aston – mathematicians, U of Surrey ; Physionet and other open access online sourcesTelemetry continuous
waveform data 1000Hz
10am-4pm naïve
Chart beat detection
10am-4pm sepsis AR coding
software
Extraction of AR
Extraction of SBP, DBP,
measures, size, form,
HR, HRV and PP
density etc.
every half hour
every half hour
Ying Huang – mathematical
Anna Starr & Claire Sand
coding
Integrative pharmacologists
University of Surrey
King’s College London‘Conventional’ ‘Attractor’
measures measures
Head to head
comparison
ROC AUC Hitesh Mistry
Statistics
ManchesterHealthy ROC AUC =1 Septic
Healthy Septic
ROC AUC ~ 0.5
ROC AUC = 1 – good discrimination between healthy and septic
ROC AUC = 0.5 – Poor discrimination/random chance‘Conventional’ ‘Attractor’
measures measures
Conventional Baseline Baseline vs. AR measure Baseline vs. Baseline vs.
measure vs. saline sepsis saline sepsis
Systolic BP 0.52 0.54 AR measure A2 0.51 0.78
Diastolic BP 0.52 0.86 AR measureA3 0.63 0.76
Pulse 0.54 0.82 AR measure A4 0.62 0.65
Pressure
AR measure A5 0.57 0.82
MABP 0.71
AR measure A6 0.59 0.64
Heart Rate 0.58 0.86
AR measure A7 0.53 0.83
Heart rate 0.53 0.84
variability AR measure A9
(HRV RR) AR measure P4 0.52 0.99
HRV SDRR 0.65 0.62
AR measure P6 0.62 0.96
HRV RMSRR 0.61 0.54Pilot studies using HESI data
Pimombendan- PDE3 inhibitor – positive ionotrope
Itraconozole- antifungal – negative ionotrope
Hypothesis: AR can be used to extract information about changes
in cardiac contractility from a peripheral BP waveform
HESI meeting, 13-15th June 2017, DublinSummary
Jerome Di Pietro                                                     Pete Charlton                   Claire Sand
                                                                                          Ying Huang                                                             KCL
                                                              KCL                                                                  KCL
                                                                                            Surrey                                                         Sepsis models
                                                    E-learning technologist                                              Coding developments
                                 Carolyn Lam                                         Coding developments                                             Integrative pharmacologist
                                                                                                                              Clinical data
                                     KCL                                              Maths PhD student
                                                                                                                          Biomedical engineer
                               Pharmacologist;
                               Data processing

   Philip Aston                                                                         Jane Lyle
                                                    Miquel Serna Pascual                  Surrey
     Surrey                                                                       Coding developments
                                                            KCL
   Mathematics                                       Pharmacologist;              Maths research PhD
                                                                                                                  Hitesh Mistry                      Esther Bonet Luz
                                                      Data processing                    student
                                                                                                                   Manchester                         Mathematician
                                                                                                                    Statistics,                      Machine learning
                                                                                                              applied mathematics
                                                                                                                 and algorithms
                              Phil Chowienczyk
                                     KCL
                           Clinical Pharmacology
                         Cardiovascular waveforms
    Gary Chaffey
       Surrey                                                                                                                      Ashley Noel Hirst
                                                       Jordi Alastruey                  Anna Starr                                                                Richard Beale
Coding developments                                                                                                             Nuffield project student
                                                             KCL                           KCL                                                                      KCL/GSTT
Maths research fellow                                                                                                             In silico modelling
                                                    Biomed engineering        Sepsis models and AR analysis                                                  Critical care medicine
                                                                               Integrative pharmacologist                                                  Cardiovascular waveforms

                                                                                Cath Williamson
                            Jenny Venton                                       Guy’s & St Thomas’
                                KCL                                             Women’s Health
                            Mathematics                                                                                Duncan Mcrae and Mary Anton
                        Coding developments                                                                                  Royal Brompton
                          Data processing                                                                                Paediatric Intensive Care
http://ehealth.kcl.ac.uk/cardiomorph/
You can also read