Spencer Woody, Emily Javan, Kaitlyn Johnson, Remy Pasco, Maureen Johnson- León, Michael Lachmann, Spencer J. Fox, Lauren Ancel Meyers April 12 ...
←
→
Page content transcription
If your browser does not render page correctly, please read the page content below
Spencer Woody, Emily Javan, Kaitlyn Johnson, Remy Pasco, Maureen Johnson-
León, Michael Lachmann, Spencer J. Fox, Lauren Ancel Meyers

April 12, 2021
The University of Texas at Austin
COVID-19 Modeling Consortium

utpandemics@austin.utexas.edu
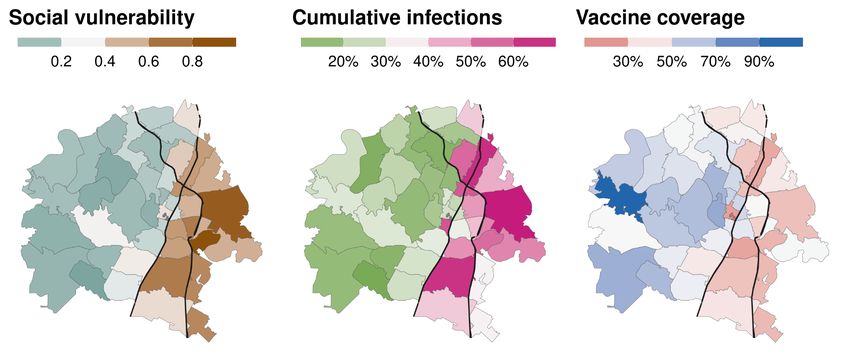
Spatial distribution of COVID-19 infections
and vaccinations in Austin, Texas
April 12, 2021

The University of Texas COVID-19 Modeling Consortium
Contributors: Spencer Woody, Emily Javan, Kaitlyn Johnson, Remy Pasco,
Maureen Johnson-León, Michael Lachmann, Spencer J. Fox, and Lauren Ancel Meyers

Contact: utpandemics@austin.utexas.edu

Overview
In this report, we estimate the spatial distribution of SARS-CoV-2 infections and vaccine
administration across Austin, TX. We find marked geographic differences in these
outcomes. In particular, ZIP codes on the western side of the city tend to have higher
vaccine coverage and lower estimated cumulative infections than ZIP codes on the
eastern side of the city. These differences mirror disparities in social vulnerability, as
measured by the CDC’s social vulnerability index (SVI), which tends to be higher in
eastern ZIP codes than in western ZIP codes.

Estimated SARS-CoV-2 infection rates and vaccine
uptake by ZIP code in Austin
Figure 1 maps the spatial distribution of three key estimates across the city of Austin as
of early April 2021: (1) social vulnerability, (2) cumulative SARS-CoV-2 infections, and
(3) proportion of adults aged 16 and older that have received at least one vaccine dose.
There is east-west geographic clustering for each indicator, with ZIP codes on the
eastern side generally having a higher social vulnerability index (SVI) [1], higher
estimated cumulative infections, and lower estimated rates of vaccine uptake than ZIP
codes on the western side of the city.

Figure 2 provides a scatter plot showing the correlations between these three variables.
Generally, as social vulnerability increases, infection rates increase and vaccination
rates decrease. As of the first week of April 2021, a one percent increase in the
estimated cumulative infections in a ZIP code is associated with 0.52 percentage point
decrease in vaccination coverage in that ZIP code (p < 0.001; R-sq = 0.36). Similarly, a
0.01 increase in the SVI a ZIP code is associated with a 0.43 percentage point
decrease in vaccination coverage in that ZIP code (p < 0.001; R-sq = 0.50).

We also considered the possibility that the estimated disparities in vaccine coverage are
simply caused by differences in the proportion of the population over 65 in each ZIP
code, rather than general differences in uptake. For this, we conducted a linear
regression analysis relating vaccine coverage by ZIP code to three variables: the
proportion of the population over 65, the social vulnerability index, and the estimated
cumulative infection rate. Even after adjusting for demographics (over 65) and the
cumulative infection rate, we found that social vulnerability is significantly associated
with lower vaccine coverage. An increase in SVI of 0.01 corresponds to a decrease in
vaccine coverage of 0.40 percentage points (p = 0.007), compared to 0.43 percentage
points when not accounting for demographics.

Figure 1. Estimated social vulnerability (left), cumulative SARS-CoV-2 infections (middle),
and SARS-CoV-2 vaccine coverage (right) for 43 ZIP codes in Austin, Texas. The CDC’s
social vulnerability index (SVI) is a measure of poverty, lack of access to transportation,
crowded housing and other factors that increase the likelihood of human suffering and economic
loss [1]. Cumulative infections is the percentage of the population in each ZIP which has been
previously infected by SARS-CoV-2, and is estimated from COVID-19 hospital admissions data
through March 29, 2021 [2]. Vaccine coverage is defined as the percentage of the adult
population age 16 and older which has received at least one dose of a COVID-19 vaccine as of
April 5, 2021 [3]. Black lines represent highways I-35 and US-183. Colors are scaled to reflect
values relative to the city average, with white corresponding to the average value across all 43
ZIP codes. There is a marked geographic pattern in all three measures, with eastern ZIP codes
tending to have higher social vulnerability, higher infection rates, and lower vaccination
coverage.

UT COVID-19 Consortium                        2                           April 12, 2021
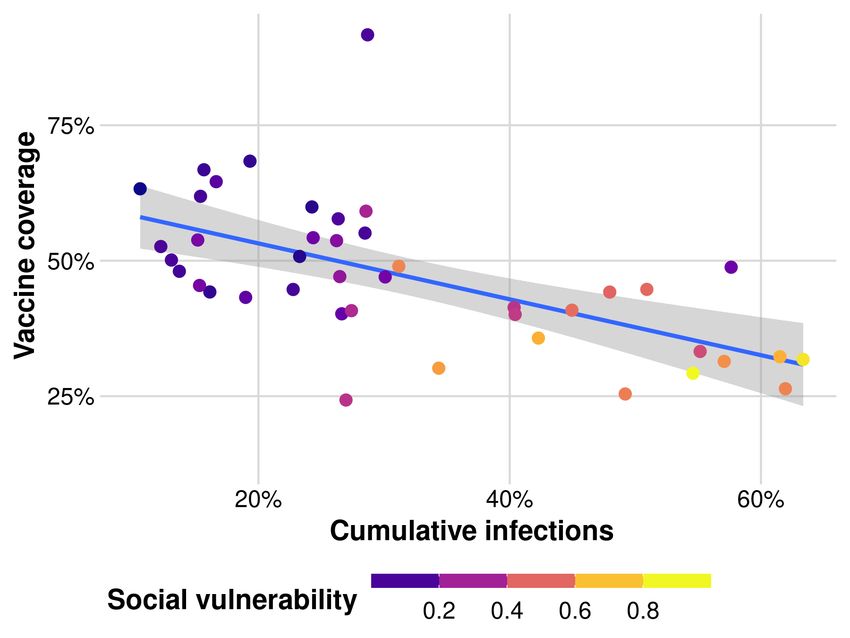
Figure 2. Relationship between social vulnerability, cumulative SARS-CoV-2 infections,
and vaccine uptake in the 43 ZIP codes of Austin, Texas. Each point represents a ZIP code.
The color of each point indicates the social vulnerability index (SVI; higher is more vulnerable)
of the ZIP code, which is a measure of poverty, lack of access to transportation, crowded
housing and other factors that increase the likelihood of human suffering and economic loss [1].
Cumulative infections is the percentage of the population in each ZIP which has been previously
infected by SARS-CoV-2, and is estimated from COVID-19 hospital admissions data through
March 29, 2021 [2]. Vaccine coverage is defined as the percentage of the adult population over
age 17 which has received at least one dose of a COVID-19 vaccine as of April 5, 2021 [3]. A
one percentage point increase in attack rate is associated with a drop in vaccine coverage of
0.52 percentage points (p < 0.001; R-sq = 0.36). Similarly, a 0.01 increase in SVI is associated
with a decrease in vaccine coverage of 0.43 percentage points (p < 0.001; R-sq = 0.50).

UT COVID-19 Consortium                         3                           April 12, 2021
Limitations
Vaccination coverage estimates
Vaccination data from Texas DSHS [3] are subject to reporting delays and thus may not
be up to date in all ZIP codes. Furthermore, the ZIP code of the vaccine recipient is
reported by the vaccine provider to ImmTrac2 and may be inaccurate if the recipient’s
ZIP code:

   ● is not provided accurately or at all by the vaccine recipient

   ● no longer reflects the recipient’s residence

   ● is not entered accurately or at all into ImmTrac2 by the provider

Of the 8.2 million vaccine recipients in the data set, approximately 0.9% have an invalid
or unknown ZIP code and approximately 0.6% are outside of Texas. Therefore, our
estimates may not fully or accurately represent vaccination coverage throughout the
city.

Cumulative infection estimates
We note several assumptions of our analysis. First, the population composition of each
ZIP code is based on 2015-2019 ACS data, which does not account for annual
fluctuations in ZIP codes. Fluctuations may occur due to large numbers of university
student residents migrating seasonally (78705 for UT Austin) or those who may have
relocated permanently during 2020, both influx of new residents and outflux of those
displaced. Estimates for ZIP codes have additional uncertainty and should be
considered with caution. Second, our estimates for age groups and ZIP codes with
small numbers of hospitalizations have a high level of uncertainty. Finally, the case and
hospitalization data does not include individuals who were tested or required
hospitalization for COVID-19 while traveling outside of Austin or whose addresses were
not correctly recorded. For example, people experiencing homelessness or
undocumented residents may be less likely to provide addresses. Such omissions
would lead to underestimation of the cumulative infections and overestimation of the
reporting rates.

Data and Methods
The CDC social vulnerability index (SVI) was calculated for Texas at the census tract
level using the 2014-2018 American Community Survey (ACS) [1]. SVI is a composite
of a number of factors which may make a community vulnerable to natural or

UT COVID-19 Consortium                     4                         April 12, 2021
human-made disasters, and includes measures of poverty and crowded housing. SVI
values are percentile ranks of census tracts within Texas. For example, a census tract
with an SVI of 0.6 is more vulnerable than 60% of the census tracts in Texas. SVI was
converted to ZIP code level using the percent of residential addresses in each census
tract from the 3rd quarter 2020 crosswalk provided by the U.S. Department of Housing
and Urban Development (HUD) [4].

For each ZIP code, total infections were estimated from reported age-stratified
COVID-19 hospitalizations in the Austin area through March 29, 2021 and the estimated
infection hospitalization ratio (IHR) for each age group and ZIP code. To transform these
estimates into percents, we divided each by the population size of the ZIP code,
according to the 2015-2019 ACS [5]. Children under one year of age were excluded
from the analysis. Children ages 1-19 were grouped together, adults 20 or over were
grouped into 10 year bins up to age 70. IHRs for each age group were based on
estimates from France [6] and then transformed for each ZIP code based on the ratio
between the high risk proportion in the ZIP code versus France. Individuals with
conditions listed as high risk for severe illness by the CDC were separated into high risk
subgroups [7]. For Austin, we estimated the high risk proportion of each ZIP code based
on the CDC PLACES dataset [8] and calculated pregnancy rates by following the
methodology in the CDC reproductive health report [9]. For France, we used a similar
methodology to estimate high risk proportions based on comorbidity data for France
[10–13]. The high risk group was assumed to be six times more likely to be hospitalized
than the low risk group [14]. A prior report on the spatial burden of COVID-19 infections
in the Austin-Round Rock Metropolitan area [2] provides a detailed description of the
methods for estimating cumulative infections. However, in this analysis, we grouped age
groups across ZIP codes with zero reported hospitalizations to avoid overestimation.

Vaccine administration data are provided daily by the Texas Department of State Health
Services, aggregated by residential ZIP code of the vaccine recipient [3]. As of April
2021, the FDA has authorized SARS-CoV-2 vaccines to be used in person at least 18
years old (Moderna; Janssen) or 16 years old (Pfizer). Therefore, we combine vaccine
administration data and ZIP code population estimates from the 2015-2019 ACS to
estimate adult vaccine coverage, that is, the percentage of the adult population aged 16
and older that has received at least one dose of a SARS-CoV-2 vaccine. Our estimates
for vaccine coverage reflect data collected through the end of April 5, 2021.

UT COVID-19 Consortium                     5                          April 12, 2021
References
1.   CDC SVI Data and Documentation Download. 15 Oct 2020 [cited 7 Apr 2021]. Available:
     https://www.atsdr.cdc.gov/placeandhealth/svi/data_documentation_download.html

2.   Javan E, Kushnereit E, Betke B, Woody S, Pasco R, Pierce K, et al. Heterogeneous
     burden of the COVID-19 pandemic in central Texas. University of Texas at Austin; 2020.
     doi:10.15781/m60y-tc90

3.   Texas Department of State Health Services. COVID-19 Vaccine Information. [cited 7 Apr
     2021]. Available: https://www.dshs.texas.gov/coronavirus/immunize/vaccine.aspx

4.   HUD USPS ZIP Code Crosswalk Files. [cited 7 Apr 2021]. Available:
     https://www.huduser.gov/portal/datasets/usps_crosswalk.html

5.   US Census Bureau. American Community Survey 2015-2019 5-Year Data Release. [cited
     7 Apr 2021]. Available: https://www.census.gov/newsroom/press-kits/2020/acs-5-year.html

6.   Salje H, Tran Kiem C, Lefrancq N, Courtejoie N, Bosetti P, Paireau J, et al. Estimating the
     burden of SARS-CoV-2 in France. Science. 2020;369: 208–211.

7.   CDC. COVID-19 and Your Health. 7 Apr 2021 [cited 7 Apr 2021]. Available:
     https://www.cdc.gov/coronavirus/2019-ncov/need-extra-precautions/people-with-medical-co
     nditions.html

8.   CDC. PLACES: Local Data for Better Health. 9 Mar 2021 [cited 7 Apr 2021]. Available:
     https://www.cdc.gov/places/index.html

9.   Estimating the Number of Pregnant Women in a Geographic Area from CDC Division of
     Reproductive Health. Available:
     https://www.cdc.gov/reproductivehealth/emergency/pdfs/PregnacyEstimatoBrochure508.pd
     f

10. Note méthodologique polypathologie de la personne âgée. Available:
    https://www.has-sante.fr/upload/docs/application/pdf/2015-04/note_methodologique_polyp
    athologie_de_la_personne_agee.pdf

11. Rapport-ESPF-2017.pdf. Available:
    https://drees.solidarites-sante.gouv.fr/sites/default/files/2021-01/Rapport-ESPF-2017.pdf

12. Obésité. [cited 7 Apr 2021]. Available:
    https://www.inserm.fr/information-en-sante/dossiers-information/obesite

13. World Health Statistics. [cited 7 Apr 2021]. Available:
    https://www.who.int/data/gho/publications/world-health-statistics

14. Stokes EK, Zambrano LD, Anderson KN, Marder EP, Raz KM, El Burai Felix S, et al.
    Coronavirus Disease 2019 Case Surveillance - United States, January 22-May 30, 2020.
    MMWR Morb Mortal Wkly Rep. 2020;69: 759–765.

UT COVID-19 Consortium                         6                            April 12, 2021
You can also read