Harmonic evaluation of Plug-in Electric Vehicle on distribution network system
←
→
Page content transcription
If your browser does not render page correctly, please read the page content below

IOP Conference Series: Materials Science and Engineering

PAPER • OPEN ACCESS

Harmonic evaluation of Plug-in Electric Vehicle on distribution network
system
To cite this article: K G H Mangunkusumo et al 2021 IOP Conf. Ser.: Mater. Sci. Eng. 1098 042034

View the article online for updates and enhancements.

                              This content was downloaded from IP address 46.4.80.155 on 25/07/2021 at 17:29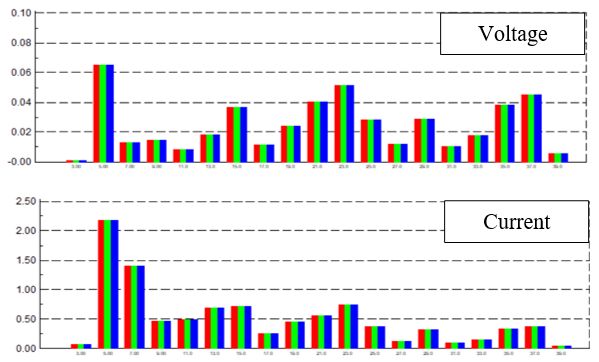
The 5th Annual Applied Science and Engineering Conference (AASEC 2020)                                                   IOP Publishing
IOP Conf. Series: Materials Science and Engineering              1098 (2021) 042034           doi:10.1088/1757-899X/1098/4/042034

Harmonic evaluation of Plug-in Electric Vehicle on
distribution network system

                     K G H Mangunkusumo*, J Hartono and P A A Pramana
                     Transmission and Distribution Department, PLN Research Institute, Jakarta, Indonesia

                     *kevin.mangunkusumo@pln.co.id

                     Abstract. The significant development of plug-in electric vehicle (PEV) is a challenge for
                     distribution networks. The PEV charger is a power electronic device that generates large
                     amounts of power over a period of time to charge EV battery. In addition, the EV on board
                     charger (OBC) also produces harmonics due to the process of converting AC grid voltage to
                     DC voltage. Converter as OBCs main device is a source of harmonics which directly connected
                     to the distribution network. In this study, harmonics from single OBC, multiple OBC and PEV
                     penetration scenario were evaluated and compared with the SPLN standard D5.004-1: 2012.
                     From the study results, THD injected to the distribution network is influenced by the
                     percentage of the base load and PEV penetration. The worst possible condition is occurred
                     under low load conditions while high PEV penetration happens. From the simulation results
                     using the distribution network model especially in residential area, the low base load scenario
                     (10.47%) and the high PEV penetration (90.01%) is generating TDD 6.59% and THDv 2.61%,
                     respectively. Therefore, it is known that the harmonic effects generated by PEV charging to the
                     distribution network still meet SPLN D5.004-1: 2012

1. Introduction
Nowadays, rapid growth of Plug-In electric Vehicle (PEV) are supported by some factors such as
public awareness of global warming, reduce the carbon emissions, expensive price of gasoline [1,2],
and government regulation (Perpres No.55/2019). Most PEVs are equipped with an on-board charger
(OBC) as a battery charging device. OBC converts the AC voltage source from the grid to DC voltage
so that the battery as the power source of electric vehicle (EV) can be recharged. OBC is a switching
mode power supply (SMPS) consisting of an inverter and rectifier with a special topology. OBC based
on power electronic device is a source of harmonics or a harmonic generator when connected to the
network. The PEV is mostly charged overnight at home, so the EV owner can drive it in the morning
with full battery condition. The PEV needs a large amount of energy for fully charge the battery
overnight. This high amount of power for such a specific time will impact on the distribution grid [3].
Home charging EV will contribute significantly to the perceived harmonic, especially in distribution
networks. Therefore, the harmonic value generated while PEV charging process needs to be evaluated.
   There are some studies focusing on the PEV harmonic impact to the grid. Direct measurement
shows that the maximum total harmonic distortion current (THDi) of level 3 charger is 17.3% on the
end of charging cycle. Level 1 and level 2 generate maximum THDi 19.2%, they show higher THDi
than the level 3 charger [4]. The other study is direct measurement on the constant charging stage, the
result shows 11.6% average along the constant power charging state on the fast charging station [5,6].
Actually, the EV charger or OBC show variety of different harmonic patterns and values [7]. Some
              Content from this work may be used under the terms of the Creative Commons Attribution 3.0 licence. Any further distribution
              of this work must maintain attribution to the author(s) and the title of the work, journal citation and DOI.
Published under licence by IOP Publishing Ltd                          1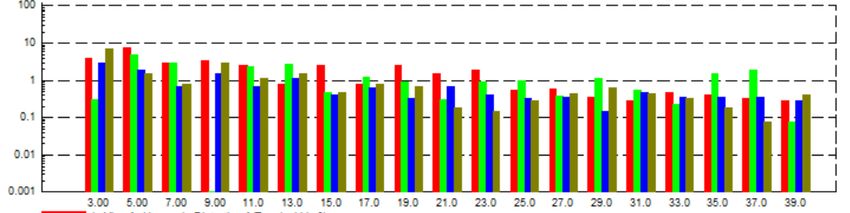
The 5th Annual Applied Science and Engineering Conference (AASEC 2020)                          IOP Publishing
IOP Conf. Series: Materials Science and Engineering   1098 (2021) 042034   doi:10.1088/1757-899X/1098/4/042034

low voltage nonlinear loads are possibly to make harmonic cancellation. The higher number of
customer and the device will result the possibility of harmonic cancellation higher [8]. Some studies
are focusing on harmonic amplitude because of the limitation based on the harmonic standard. On the
other hand, if the diversity of the harmonic charger is not taken into account, there will be
overestimated the harmonic problems [9]. In this study, direct measurement of 4 PEV types will be the
delineated. Multiple OBCs connect to the single point of common coupling (PCC) will show the
characteristic of multiple OBCs harmonic. Distribution network model are constructed to evaluate the
PEV harmonic penetration impact. The diversity of the various type of OBC will be evaluated using
single OBC, multiple OBCs, and penetration scenario evaluation in this study. The objective of the
study is the comprehensive evaluation of PEV penetration focusing on the harmonic evaluation.
   The rest of the paper is organized as follows. Section II describes the methodology for evaluating
the harmonic characteristic of PEV and constructing PEV penetration simulation scenario. The SPLN
D5.004-1: 2012 is described and some harmonic limitations that allowable in the grid are detailed. In
section IV, the simulation result is analysed and evaluated based on the SPLN D5.004-1: 2012.
Finally, the conclusion is given in Section V.

2. Methodology
Harmonic is sinusoidal signal of voltage or current with a frequency value of a multiple of its
fundamental frequency (f = 50Hz). Periodic non-sinusoidal waveform can be decomposed by Fourier
transform which is the sum of fundamental components and harmonic components. The source of
harmonics in power systems is nonlinear load such as electronic equipment, welding machines,
furnaces, and electronic power devices. Most PEV is equipped with an OBC for charging battery.
OBC is a switching mode power supply (SMPS) consisting of an inverter and rectifier with a special
topology. Electronic-based OBC is a source of harmonics when connected to the network. The
harmonic generated by PEV have to comparing it to the standard range of allowable current and
voltage harmonics. In addition, PEV chargers should fulfil the harmonic limit and DC current injection
standard on the allowed grid according to the following standards: IEEE-519, IEEE-1547, SAE-2894,
and IEC-1000-3-6. In this study, SPLN D5.004-1: 2012 [9] is used as a reference to evaluate the
harmonic value generated by PEV against the harmonic value allowed on the distribution network
especially in Indonesia. Table 1 and Table 2 show the voltage and current harmonic limits that must be
maintained in the electric power system. This standard sets limits on the value of harmonics per
component of the harmonic order and the total harmonic distortion (THD) allowed in the system. The
voltage harmonic distortion limit is seen based on the system voltage level. While the current
harmonic limits see the value of the voltage level and short circuit ratio. Short circuit ratio is the ratio
of the maximum short circuit current at the connection point to the maximum load current of the
transformer used.
   The scenario used in this study is the worst possible condition of PEV penetration in distribution
networks, especially in residential areas. The characteristics of PEV harmonics are evaluated by
looking at the values of voltage harmonic distortion and current harmonic distortion in single PEV and
multiple PEV measured at one node or point of common coupling (PCC). Comparison of the value of
the basic load to the penetration of PEV is varied to get the worst possible harmonic conditions that
can be injected into the PEV network.
                                      Table 1. Harmonic voltage limitation.
                                      Individual Harmonic Voltage       Total Harmonic Voltage
Voltage at PCC
                                      Distortion (%)                    Distortion THDVn (%)
Vn ≤ 66kV                             3                                 5
66kV < Vn ≤ 150kV                     1.5                               2.5
Vn > 150kV                            1                                 1.5

                                                         2
The 5th Annual Applied Science and Engineering Conference (AASEC 2020) IOP Publishing
IOP Conf. Series: Materials Science and Engineering 1098 (2021) 042034 doi:10.1088/1757-899X/1098/4/042034
Table 2. Harmonic current limitation.
Vn ≤ 66kV
Maximum Harmonic Current Distortion in % of IL
Ihs/IL Individual Harmonic Orde "h" Odd Harmonic Total Demand
h < 11 11≤h≤17 17≤h≤23 23≤h≤35 35≤h Distortion
1000 15.0% 7.0% 6.0% 2.5% 1.4% 20.0%
3. Results and Discussion
In the distribution network model used, the nominal voltage level was 400V and the value of the short
circuit ratio was 35.11 so that the THDv limit wasThe 5th Annual Applied Science and Engineering Conference (AASEC 2020) IOP Publishing
IOP Conf. Series: Materials Science and Engineering 1098 (2021) 042034 doi:10.1088/1757-899X/1098/4/042034
add up perfectly to each other depending on the phase value per order of harmonic values. From the
simulation results and referring to equation (1) an illustration was made to make it easier to understand
the characteristics of harmonizing summation in the system if there were multiple sources of
harmonics in the network being evaluated. Figure 4 shows an illustration of the characteristics of the
sum of harmonics with the assumption that the two harmonics sources had the same magnitude. So it
was known that if there were several sources of harmonics in a network, the harmonics components
would add up to each other if the angle difference per order of harmonics values was below 90o, add
up perfectly if the angle difference value was exactly 0o, and will subtract if there were more than 90o
and harmonics would be cancel each other if the harmonic component has a 180o angle difference.
Figure 3. PCC Voltage and current harmonic distortion of
single OBC (red, green, and blue are phase A, B, and C).
Figure 4. Harmonic summation characteristic.
Next penetration simulation is carried out in the distribution network. Harmonics generated by the
PEV charging process will be penetrated into a typical distribution network model to get the
harmonics impact on the distribution network, especially in residential area. Analysis will be carried
out by looking at THD value, the evaluated THD value is at the PCC closest to the terminal of
transformer secondary side. The model used in this simulation is a uniformly distributed distribution
network with variations in PEV penetration values and base load conditions. In this simulation we
want to know the effect of PEV penetration on generated THD by varying the value of penetration and
loading under initial conditions. Figure 5 and Figure 6 showed the THDv and THDi value generated
on the network due to variations in PEV penetration and base load value. The biggest THD value in
this simulation is shown by the orange block with PEV penetration value reaching 100%. It can be
seen that the greatest THDi and THDv occur when the base load is low while maximum PEV
penetration occur, the THDi and THDv are 6.73% and 3.08%. The most significant harmonic was
4The 5th Annual Applied Science and Engineering Conference (AASEC 2020) IOP Publishing
IOP Conf. Series: Materials Science and Engineering 1098 (2021) 042034 doi:10.1088/1757-899X/1098/4/042034
happened when the PEV penetration was high while the base load was low. It can also be seen from
the blue block, when high PEV penetration and base load was high, THDi and THDv felt by the
tissues are 3.22% and 1.52%. Therefore, it is known that the worst harmonic conditions occur when
the basic network load is low while the non-linear load in this case the PEV penetration is high. From
the simulation results above then a scenario was formed to evaluate the TDD and THDv. The worst
scenario used was using some assumption, firstly the base load were 10.47% and the PEV penetration
was 90.01% equal to around 99EVs. Specification of the distribution transformer was 400kVA/400V;
3% (%Z).
Figure 5. THDv with varying PEV penetration.
Figure 6. THDi with varying PEV penetration.
5The 5th Annual Applied Science and Engineering Conference (AASEC 2020) IOP Publishing
IOP Conf. Series: Materials Science and Engineering 1098 (2021) 042034 doi:10.1088/1757-899X/1098/4/042034
I
h2
2
h
(2)
TDD x100%
I FL
V
h2
h
2
(3)
THDvn x100%
Vn
Where :
TDD : Total Demand Distortion
THDv: Voltage Total Harmonic Distortion
Ih : Harmonic current order number h
Vh : Harmonic voltage order number h
IFL : System full load current
Vn : Fundamental voltage
To evaluate harmonics based on the SPLN standard D5.004-1: 2012 it is necessary to know the
short circuit ratio and the evaluated system voltage. The network short circuit ratio in this simulation is
33.35 while the system voltage level evaluated is atThe 5th Annual Applied Science and Engineering Conference (AASEC 2020) IOP Publishing
IOP Conf. Series: Materials Science and Engineering 1098 (2021) 042034 doi:10.1088/1757-899X/1098/4/042034
[2] Schneider K, Gerkensmeyer C, Kintner-Meyer M and Fletcher R 2008 Impact assessment of
plug-in hybrid vehicles on pacific northwest distribution systems 2008 IEEE power and
energy society general meeting-conversion and delivery of electrical energy in the 21st
century (IEEE) pp 1–6
[3] Rastegar M, Fotuhi-Firuzabad M and Aminifar F 2012 Load commitment in a smart home Appl.
Energy 96 45–54
[4] Bass R and Zimmerman N 2013 Impacts of electric vehicle charging on electric power
distribution systems
[5] Aljanad A and Mohamed A 2016 Harmonic impact of plug-in hybrid electric vehicle on electric
distribution system Model. Simul. Eng. 2016
[6] Lucas A, Bonavitacola F, Kotsakis E and Fulli G 2015 Grid harmonic impact of multiple
electric vehicle fast charging Electr. Power Syst. Res. 127 13–21
[7] Dharmakeerthi C H, Mithulananthan N and Saha T K 2014 Impact of electric vehicle fast
charging on power system voltage stability Int. J. Electr. Power Energy Syst. 57 241–9
[8] Kim K, Song C S, Byeon G, Jung H, Kim H and Jang G 2013 Power demand and total
harmonic distortion analysis for an EV charging station concept utilizing a battery energy
storage system J. Electr. Eng. Technol. 8 1234–42
[9] Staats P T, Grady W M, Arapostathis A and Thallam R S 1998 A statistical analysis of the
effect of electric vehicle battery charging on distribution system harmonic voltages IEEE
Trans. Power Deliv. 13 640–6
[10] Taylor J, Smith J W and Dugan R 2011 Distribution modeling requirements for integration of
PV, PEV, and storage in a smart grid environment 2011 IEEE Power and Energy Society
General Meeting (IEEE) pp 1–6
[11] Dubey A, Santoso S and Cloud M P 2013 A practical approach to evaluate voltage quality
effects of electric vehicle charging 2013 International Conference on Connected Vehicles
and Expo (ICCVE) (IEEE) pp 188–94
7You can also read